2-Day ABC Trade Example
Our last lesson for 2019 is an important one…
One of the important exercises from the Number One Trading Plan manual is that of the 2-day ABC trade, which commences on page 79. The exercise is to be done by hand, using Safety in the Market charting paper. The main pre-requisite for this exercise is a thorough understanding of Multi-Day Swing Charts, detailed from page 59 onwards.
The objective of this month’s article is again a simple one – to take a current example, and make sure that we have correct all of our trade entry and exit parameters. As usual ProfitSource will be used in Walk Thru mode to help with the illustration of the example.
The example trade this time is the Cotton Futures market (CT-SpotV in ProfitSource). It was a 2 day ABC short trade, with entry signalled late in July of this year, at confirmation of a top in the 2-Day swing chart. We will obviously be back testing this trade, aiming to determine its performance using the “Currency” style of trade management – i.e. exit at the 100% milestone.
Let’s now formally identify the trade:
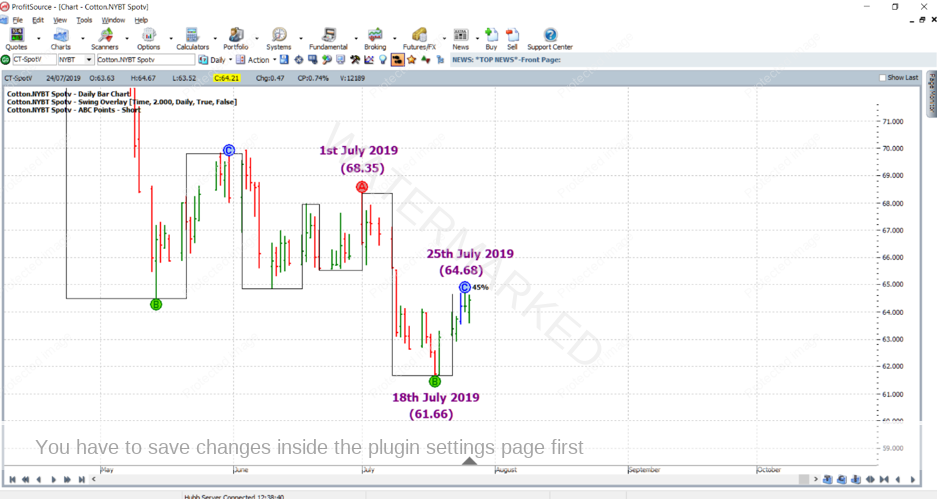
Point A at 68.35 1st July 2019
Point B at 61.66 18th July 2019
Point C at 64.68 25th July 2019
This trade, prior to its entry, is shown in the chart below, using Walk Thru mode. Note that the 2-Day Swing Overlay indicator has also been applied (with its Points/Periods setting set to “2” i.e. 2 for a 2-Day swing overlay as opposed to the usual default value of “1” for a 1-Day swing overlay).
Note also for the above chart that the ABC Points – Short hi-lite has been applied, and that one of its settings (Filters tab/Swing Periods field) has been changed from 1 to 2 so as to highlight 2-Day ABC trades as opposed to our standard 1-Day ABC trades.
After identifying the trade, the next thing we do of course is calculate the AB reference range:
A – B = 68.35 – 61.66 = 6.69 = 669 points
Then we divide this reference range into quarters, thirds and halves. While we’re at it, let’s also work out 75% of the reference range.
25% of 6.69 = 1.6725
33% of 6.69 = 2.23
50% of 6.69 = 3.345
75% of 6.69 = 5.0175
And this is done in order to determine the milestones of the trade:
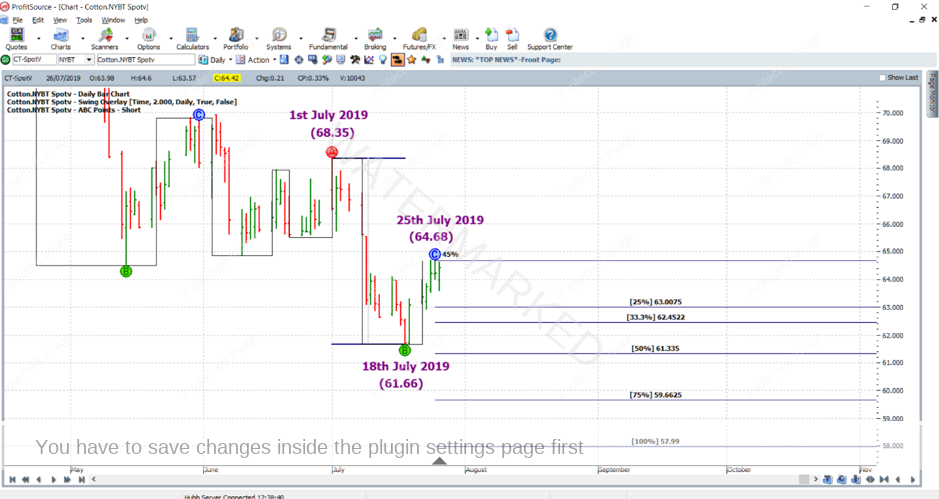
25% milestone = Point C – 25% of the AB range = 64.68 – 1.6725 = 63.00 (rounded down)
33% milestone = Point C – 33% of the AB range = 64.68 – 2.23 = 62.45
50% milestone = Point C – 50% of the AB range = 64.68 – 3.345 = 61.34 (rounded up)
75% milestone = Point C – 75% of the AB range = 64.68 – 5.0175 = 59.67 (rounded up)
100% milestone = Point C – 100% of the AB range = 64.68 – 6.69 = 57.99
The chart below shows how we can use ProfitSource to validate our calculations (having right clicked on any of the points A, B or C and selected “Draw ABC Pressure Points”).
And the entry parameters…..
Entry at 63.56 (order placed on Monday 29th July 2019 prior to market opening) = low of the day after Point C – 1 point = 63.57 – 1 point
Entry Limit = 33% milestone = 62.45
Initial Stop loss (also placed on 29th July 2019) at 64.69 = high of Point C + 1 point
Exit Target = 100% milestone = 57.99
Estimated Point C = (Point A + Point B)/2 = (68.35 + 61.66)/2 = 65.01
So how did this trade perform…?
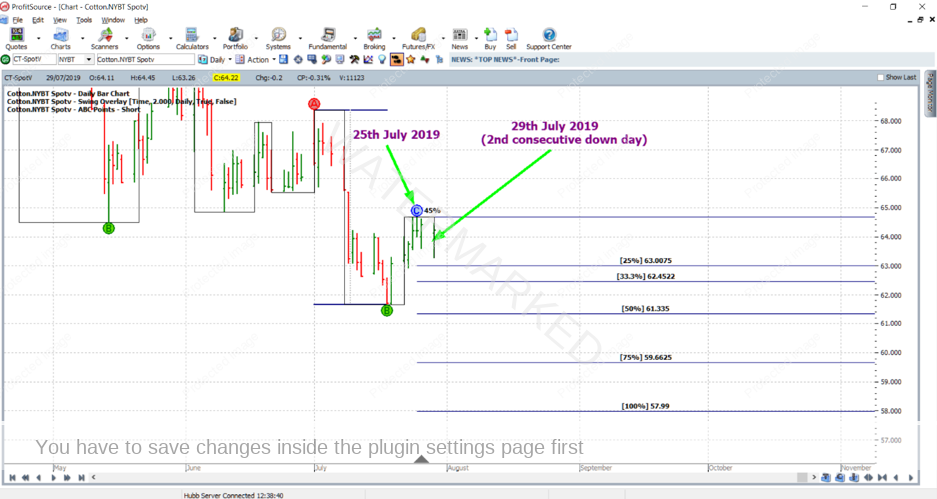
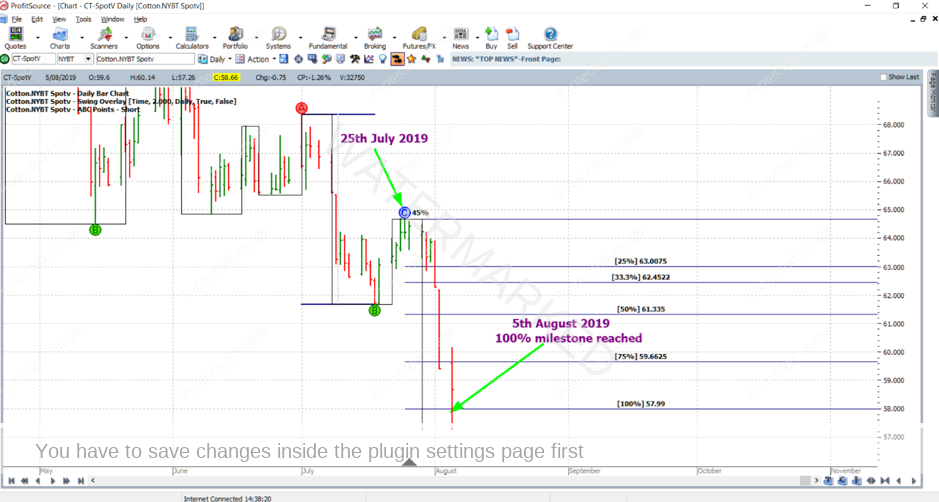
As can be seen by progressing through with walk through mode (using the buttons in the bottom left hand corner of the chart) for another trading day, entry was achieved (well within the 33% entry limit) on the 29th July after the second consecutive day down from the Point C top:
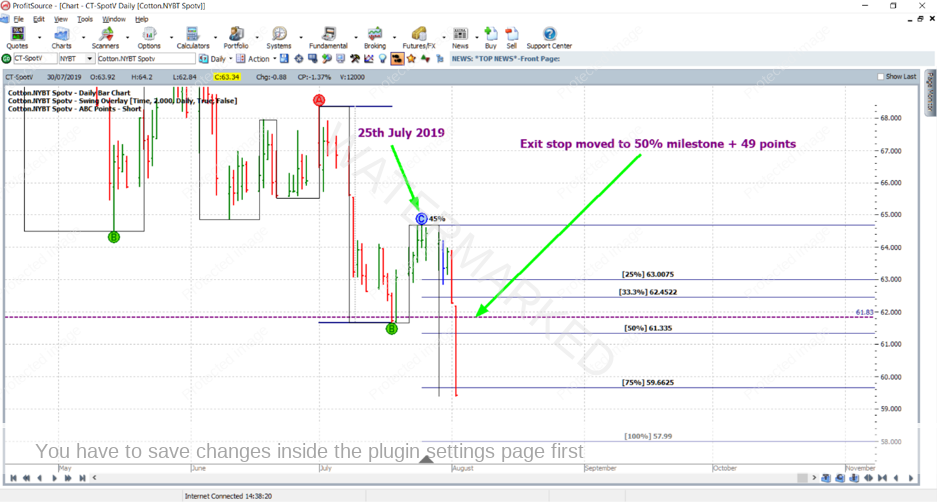
And then four trading days later the market had a big down day and made it to the 50% milestone (immediately upon which you would move your exit stop from C+1 to Entry minus commission), and also the 75% milestone. And at the end of this trading day we will move stops to one-third of the average daily range (in this case I have used approximately one-third of the average range of the last 60 daily trading bars), which is 49 points, above the 50% milestone.
This will be 61.34 (the 50% milestone) + 0.49 = 61.83
This will have locked in some profit as our trade reached the 75% milestone.
As for the remainder of the trade, moving forwards in Walk Thru mode, just one more trading day to 5 August 2019, the 100% milestone was reached and the trade closed:
The profit calculations:
Entry = 63.56
Exit = 57.99
Profit = 5.57 = 557 points (557 x USD$5 = USD$1,114)
Cotton futures can be traded through the Intercontinental Exchange (the “ICE”), 9.00PM to 2.20PM New York Time. Each point of price movement (1/100 of a cent per pound) changes the value of one contract by USD$5. The current initial margin is USD$2,650, and currently the March 2020 contract is trading at the highest volume. For those still wishing to access this market with much lower margin, through some brokers it can be traded using CFDs.
Work Hard, Work Smart!
Andrew Baraniak
