TSLA Series – Fast Trend
The biggest question this month was where to start this February article. It has been a very active month the past 30 days! First things first, for those who were able to get themselves into gear in a hurry, there sure were some rewards to be had on Tesla. We have also seen the Australian Share Price Index break its October 2007 all-time high as well as plenty of US markets springing to life with their quarterly earnings. The opportunities for 2020 are already presenting themselves, so be ready for what is to come.
I will reiterate the point that 2020 is shaping up to be a very opportunistic year with plenty of markets to take advantage of, and it is our aim at Safety in the Market to provide concepts to further your education.
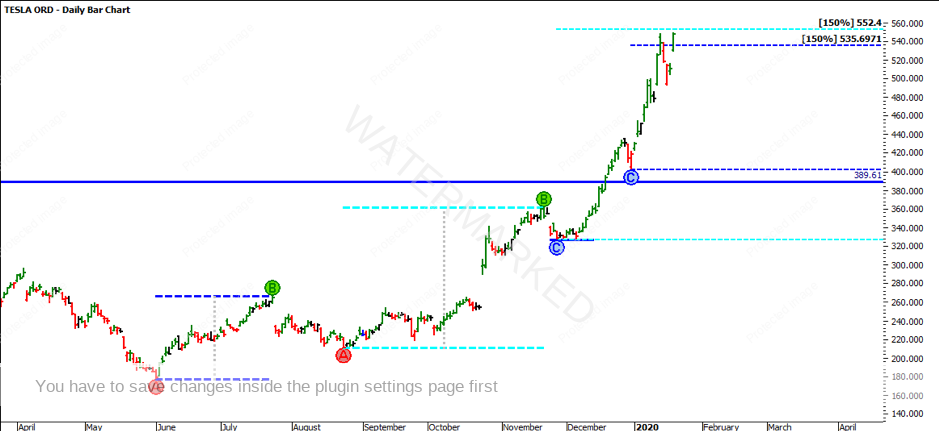
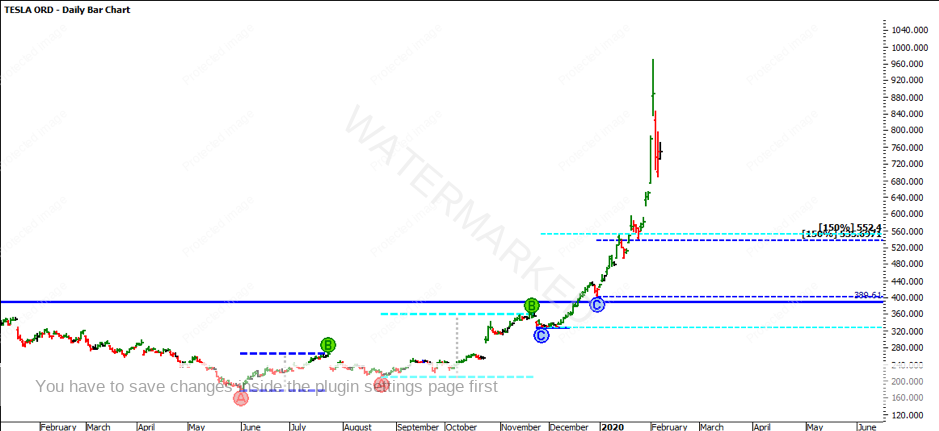
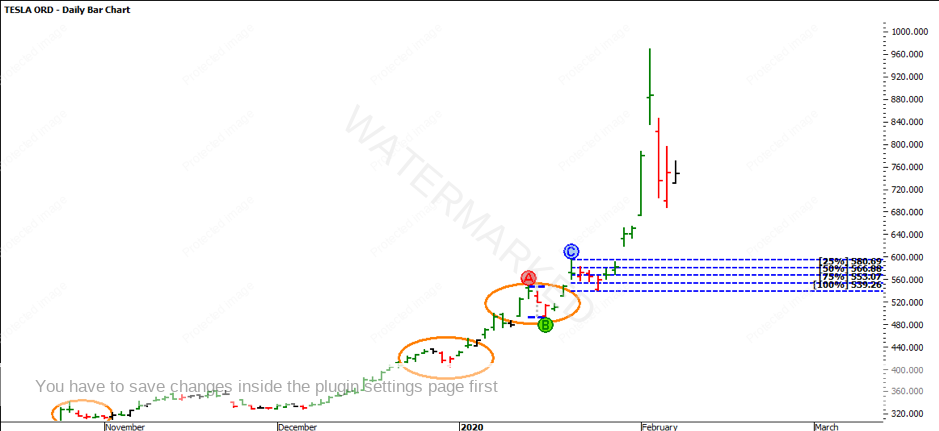
This month we will continue our TSLA Series, as it was only last month that TSLA was trading at $510, with a new All Time High reaching $547.41 on 14 January 2020. Since then, TSLA made a new all-time on 4 February at $968.99. Those who have been hand charting the bull run will have seen this clearly in terms of scale, though this can also be seen in the two charts below, the first being around 20 January 2020 and the second being 7 February 2020.
With such a sharp move in price, it is clear a larger pullback is needed in comparison to the previous pullbacks. The market is in what is called an ‘abnormal trend’. Those who were able to take the last two ABC trades using leveraged instruments such as CFDs would have done very well! We will look to cover these a bit later in the article.
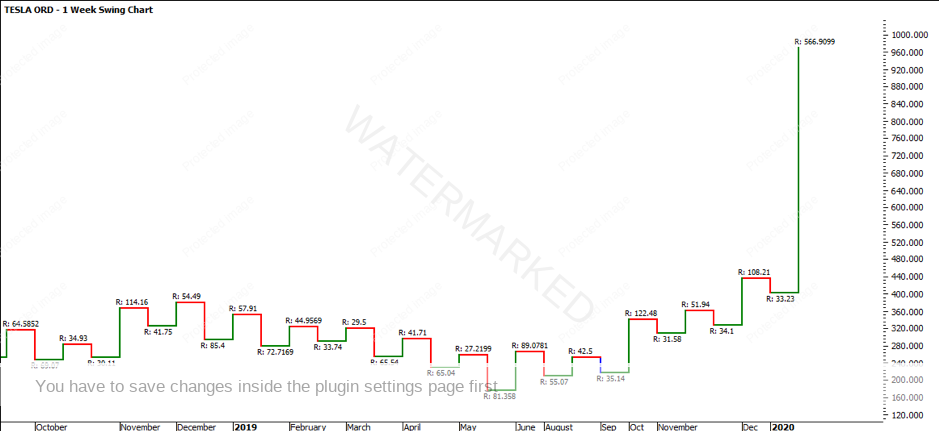
As our standard practice goes, turning to the charts below, we will skip the quarterly swing chart as it is the same as last month. It has created a higher top making the trend uncertain. Remember the trend needs to move through uncertain in order to be an uptrend.
We will spend more time on the small-time frames such as the weekly, 2 day and daily chart. The reason for this is because the market has moved through price in such a short period of time making it a strongly trending market. Anything larger than a weekly chart, which really is just giving us bigger picture perspective, will be far too delayed.
As you can see below in the weekly swing chart, the trend is currently up showing higher tops and higher bottoms. It is an Overbalance in Price, showing a range of $566.90 compared to the last swing of $108.21. It is very unlikely that the range of $566.90 will repeat, so it is best to refocus on the smaller timeframes. That comment isn’t to say disregard the weekly swing chart, but it is to be aware of it not responding directly too it.
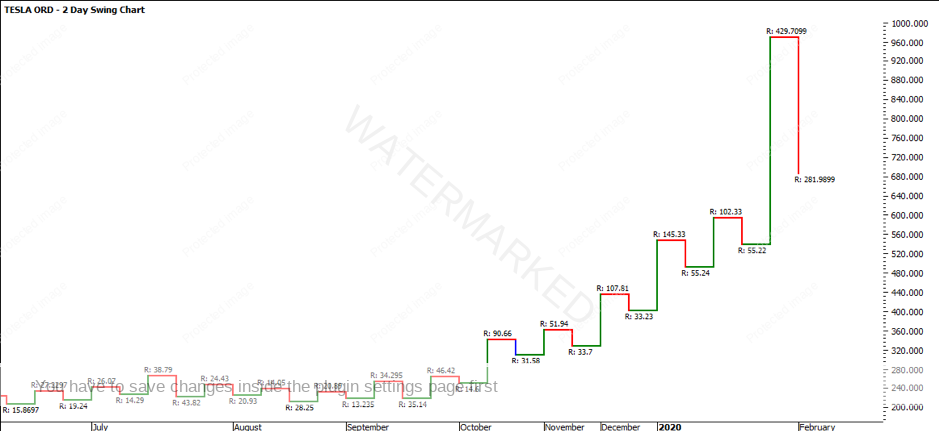
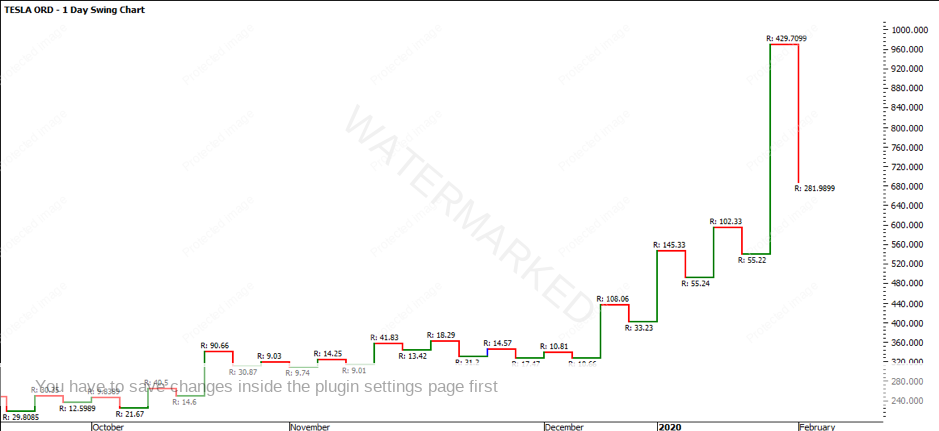
The 2-day swing chart is also very similar to the weekly chart, showing the most recent upswing to be $429.70. The 2-day swing chart similarly has over exhausted itself, which ultimately produced a significantly larger pullback as mentioned before. The swing down was $281.98 compared to the consistent pullbacks around $55. Watching for how many days the market moves down will be a subtle sign as to what the next move might be.
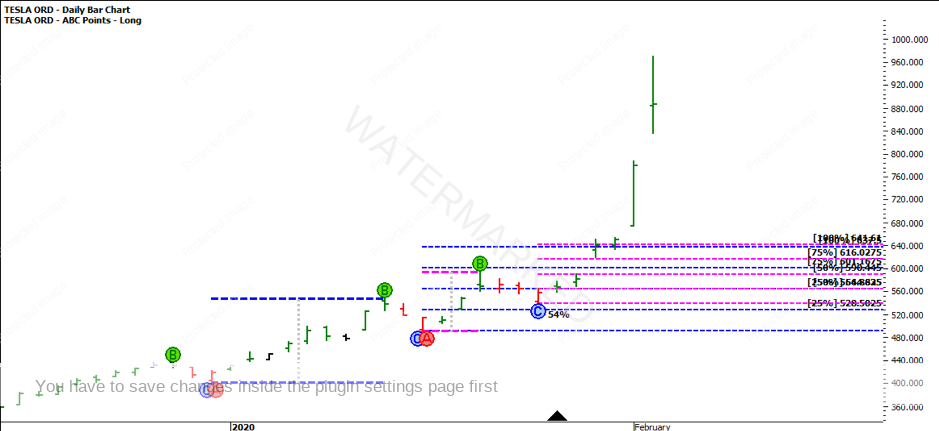
Due to the fast nature of the market at present it will be the daily chart which provides the fastest reaction. As you can see below, the 1 day swing chart looks almost identical to the 2-day swing chart. For this reason, by keeping an eye on both the 1 day and 2-day swing charts you will not be suffocating your trades, but you will have a good reason to lock in profits when they need to be locked in.
One point that was made last month was when the market starts to show signs of weakness it will be worth watching how many consecutive days it pulls back. You will note that there is very little evidence of the market pulling back for more than two consecutive days still since October 2019. Yes, between the 23 and 27 January 2020 we have three consecutive days down, but this pullback was no bigger than the previous one on 15-16 January. In recent times we have seen a deeper pullback on 5 and 6 February but we have not yet exceeded the days down.
As the market continues to steam ahead, it is very easy to get caught trying to pick the top. At present we can watch to see how many days down it does in comparison to what has happened. Let’s take the time to review the two previous swing trades which would currently have you still in the market at this stage. We will focus on the last two trades in 2020 for the basis of this example.
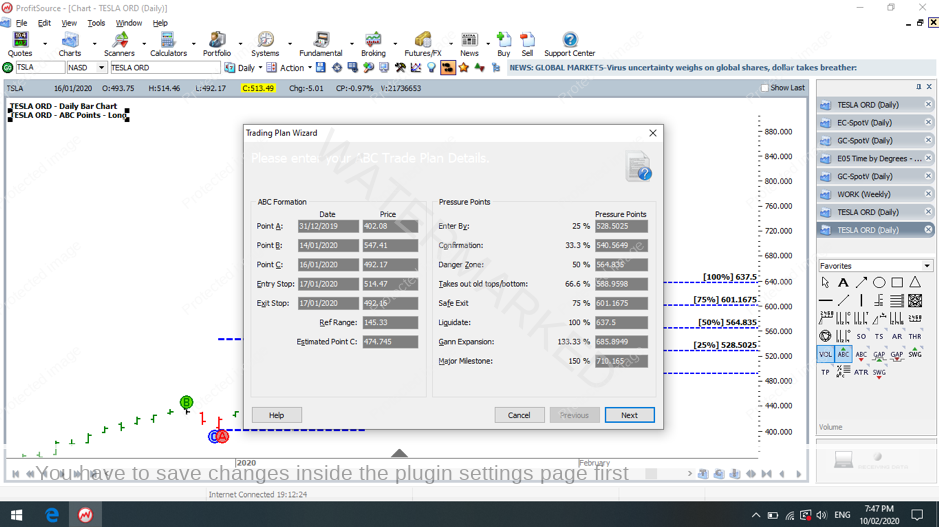
The first of the two ABC swing trades was on 17 January 2020. At this point in the market, we had cleared the previous All Time High and were sitting above it. Remember there is no ceiling in a market that has just strongly broken it’s previous All Time High.
As you can see in the trading plan below, Point C would have provided an entry stop at $514.47, a stop limit at $528.50 and a stop loss at $492.16. The risk per share on this trade would be $36.34. Assuming you had a $10,000 trading account and were risking 5% ($500), you can take 13 CFDs ($500/$36.34 = 13.75).
As the market pulled away and depending on your stop loss strategy at 50% of the ABC which was $564.83, you would have moved stops to entry plus commission. Upon doing that, over the next three days between 23 – 27 January, emotions might have gotten the better of you. Then, a new ABC was generated.
Reviewing the second ABC as a pyramid strategy in the trading plan below, Point C would have provided an entry stop at $564.45, a stop limit at $564.86 and a stop loss at $539.27. The risk per share on this trade would be $25.59. Assuming you have a $10,000 trading account with $500 at risk already and therefore the trade risk is 5% of $9,500, 5% would be $475, you can take 18 CFDs ($475/$25.59 = 18.56). Notice that the 100% levels for both ABCs line up.
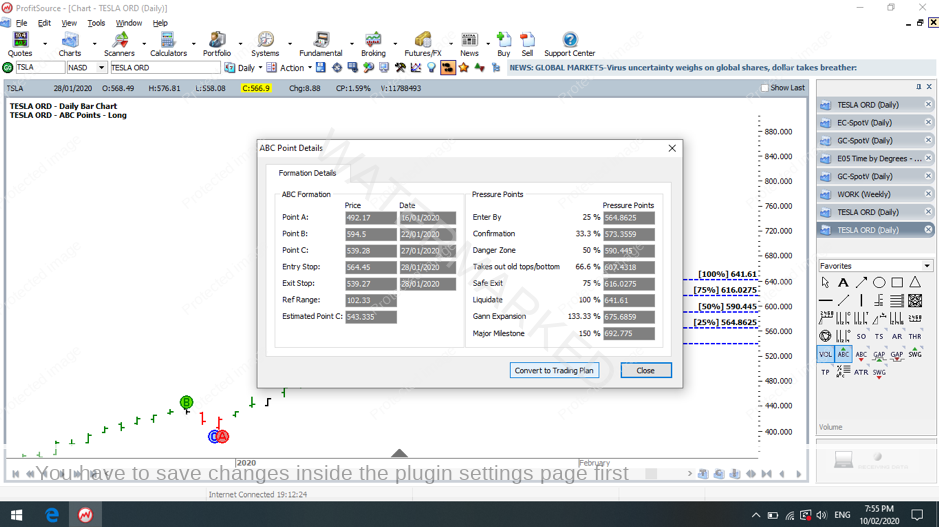
As history goes, both trades hit their 100% milestone three days after on 30 January 2020. Profits would have been healthy with trade one yielding $1,599 (minus comms) and trade two yielding $1,381.50 (minus comms), giving you a total profit of $2,980.50 (minus comms) or gross 29.8% in two weeks. For those who did take profit at 100%, the following three days you would be kicking yourself!
While all this looks simple, those who have been trading this since mid 2019 would have been able to constantly put their trading plans to the test. Sometimes we miss life changing runs, but the next opportunity is always around the corner.
It’s Your Perception,
Robert Steer
