A Simple Price Cluster
In this month’s article, let’s take another look at a very good style of price cluster which involves some straight forward use of the Ranges Resistance Card (RRC). This article is a follow up to the one I wrote about the corn market in our October 2018 newsletter. Even though that was a while ago, there have certainly been other good examples of this type of price cluster since. And they can make for a very high probability trade.
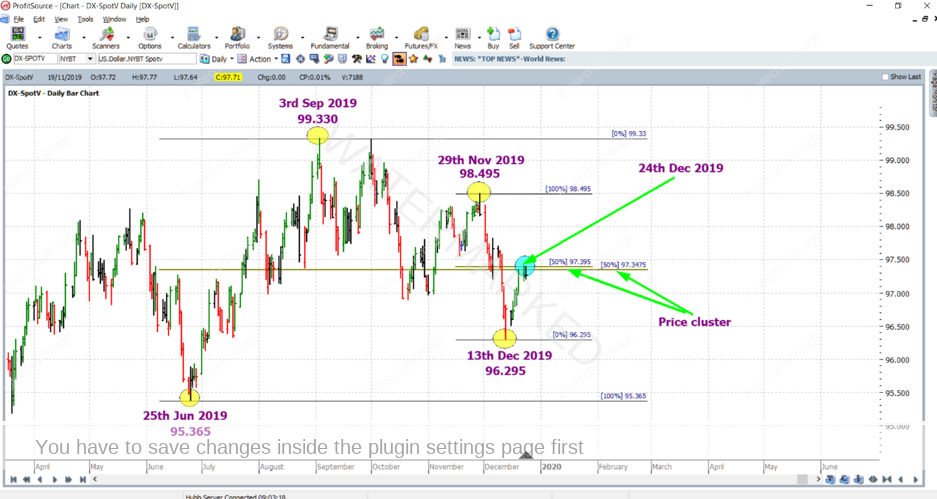
The 50% resistance level of any range is always one to watch for a turn in the market – especially if it is a good sized range, and even more especially if it coincides (or clusters) with the 50% resistance level of another range. Apply the Gann Retracement Tool to as many ranges as you can on a market. Doing this regularly can reveal powerful price clusters like the one below, which would certainly have us on alert for a turn in the market:
The example above is for the US Dollar Index futures market, chart symbol DX-SpotV in ProfitSource. It’s a nice tight price cluster, in other words with little, tolerable error. I’ve used Walk Through Mode, and data is shown up until and including 24 December 2019. This was an inside day, but the day before, the 23rd made its top at 97.405, only false breaking one of the 50% resistance levels, 97.395 by a few points, and still very close to the other 50% resistance level of 97.350 (rounded from 97.3475).
Obviously in this article we will use the benefit of hindsight. But – at this point in time, just after trading closed for Christmas Eve, all we had in front of us was the data shown in the chart above, with a market which had the potential to turn. Did that mean the market had to turn with 100% certainty? No, most certainly not. But the quality of this cluster meant that we would have been on alert for a high probability turn in the market, and be ready with a plan to trade it.
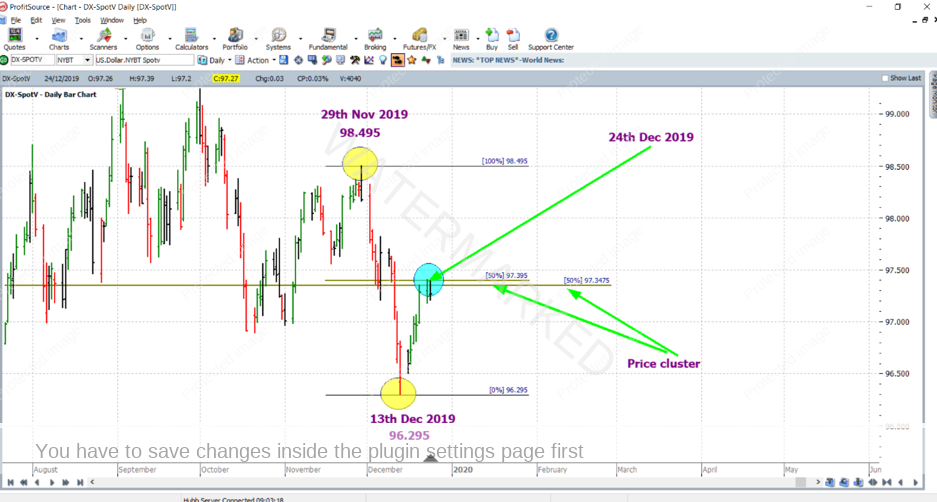
Just before we look at what eventually unfolded, let’s zoom in for a little more clarity:
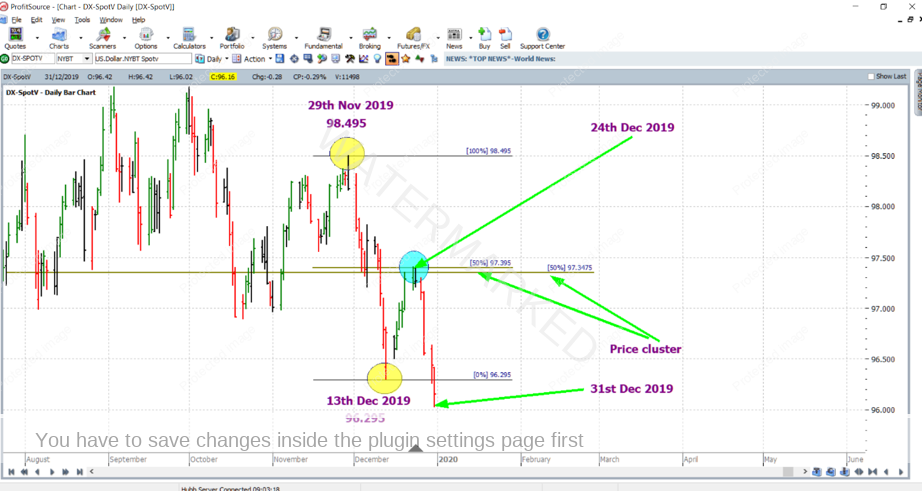
Now let’s now see how things panned out:
As you can see above, the market then had a strong and clean run down lasting four days until 31 December.
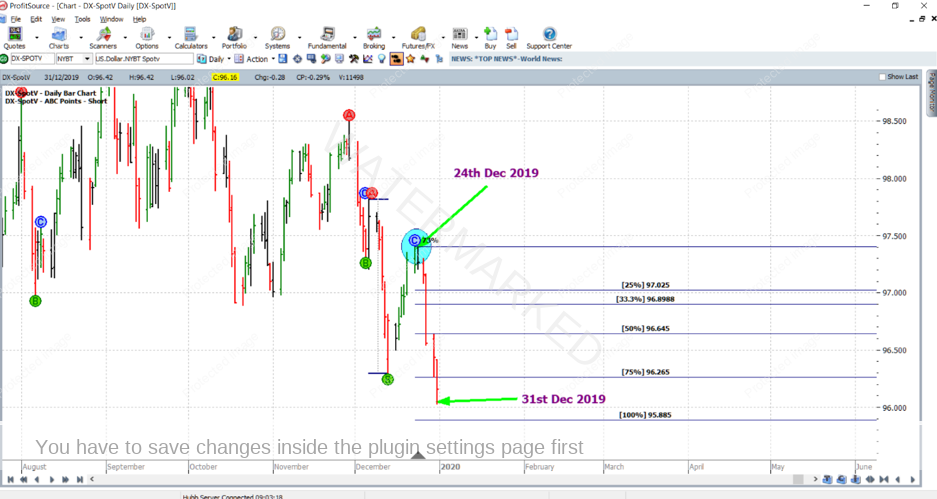
So how might we trade this? This will obviously depend on our trading plan. A simple ABC short trade managed “Stock Style” (enter by 25%, exit by 75%) would have been a conservative but solid trade. Even though exiting at 75%, the reward to risk ratio offering certainly could have been worse – thanks to a relatively small sized Point C daily bar, which, even better was followed by an inside day.
Finally, there was a simple piece of time analysis in favour of this trade, making it of even higher probability, but that’s beyond the scope of this article.
So now that we’ve seen the analysis and execution of a trade like this, how do we capture more? The answer is to maintain a routine of manually scrolling through a list of markets on a regular basis. Focus on applying only one tool, with one setting. This is the Gann Retracement Tool, which in ProfitSource we use to create the RRC. Go to its settings, and turn off all but the 50% resistance level. Make this your default setting as you scroll through your list.
Sound easy? Yes. Easy to do once? Yes. Easy to do every trading day of the year, or even once every single week? No! Why? Because, rightly so, life gets in the way. A normal and completely fair enough excuse for all of us. And the example above is no exception, as the trade came very close to Christmas time – the most popular time of the year to drop everything and take a break.
So how can we overcome the logistics? The important thing is to consciously focus a lot to begin with, in order to establish the routine. This can take a while, but once established it will be much easier to maintain. Try it for a month, and see how you go. Pay particular attention on the days when your schedule is a lot busier than normal. If you can maintain your routine on those days, it’s a good sign. And of course it’s not just the scanning and analysis like in the example above, that we can choose to do routinely – almost every other aspect to our trading should have an established routine. Also, if you practice maintaining a routine with other areas in our lives, this will rub off on your trading in a positive way.
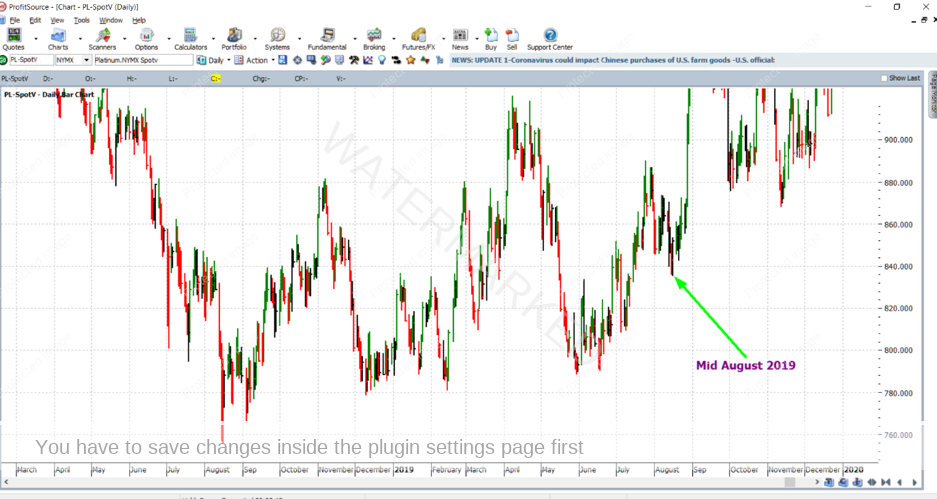
One more thing before I let you go…. There’s some homework! For reference, see the chart below. It’s for the Platinum futures market (chart symbol PL-SpotV in ProfitSource). Essentially I’ve shown data from 2018/2019.
Your job here is to do a little back testing and identify a similar price cluster to the one discussed at the beginning of this article. Hint: it was possible to take advantage of this cluster in the Platinum market during August of 2019. Open up ProfitSource and try to apply the Gann Retracement Tool to a few of the ranges in the Platinum futures chart from the period of data shown above. Create a chart like the first one in this article. Send it to us for comments at tradingtutors@safetyinthemarket.com.au
Work hard, work smart.
Andrew Baraniak
