fbpx

Let Hindsight Guide You

Welcome to the 2020 Platinum Newsletter! A new decade and a new year, 2020 is going to be an opportunistic one! 20/20 hindsight means it is easy to understand something after it has already happened. The expression, hindsight is 20/20, is usually said in answer to an admonishment that the person should have known something would happen, or that the person made a bad decision.

As a Safety in the Market Super Trader, you’d know by now that in the early 1900s, W.D. Gann discovered that market retracements tended to occur at the halfway mark of the original move from the low to the high. In fact, Gann commented that the most profitable retracement is a 50% retracement. By mastering this set up, it became one of the many reasons why I love trading. Hindsight started guiding me to find the exact same set up that has worked previously and replicate it over and over again on other markets.

As a bull market would pull back into the 50% level, one could assume to buy as if the trend would resume. Gann saw retracements occurring at the halfway point of a move, such as 50% – which is half of 100, 25% – which is half of 50%, and 12.5% which is half of 25%. While every market is different, it sometimes doesn’t show the actual percentage change at precisely 50%, but rather in a range of 45 to 55%. For those who have done this sort of research, you will know to look at the market like a ‘loose garment’ as David suggested. The importance here is that the danger zone provides opportunity and that is what we will be exploring in this article.

To illustrate 20/20 hindsight using the Gann 50% retracement tool, we will explore the drop to the 50% level (danger zone) on Tesla (NASD: TSLA) vs the 50% drop that occurred on Slack Technologies (NASD: WORK).

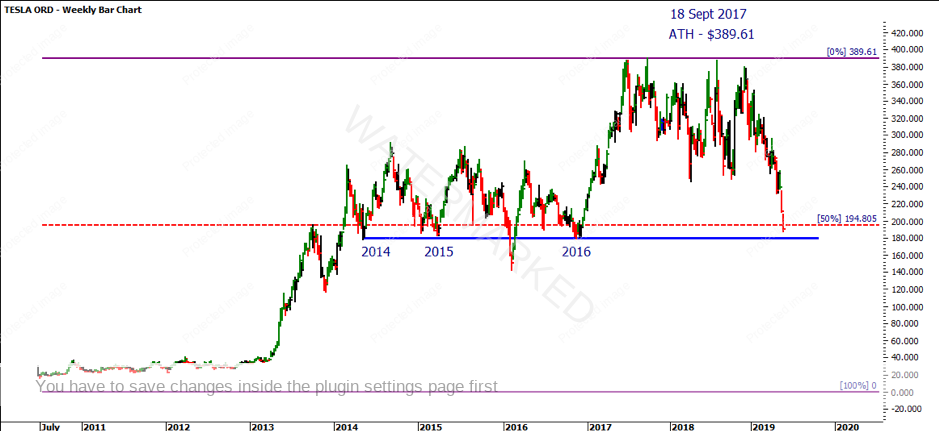
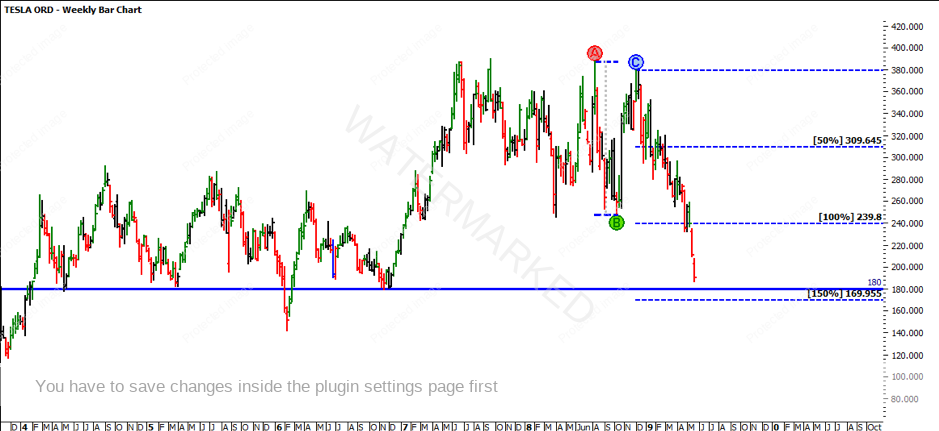
Tesla’s All Time High (ATH) (prior to it’s recent run up!) was $389.61 on 18 September 2017. Applying a High’s Resistance Card to this seasonal top you can see that the market broke through the 50% level at $194.80. As the market broke this 50% level, it doesn’t mean the theory is wrong – if you do note the previous 2014, 2015 and 2016 lows all sat below the 50% level and hence it would be common for a market to retest these lows.

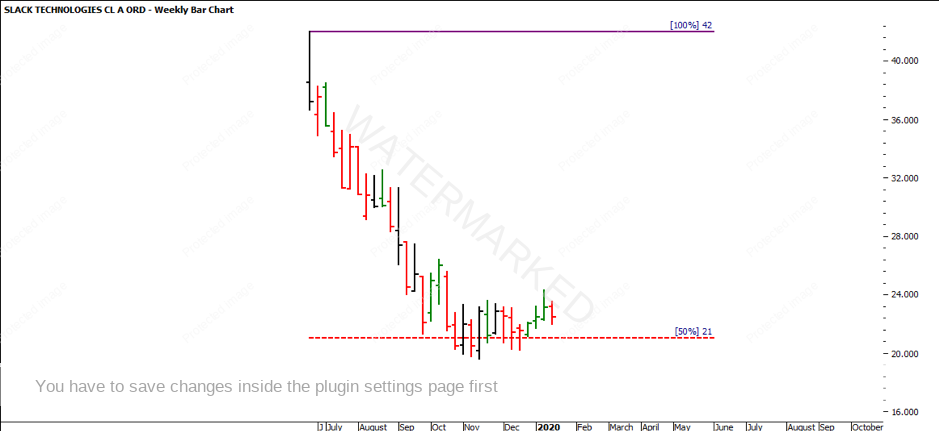
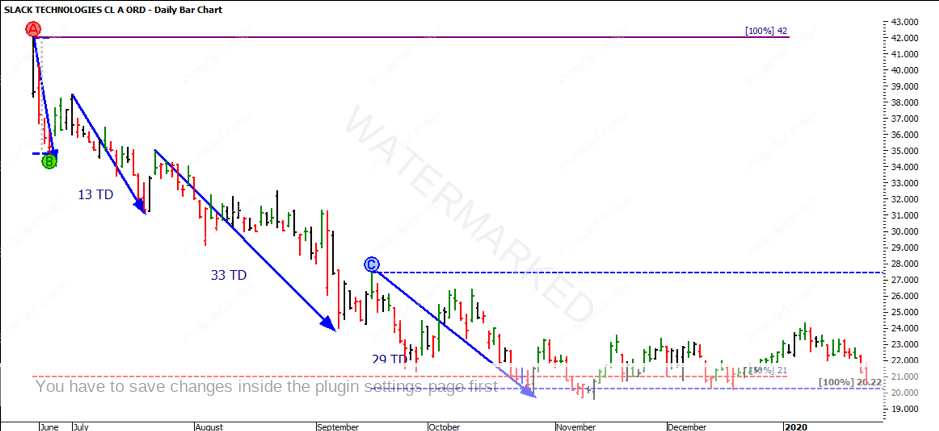
Turning our attention to Slack Technologies (WORK), WORK has its All Time High (ATH) at $42.00 on 20 June 2019. Applying a High’s Resistance Card to this seasonal top you can see that the market broke through the 50% level at $21.00. It is clear that while the market broke the 50% level, it was still able to find a support level.
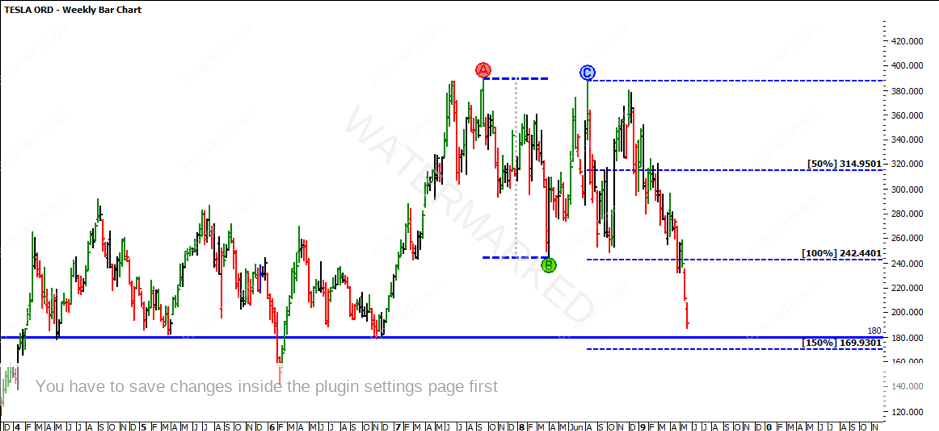
TSLA produced a number of highs (triple tops) at the time of making its ATH. By taking the two highest prices off the triple tops, the first being the ATH at $389.61 and the second being on 7 August 2018 at $387.46, we can look for clusters around the $180 mark or the 54% level. As a side note, all triple tops fell on seasonal dates. Using the reference range from the ATH to the April 2018 low at $244.59, you get $145.01. This range was previously seen in the pullback from September 2014 to February 2016 range. Projecting $145.01 from the 7 August top, 100% comes in at $242.44 and 150% at $169.93.

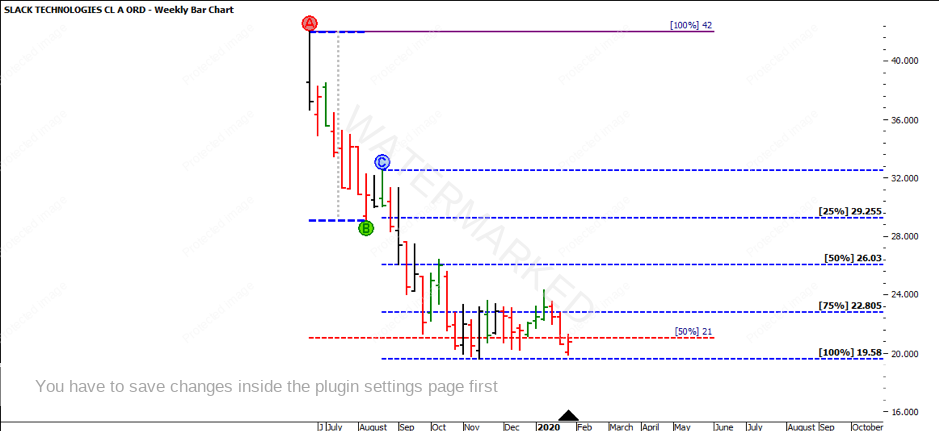
WORK only had its IPO on 20 June 2019, which was the day of its ATH, so there isn’t a large amount of historical data available, however by applying the FRO from 20 June 2019 to 5 August 2019, it produced a range of $12.90 in 31 trading days. Projecting the FRO from 22 August, gives us a projected 100% milestone at $19.58. The market bottomed at $19.53 on 12 November 2019 in 57 trading days, close to 100% in price repeat and 200% in time.

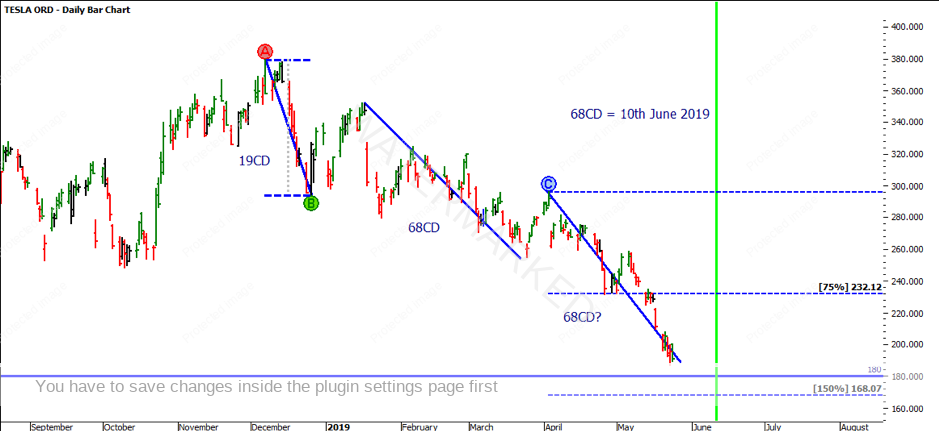
Applying the ABC pressure point tool to TSLA on the 7 August 2018 top to the 10 October 2018 low, the reference range is $139.69. Projecting this from the lower swing top on 7 December 2018, the 150% level projects out to $169.96. The market however only made its low at $176.99 on 3 June 2019.
The most recent bear market which started in late 2018 shows a FRO of $85.40 in 19 calendar days. Projecting $85.40 from the 17 January 2019 high, the 100% milestone comes in at $266.60, though the market overshot the 100% and bottomed at $254.46 in 68 calendar days, which is approximately three and a half multiples of the FRO.

Projecting the FRO from the 3 April 2019 high at $296.17 – the market overshot 100%, with the 150% level projected to be at $168.07. This clusters with our other price points. Projecting 68 calendar days from 3 April 2019 provides an estimate date of 10 June 2019.

Breaking down the bear market run on WORK, the FRO on the daily chart from 20 to 25 June 2019 produced a range of $7.19. Projecting this from 1 July 2019 the 100% repeats at $31.25. The market lowed on 22 July 2019 at $31.18. Projecting the FRO from 23 July 2019, which would be the start of the third section, the market pushed through the 100% level at $27.75, but found support at 150% at $24.15. Finally projecting the FRO from the start of the fourth section on 17 September at $27.41, the 100% milestone comes in at $20.22, and the market bottomed on 28 October 2019 at $19.86.
Upon reflection of TSLA and WORK’s 50% retracement bottoms, you can see by lining up an ATH 50% retracement with repeating ranges and patience, the market can start to accumulate on these support levels prior to turning around and having a somewhat aggressive move. However the markets decide to play out in the future, it is often a good strategy to wear the market like a ‘loose garment’. The market isn’t always going to precisely react to 50%, but rather, it might take a few attempts to form its bottom.

It is important to have done your own research, and it is encouraged to explore the concepts in the article more freely as there are a few hidden gems within for those who are prepared to do the work.

It’s Your Perception,

Robert Steer