Oil – It’s a Slippery Slope
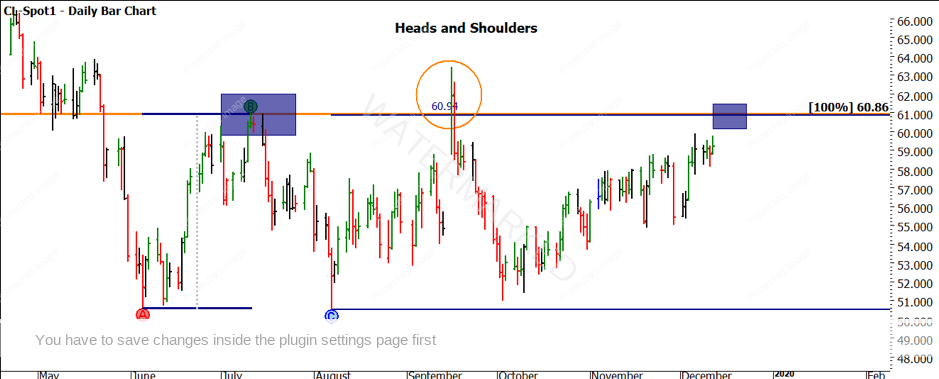
Welcome to the Platinum Newsletter for 2020 and the first chance we have had to catch up on the price movement over the last 60 days or so on Crude Oil. For those who followed my articles in the last few months of 2019 you would have seen that I was looking for a potential turning point in December around the seasonal date at a price of $60.86.
Looking back over my trading history, December has been kind to me, especially on Crude Oil so it was fair to say that my trading setups were running a little bit on muscle memory as we came into an important area to watch. This can be a blessing as well as a curse as sometimes we get too focused on our predetermined ideas and miss the obvious signals that are in front of us. The positive can be that we’ve seen these patterns develop before our subconscious kicks in and steadies our hand, as we look to implement our trading plan.
I have included the chart below from the December article for your reference.
Chart 1 – Daily Bar Chart Crude Oil December 2019
As we know with the forecasting process, all it does is allow us to identify areas of price and time support or resistance to then implement a well-defined trading plan. Still, the potential for us to be wrong is a real possibility. Forecasting gets us looking for potential places for the market to change trend, but by now you should be fully aware that it’s the trading process that allows us to turn this analysis into actual outcomes. I have been fortunate in the past to be correct with forecast dates and prices, only to see a trading signal not present itself or trading the turn poorly which lead to a break-even or losing trade.
Whilst this allows us to “crow” about our forecasting prowess, it doesn’t do much to build the bank balance. So in the spirit of calling out successes as well as failures, I wanted to take you through my thought process and analysis as the pressure point in time and price came and went without the desired changing trend that I was looking for.
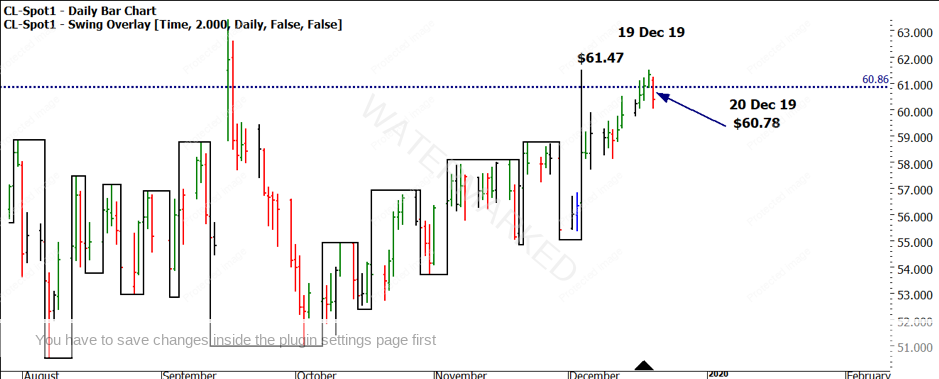
In Chart 2 we can see the price action moved up towards our seasonal time/anniversary of 19 December and very close to our price target. The following day produced a down day, the first in several days. This confirmed a swing top on the one-day chart, but as you can see with the two-day swing overlay on the chart, the trend was very clearly up. Depending on how aggressive your trading strategy was, in cases like this a short entry was possible but proved to be the wrong decision.
Chart 2 – Daily Bar Chart Crude Oil
Risk management is critical around these counter-trend trades as we want to ensure that if we are wrong, we only recognise a small loss.
My thinking at the time was if the market is strong enough to break through this time and price pressure point, who am I to argue with the market? Hence, more experienced traders might look to stop and reverse in a situation like this, where new traders may either wait for a more conservative entry or take the initial loss and wait for the next signal from the market.
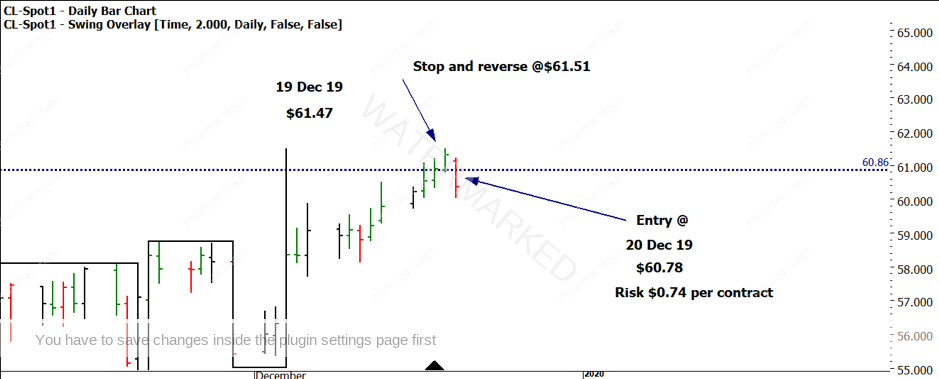
Chart 3 shows what was the initial entry on 20 December as the market went down. A stop was placed at $61.51, a little above the swing top, which is a small price filter to attempt to prevent being just stopped out. The difference here was the plan to stop and reverse i.e. cease being short and now enter long in the same order.
Chart 3 – Daily Bar Chart Crude Oil
Based on the scenario in Chart 3 we had the whole weekend to ponder the short position and wonder how it would unfold in the week ahead. I find the great part about this time of year and trading is you are often busy and tired due to festivities so there is less “tinkering” and more following the plan you have laid out.
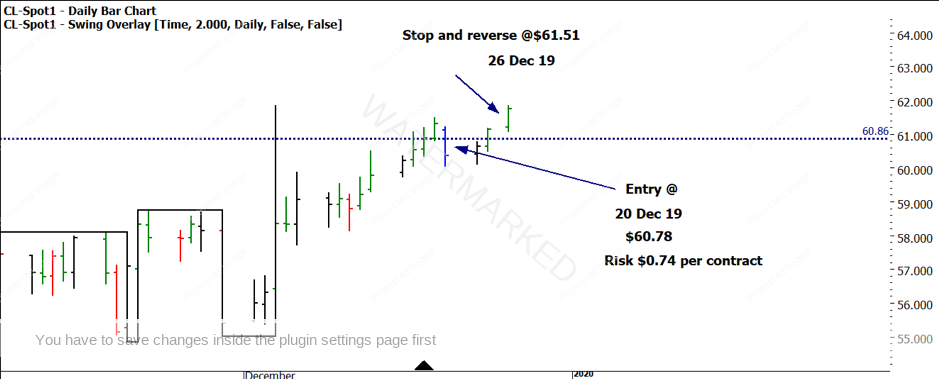
Chart 4 shows how the short position failed to materialise into anything positive and on 26 December the stop and reverse was triggered, and a long position initiated (or closing the short at a loss.)
Chart 4 – Daily Bar Chart Crude Oil
It’s important to note that the 1,2, 3 day and weekly swing chart trends were all up, so we can’t be too surprised when we attempt to trade counter trend, that we can be wrong a lot. The important thing is risk and reward on these setups, when right, can be large so it’s about playing the numbers.
At this stage one of two minds takes over, the forecaster wants to know why the pressure points did not pay off, the trader is looking to make back any loses to at least break even, maybe a small profit. The thinking for me was to get the balance sheet back in the black and work out if this market was ready to turn or not. A trailing stop behind the low of the bars ensured a break-even outcome from the losses of the initial short entry.
The next job is to start to look for future dates to watch, one of the hints I will give you is when David used to talk about his “rogue dates” these would typically come in 15 degrees before or after his forecast dates and often mucked around a perfectly good forecast.
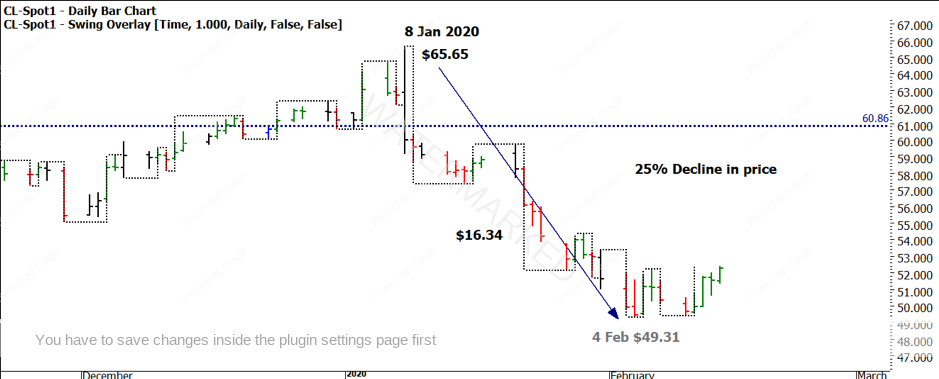
I think this is what has occurred in this case, as we look from mid-December to our next seasonal date (around 8 January 2020) approximately 15 degrees.
Chart 5 shows the outside reversal day signal bar and the subsequent decline of close to 25% as the top did in fact come in and several short entries (aggressive and conservative ones presented themselves.)
Chart 5 – Daily Bar Chart Crude Oil
Could we have had the early part of January in mind? Your challenge is to see what clues may have been dropped in history. The use of big cycles such as 10, 20 and 30 year could be handy in this case, as well as some standard trading day counts.
This market has already delivered a cracking move for us to trade in 2020, this is one of those handful of good trades per year that the markets offer up.
Good Trading,
Aaron Lynch
