The Seasonality of a Trend
David purposely establishes our thinking from an early start, using the ABC trading methodology in the Smarter Starter Pack to build the foundation around the ‘Seasonal ABC Trade’, which in turn develops our understanding of the bigger picture or ‘Seasonality of the Trend’. It is through the use of seasonal trading that we progress our knowledge about how price forecasting is formulated.
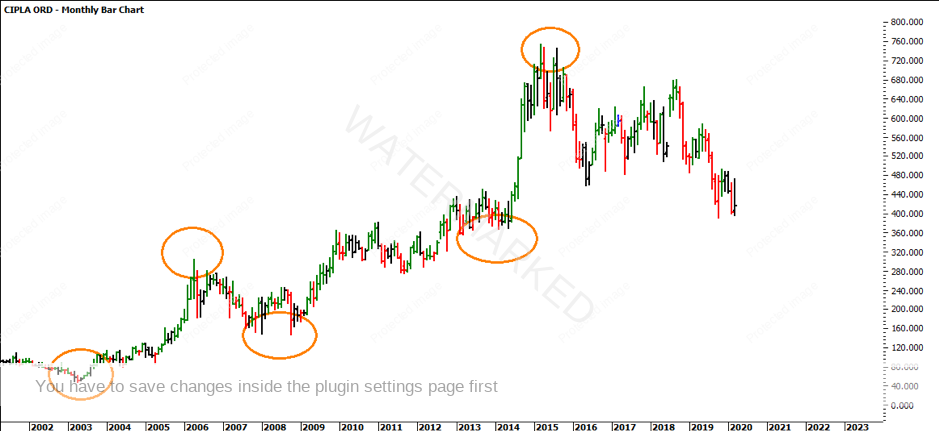
Turning our attention to a new market sector for all of our Indian Traders, we will spend some time exploring the seasonality of the bigger picture on CIPLA, which trades on the National Stock Exchange of India (NSE: CIPLA). By focusing on the ‘obvious’ turning points we are able to measure the price and project it forward, looking for harmony and taking note of the repeating patterns.
For those who have the Number of Trading Plan (NOTP), Section 5 is essential to review in order to establish a very strong foundation for seasonal trading. What we like to look for is a ‘wheels within wheels’ approach. Think about the small cogs in a clock and how the smaller cogs are moving the bigger cogs.
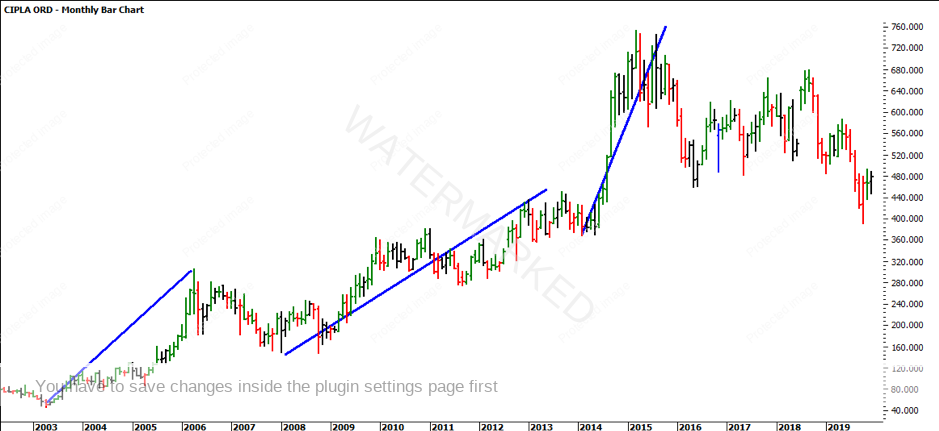
When breaking down the seasonality of the trend, the best place to start is the major trend (the weekly or monthly chart). We can start by measuring the bigger sections to gain a bigger picture perspective. We are watching for the spring, summer, autumn and winter of the trend.
As you can see, the chart below has been broken down with the ‘wheels within wheels’ approach into colours. The larger section is blue. There are also sections within the blue sections which can be highlighted but, in this article, we will focus on the blue. It will be your homework to break down the wheels within the bigger wheels.
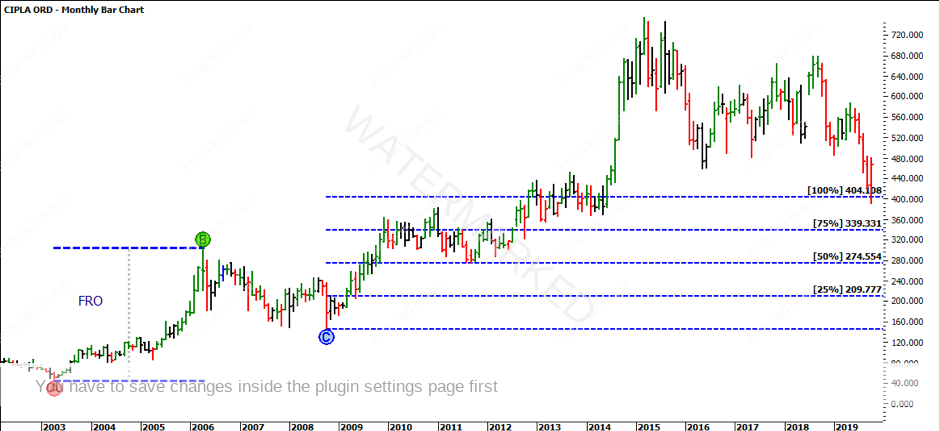
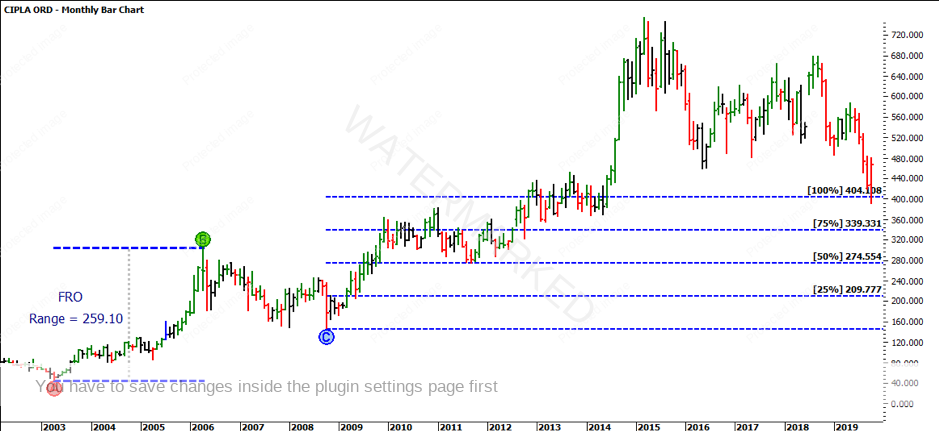
Gann suggests that there are often three sections and sometimes a fourth. If we use this as the basis of measuring the initial sections, we can apply the ABC Pressure Point Tool. The process of breaking these sections down starts with the ‘First Range Out’ (FRO).
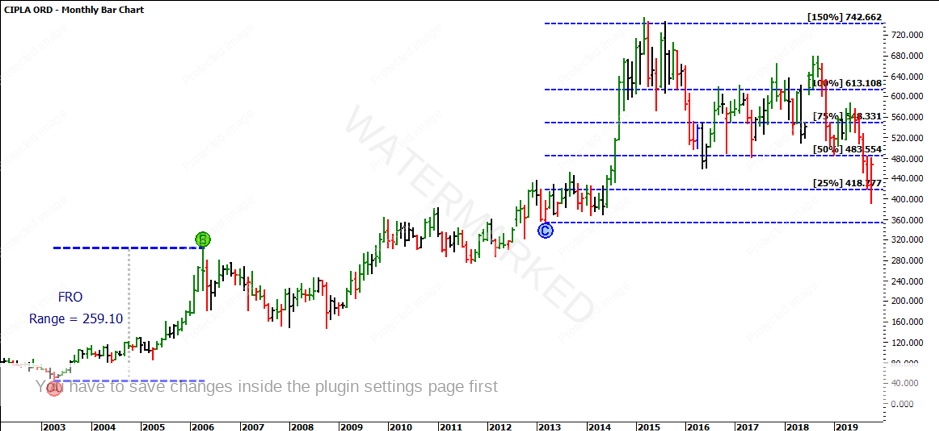
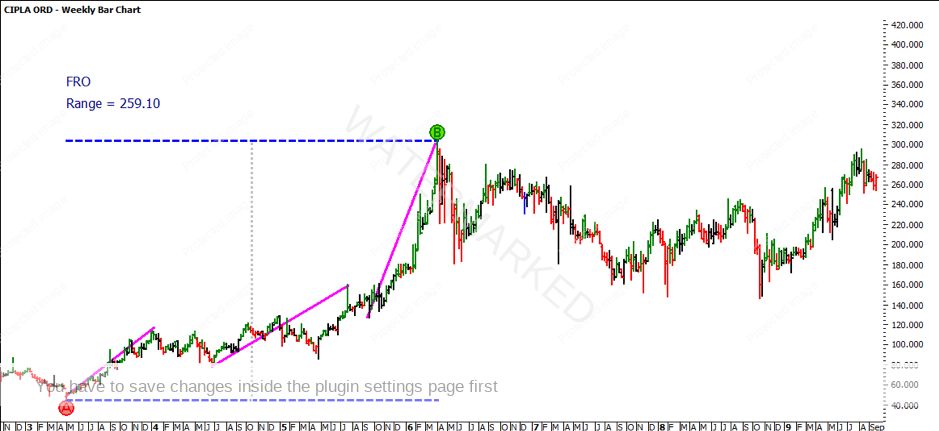
If we measure the first range from the bottom in April 2003 to the top in April 2006, the FRO gives you a price range of 259.10. If we project this range from the second double bottom low in October 2008, 100% comes in at $404.10, however the market topped at $450.40. Now the market hasn’t done a perfect price repeat but remember at this stage we are just trying to work out the bigger picture, so this could be subject to change.
By using the same FRO as the reference point and projecting it from the February 2014 low, which was the start of the third section, the 150% milestone calls for the top at 742.66. While the market topped at 752.85, it still overshot, making this yet another non accurate forecast. The real question here is how close we need the forecast to make money from the move. As you can see the market fell away from here and there was money to be made.
Now, we have three sections identified, which are relatively equal in price. We can now start to pull the market apart a little further.
At this point, you might be thinking this is not accurate or not close enough for your liking – and that is a very fair assumption, however we cannot make any conclusions until we have the whole picture. We are only assuming at this point that these are the three sections. In fact, in 12 months from now, maybe all of these sections make up one bigger section, or as time evolves the sections could be measured differently. Bring it back to simplicity. Based on the rules in the NOTP this is what data is telling us here, so don’t over complicate it.
If we start to break down the FRO, we can start looking for structure. The FRO is known as the spring of the trend. There is a lot of information gathered in the FRO which will likely provide ‘DNA’ for the rest of the trend.
Your exercise now is to explore the wheels within the FRO and project that forward. Then, do the same with the second section and start to break this down. I was able to break it down into three sections. There is argument that a few additional sections could be broken down, which is acceptable. I suggest you can break down the sections within these sections as an exercise.
I have painted a picture of some sectional analysis with price. The real art comes in taking this information and pulling it apart further. For those who are interested in a deeper analysis of Sections of the Market, David gives you a terrific lesson in the Ultimate Gann Course.
It’s Your Perception,
Robert Steer
