Australian Dollar Update
In October of 2019, the Australian Dollar made a Double Bottom around the 6690 level. This level was the 200% milestone of the monthly First Range Out from the 26 January 2018 high. This is shown in Chart 1 below. I cannot stress enough the importance of recreating each of the charts in this article in your software, and spending some time looking at it, thinking about it, and observing how the market reacted at the various key milestones like 50%, 100%, 150% and 200%.
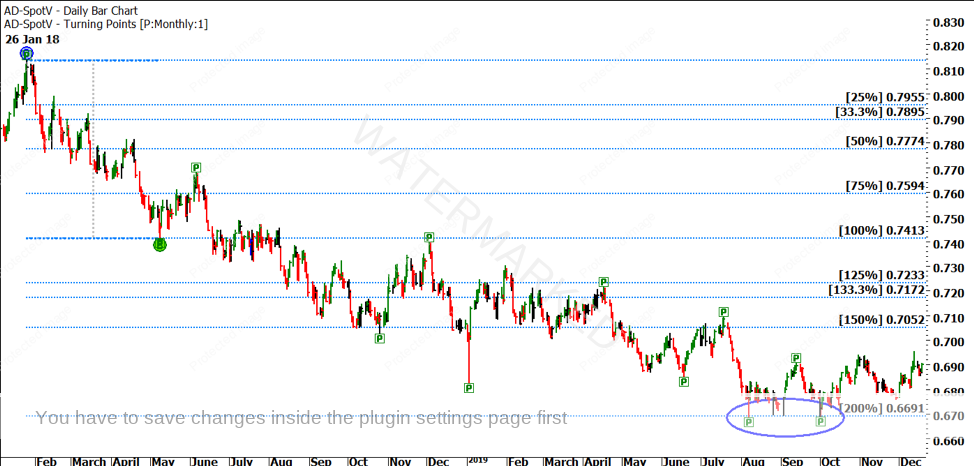
Chart 1 – 200% of the Monthly First Range Out
At the time, I thought that the Australian Dollar may have made a major low. However, I commented that based on David’s lesson on 256-point ranges in the Number One Trading Plan, IF the Australian Dollar broke the 6690 level, the next target would be the 400% milestone down at 52 cents. This is shown in Chart 2 below.
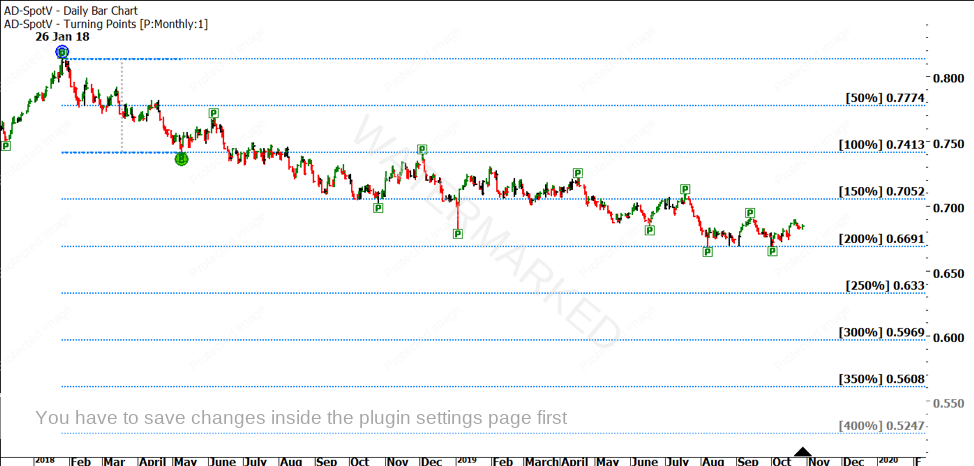
Chart 2 – 400% of the Monthly First Range Out
Now, at the time, I wasn’t calling the market down to 52 cents! I said “IF” the market broke 6690, the big picture target would be 52 cents. However, I also noted that “I can’t see the market getting to that level”.
Well, here we are at the end of March 2020 and the Australian Dollar has made a low at 5510, less than three cents away from the 400% milestone target. There’s a lesson to be learned here (in addition to the powerful lesson David has given us on the Power of the First Range Out), and that lesson is that markets can go a lot lower (or a lot higher) than we think they can. For example, I doubt anybody in the early 1930s expected the stocks they bought at the top in 1929 would lose 90% of their value!
When a market approaches a Price Forecast, I like to run a Ranges Resistance Card over the entire range I am studying. In this case, I used the Gann Retracement Tool in ProfitSource to break down the range from the All Time High of 11005 down to the target low of 5240. This is shown in Chart 3 below.
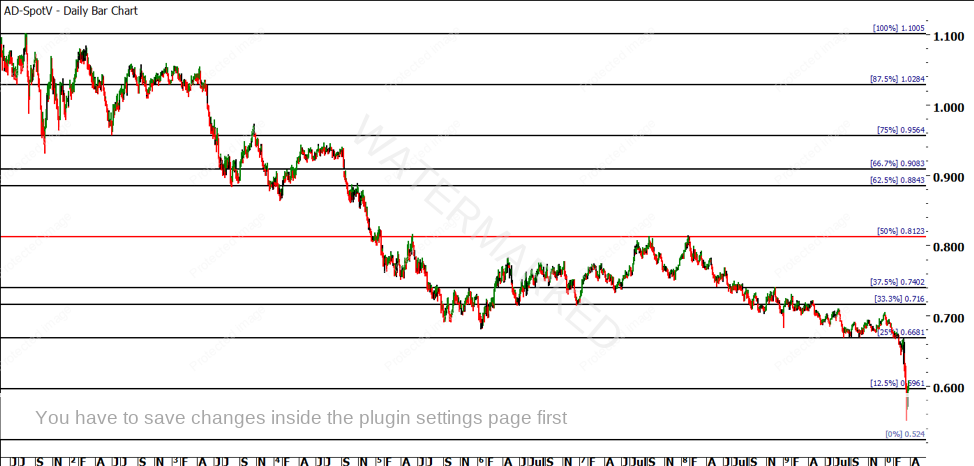
Chart 3 – Dividing the Range into Halves, Quarters, Thirds and Eighths
I want you to pay close attention to each of the lines on this chart. Did the market react around these levels on the way down? Remember, the top of the Gann Retracement Tool is sitting on the All Time High of 11005 and the bottom of the Gann Retracement Tool is sitting at 5240, a price level which has NOT been reached yet at time of writing. But look at the lines: big Double Bottoms on the 33% milestone in 2016. Big Double Tops on the 50% milestone in 2017 and 2018. Double Bottoms on the 25% milestone in 2019. And there are plenty of other major tops and bottoms falling on these lines. So what does that tell me?
It tells me that if nothing else, market movements are not random! There is a harmony or relationship between them. The question must also be asked – when the Australian Dollar began this bear market in July of 2011, did it know its final destination? Is that why it paused at the 50% milestone, like a driver going from Sydney to Melbourne having a pitstop for coffee and a snack?
Now, there is no guarantee that the Aussie Dollar will fall to 5240. And there is no guarantee that if the Aussie Dollar DOES reach 5240, that it will stop there. It may run up for the rest of the year from its low of 5510, or it may fall down to a price of 30 cents! However, if and when the market DOES approach the 5240 level, I believe it would be wise to be watching all of your swing charts, using the process outlined in our recent Interactive Market Outlook.
I believe this structure is important to watch until the market reaches 5240, whether that happens tomorrow or at Christmas time, or somewhere in between. I think the Price Forecast stands alone. As for WHEN it might occur, you might like to start with Time by Degrees, which is the lesson we focused on in March in our Ultimate Gann Course Coaching. Ask yourself the question – WHEN has the market been turning each month? I could tell you of course, but I’d rather you take two minutes to open the AD-Spotv chart in ProfitSource and take a look for yourself. You’ll know when you’ve found it – it’s been turning like clockwork.
This year, we’ve already seen David’s Price Forecasting lessons from the Number One Trading Plan call the top of the S&P500 and the DAX. This Price Forecast on the Australian Dollar has been put together using the same lessons. History repeats. For those who feel their Price Forecasting skills are lacking, you might like to revisit Section 11 of your Number One Trading Plan manual. Alternatively, if you’d like to immerse yourself in a comprehensive Price Forecasting program, now would be a great time to review the recording of my full day Price Forecasting Webinar from 2017. For those who did not attend, the recording is available in the Safety in the Market shop on our website, or by clicking here. If you’re stuck at home during the government shutdown for coronavirus, don’t sit in front of the tv – get stuck into some research and analysis. You’ll be glad that you did!
I’ll end this article by repeating my comment from earlier: “markets can go a lot lower (or a lot higher) than we think they can”. In the Interactive Market Outlook, I made a similar comment regarding the Crude Oil market, by noting a major milestone that looked ‘too far away to be believable”. All I can say is, we’re now a lot closer to that ‘outrageous forecast’ than we were in January 😊
Be Prepared!
Mathew Barnes