A Big Numbers Game
I used to think the yearly swing chart was pretty much a waste of effort. Slow to move and rarely needed to be updated. Often the things that move the slowest can catch us off guard as you tend to forget about them. These days I get a huge amount of value from the yearly swing chart.
In 45 Years in Wall Street, W.D. Gann suggests writing up tables of percentages of highs and lows of all the major turns. We know this as Highs Resistance Cards and Lows Resistance Cards. The problem with doing this on software is you need a lot of chart pages for each high and low and often the software only gives you lines on a chart not the important numbers!
In Chart 1 below you can see the percentages running up and down On the SPI200 from the 20 June 2022 yearly low of 6296.
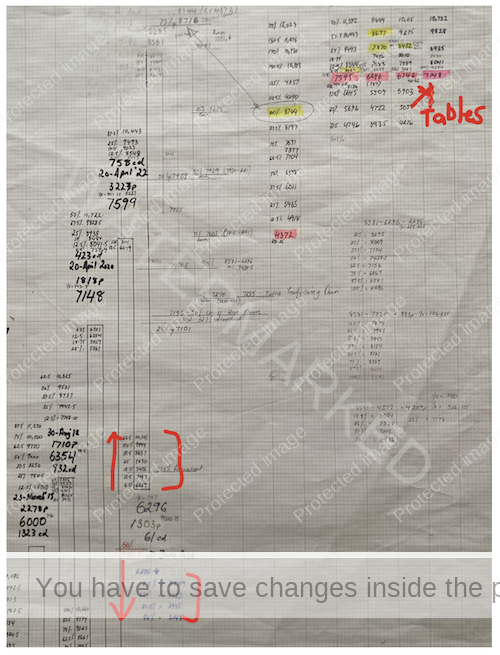
Chart 1 – 6296 Low
You can see I had the tables written up at the top right-hand corner but with this subtle difference of running them from each high and low, I’ve found it a lot easier to run my eyes over the chart to look for support and resistance levels.
I also run the Ranges Resistance Cards in pencil over on the right-hand side which helps to identify when a ranges resistance level meets a percentage of a high or low.
Seeing these numbers come together takes some time just staring at the chart but it’s amazing what you can notice that you will just never see using a software chart.
It’s a process of letting the ‘big numbers’ sink it. 50% and 100% are going to be the strongest points to watch but don’t underestimate the power of other percentages.
One number that stands out to me is around 7440. The SPI200 doesn’t ever ‘HAVE’ to get there, but IF it trades at that level, it’s has potential for being a major area for support or resistance.
From a yearly swing chart, I see:
- 100% on the 9 August 2011 low of 3722 (3722 x 2) = 7444)
- 50% yearly ranges resistance of 8581 high and 6296 low = 7438.5.
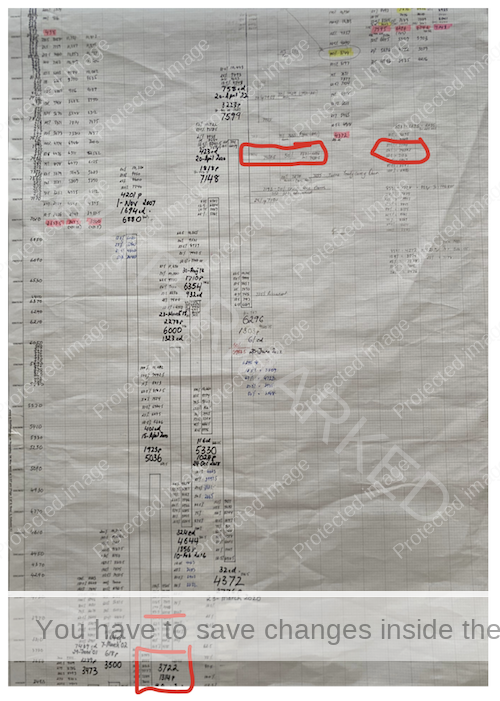
Chart 2 – Big Support and Resistance Levels
I understand that reading the numbers here may be hard when reading this article, but it’s easy when I’m sitting right in front of it!
Now I can drop down a time frame to my quarterly chart and do the same thing all over again. You might find there’s a lot going on with these swing charts but if you draw them up yourself, they all make sense!
Looking for a big number you can see a quarterly swing low at 7472. That makes me wonder, could we see a false break double bottom on the quarterly swing?
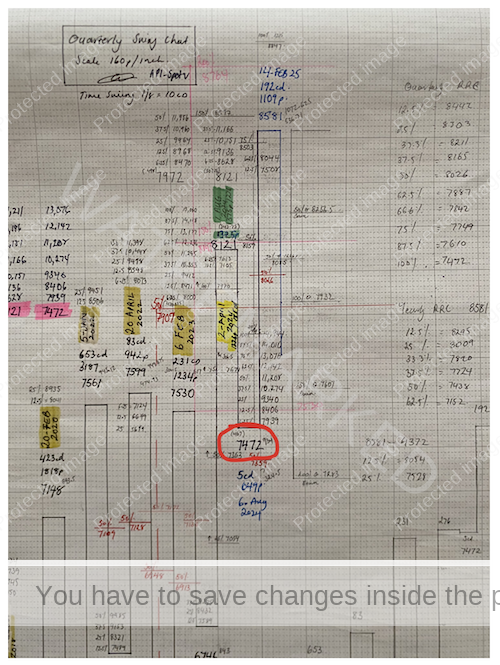
Chart 3 – Quarterly Swing Chart
Then if I drop down to a monthly swing, I see 200% of the double tops gives a price target of 7479.
Chart 4 – Monthly Swing
To recap the numbers:
- 100% on the 9 August 2011 low of 3722 (3722 x 2) = 7444)
- 50% yearly ranges resistance of 8581 high and 6296 low = 7438.5.
- Old Quarterly Swing low = 7472
- 200% of Monthly Double Tops = 7479
I have a major price cluster worked out and if the SPI200 continues on a down trend, I can then watch for the weekly swing chart milestone to add the cluster. If that comes together, I’ll watch for a daily swing chart milestone and start to tighten up on a final price target. Then the 4-hour, 1 hour and 15-minute swing charts to really tighten up on a final price.
There’s still a lot of trading in between now and the price cluster so I’m not saying wait for 7440! I’ll be looking for much closer trading opportunities, but it doesn’t cost me anything to know where the big numbers are and at least I’m prepared if an opportunity arise
Happy Trading,
Gus Hingeley