A Currency and WOW!
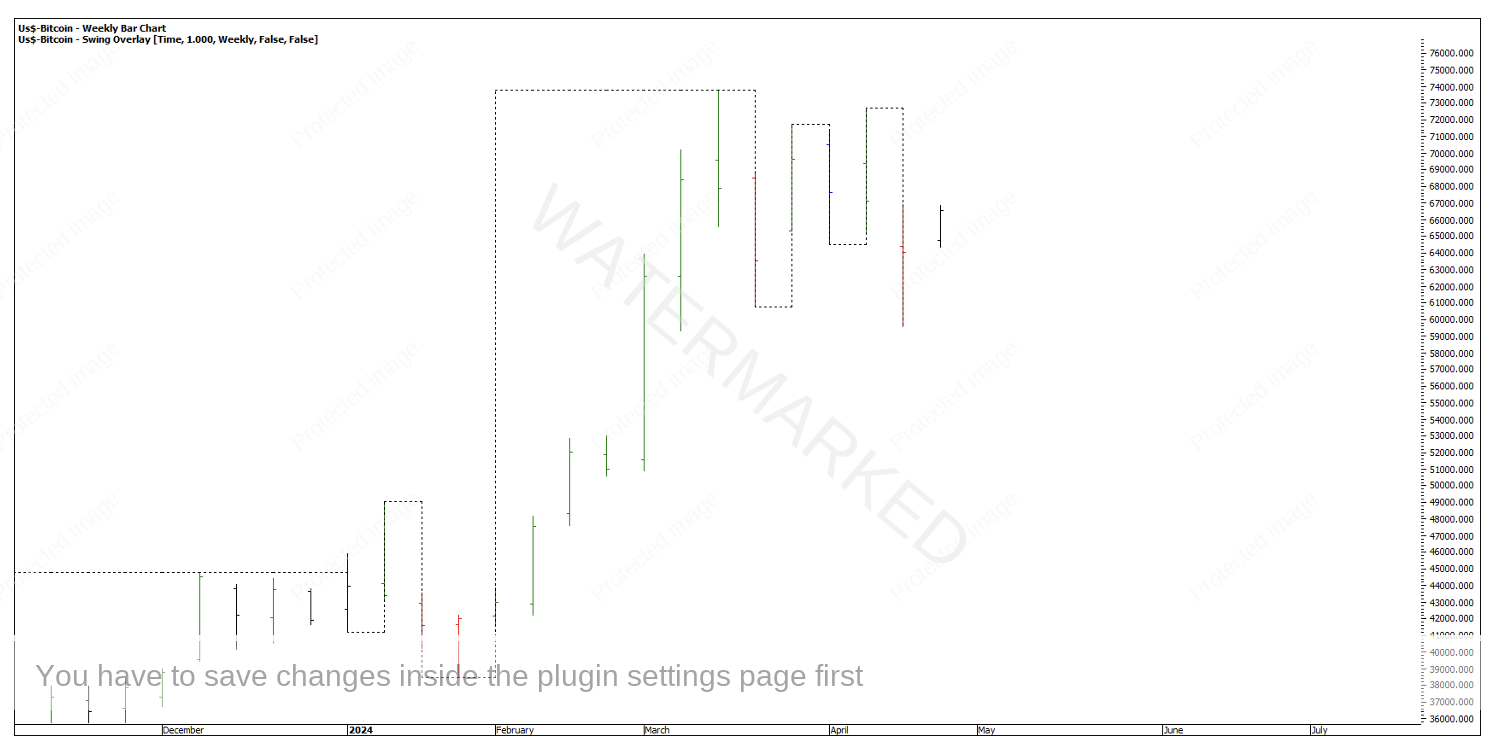
Chart 1 – BTC Weekly Bar Chart
Now I’m going to go out on a bit of limb and suggest this maybe one of those times where a contracting weekly swing up and expanding weekly swing down might be giving us a false signal to the short side and BTC has actually resumed its run to the upside. Disclaimer though, I could be wrong, but this is why I think this might be the case.
Firstly, Bitcoin has repeated its weekly First Range Out near perfectly 100%. I often find that when a milestone is hit so precisely and can barely push through, it’s a good chance of holding. Added to that, BTC is still well above the closest 50% retracement which shows up on a weekly swing.
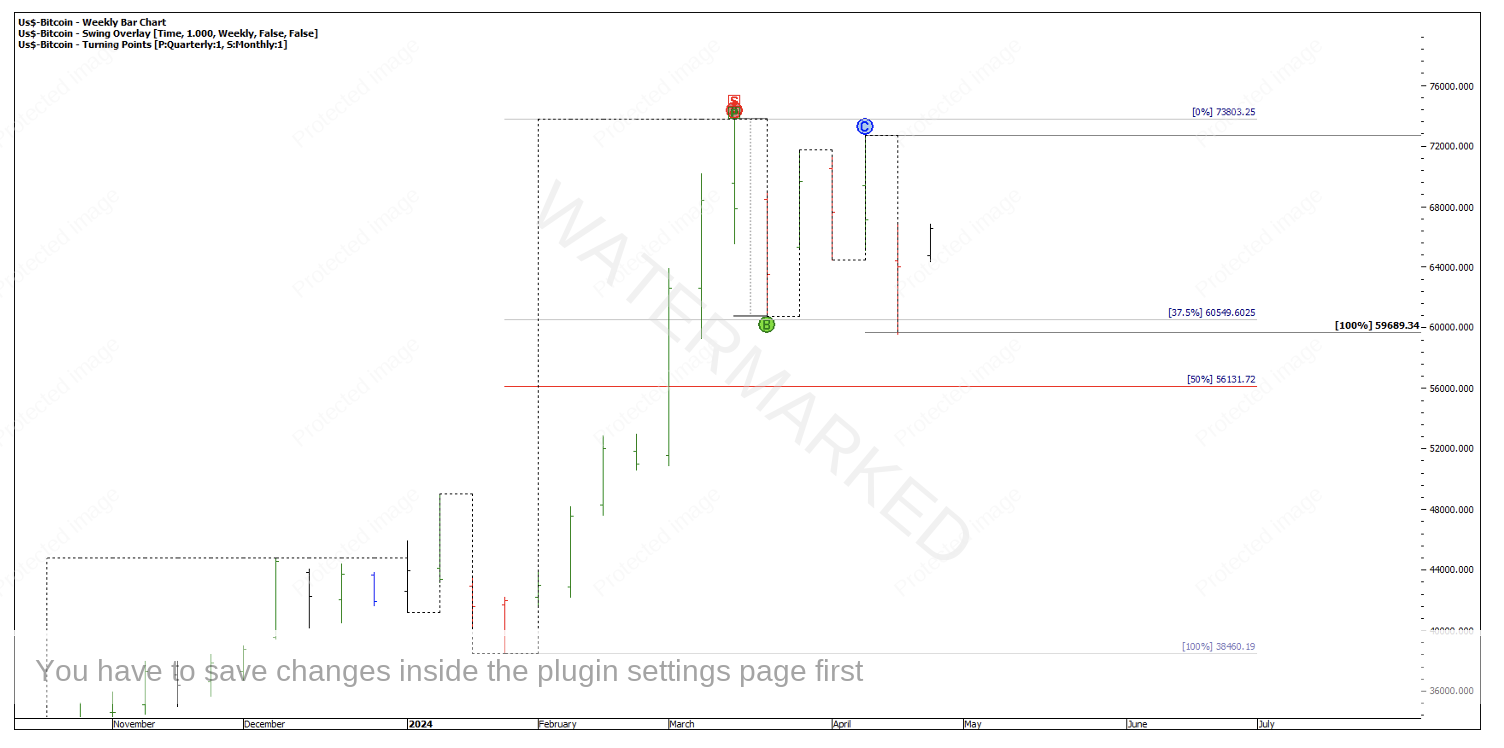
Chart 2 – BTC Repeating First Range Out
Then we’ve seen four daily swings down finishing in double bottoms at roughly 200% of the daily First Range Out. Daily sections three and four have double bottomed at the 50% milestone of Daily Section 2.
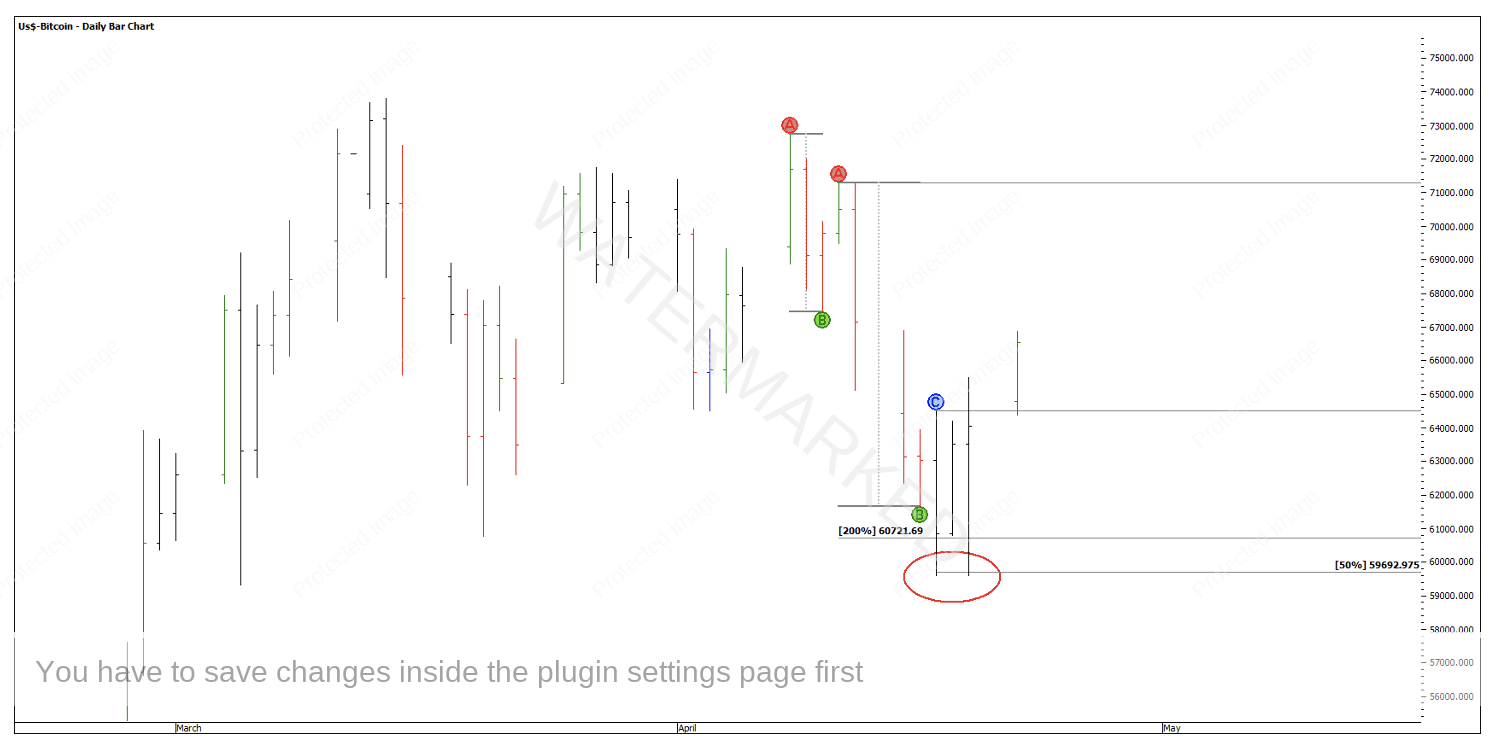
Chart 3 – Daily Sections of the Market
At the least this signifies that this weekly swing down is most likely over. The debate for me is whether or not BTC is going to put in a failed weekly swing up and continue its run down, or continue up and break back above old all-time highs.
There’s a range of possibilities as to what BTC could do. We also can’t rule out this market being in a period of distribution and going sideways for a while. However, we don’t have to guess. You could get in early and take a riskier trade or just wait and let the market prove it’s direction. For me that would be if BTC breaks into new all-time highs and you could look to get long out of a price cluster with a tight stop.
Another opportunity I want to take a look at is on Woolworths (WOW in ProfitSource). Woolies has just put in a repeating monthly swing range into a false break double bottom. The current low on 19 April at $31.25 sits on the old GFC high of $31.32, which was once a very strong resistance level. It’s also a 10 year anniversary from (back then) the 28 April 2014 All-Time High.
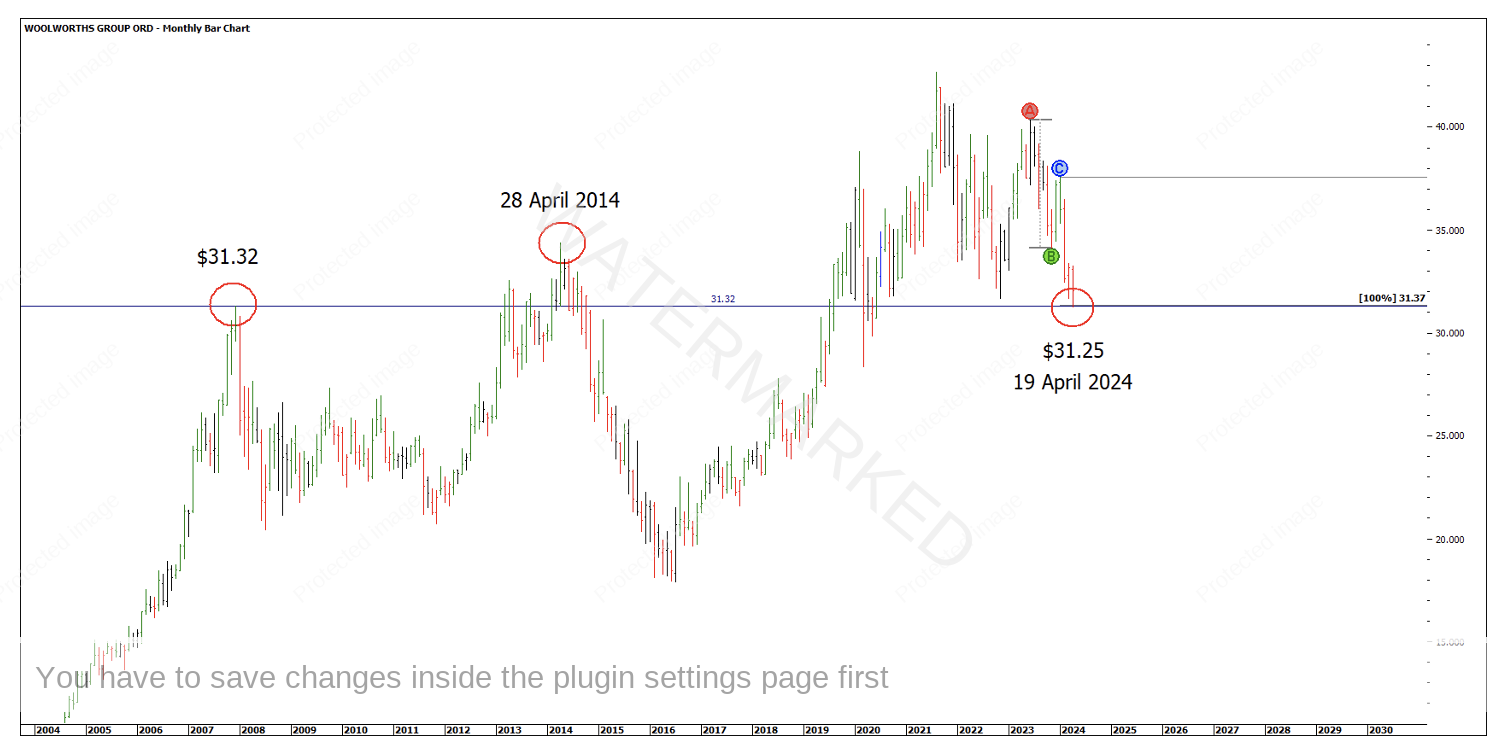
Chart 4 – Woolworths Major Support
For an even bigger picture outlook utilising the yearly bar chart, this current yearly swing down is contracting and still holding above a 50% retracement. These are two signs of strength IF, the market is to pull up here.
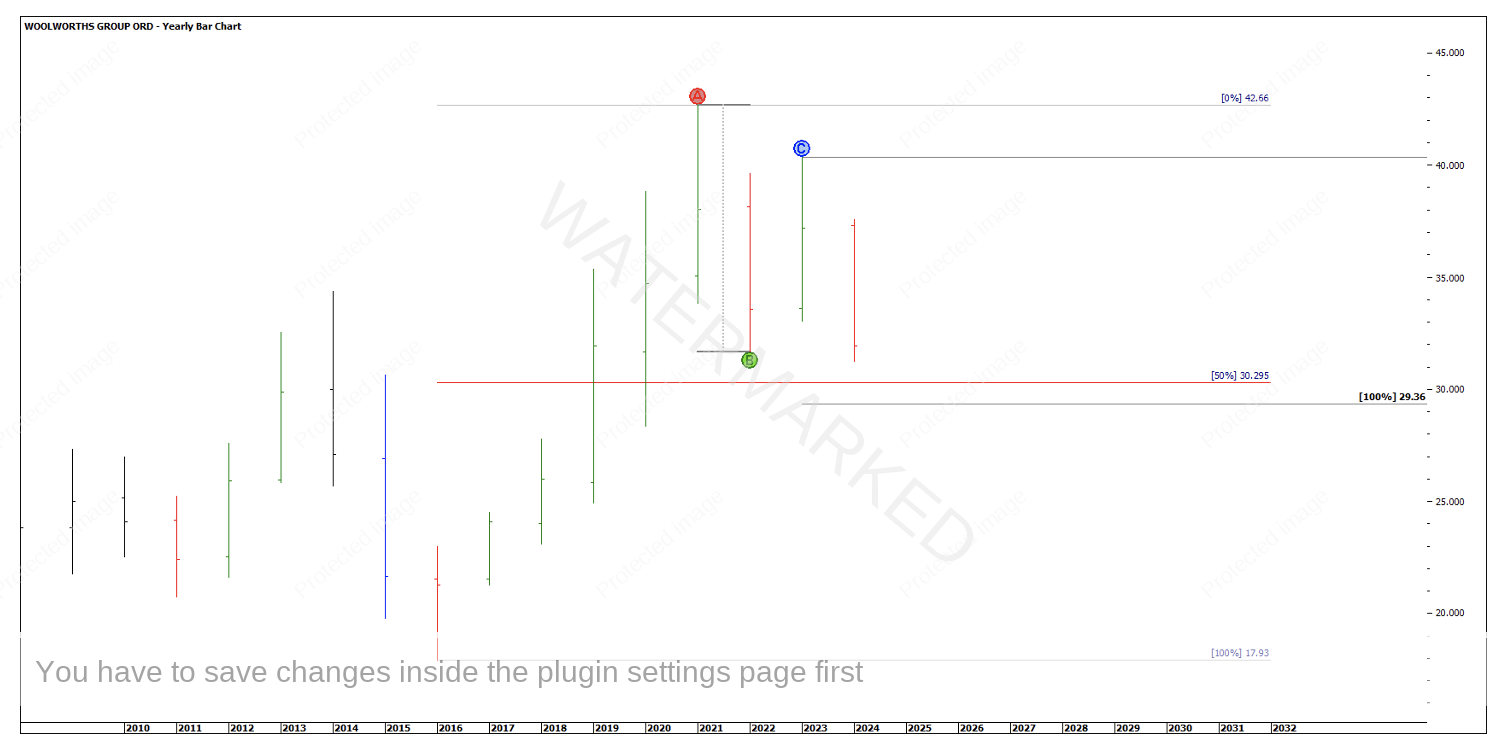
Chart 5 – Woolworths Signs of Strength
Breaking down the current quarterly/yearly swing down, not only is there a nice repeating monthly section down, the current low sits on 400% of the weekly First Range Out.
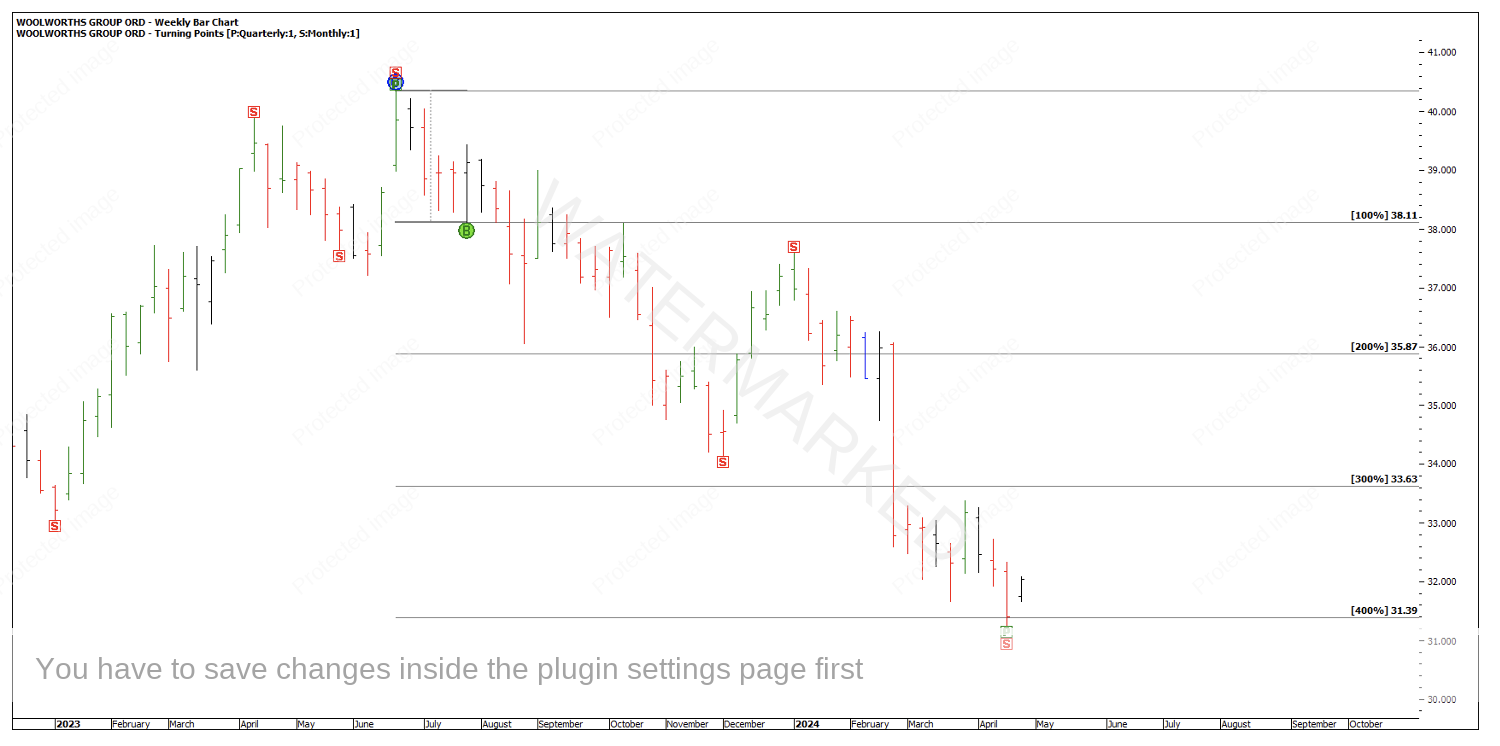
Chart 6 – Woolworths 400% First Range Out
I’m a big fan of lows and highs resistance cards, and if you use the 6 July 2016 low of $17.93 as a Lows Resistance Card, you can see some of the recent tops and bottoms that percentages of this low have called.
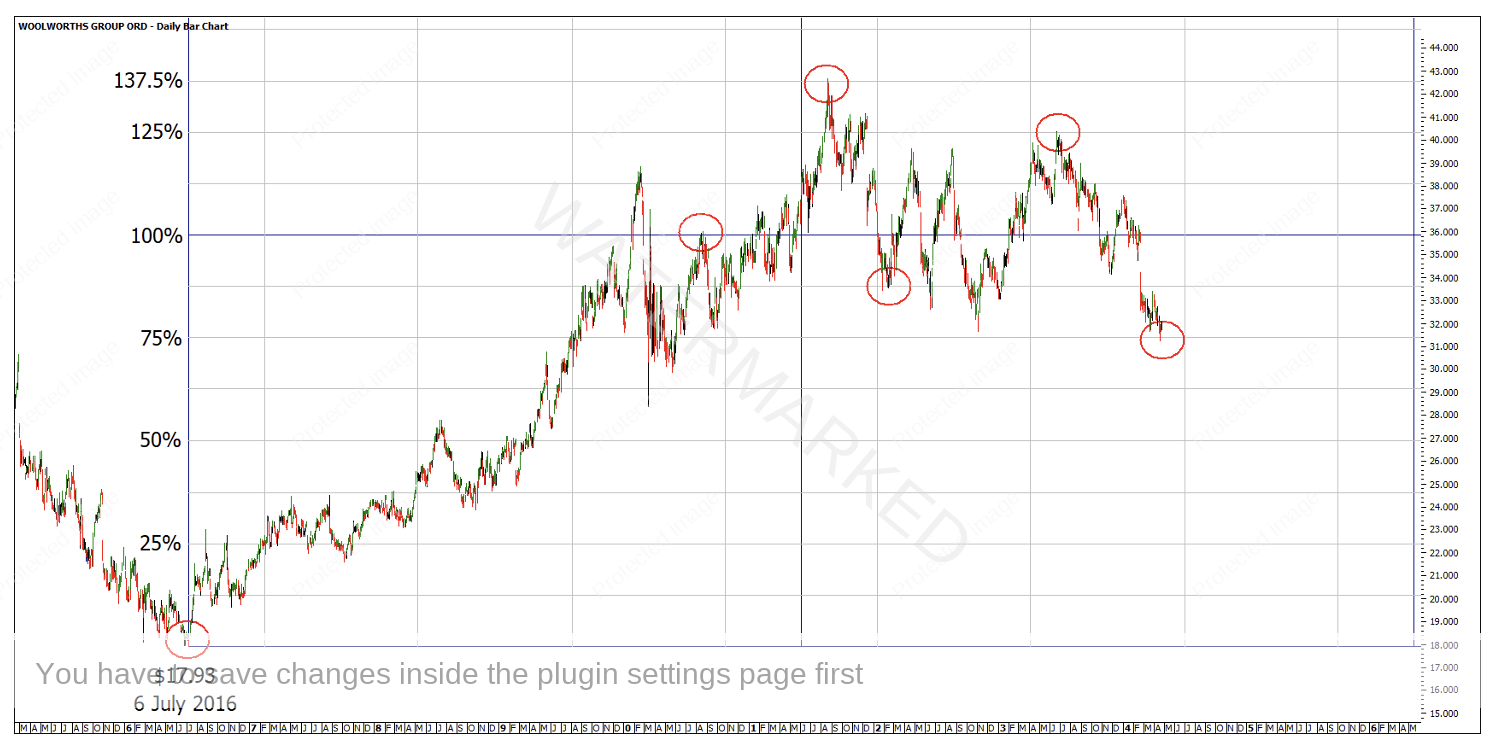
Chart 7 – Woolworths Percentages of a Major Low
Breaking down the last monthly swing, I see the weekly sections of the market marked up with red arrows as below. Within the last weekly swing down, the daily First Range Out has repeated nearly exactly 100% and then put in a contracting daily swing down into the low and at present is an expanding daily swing up.
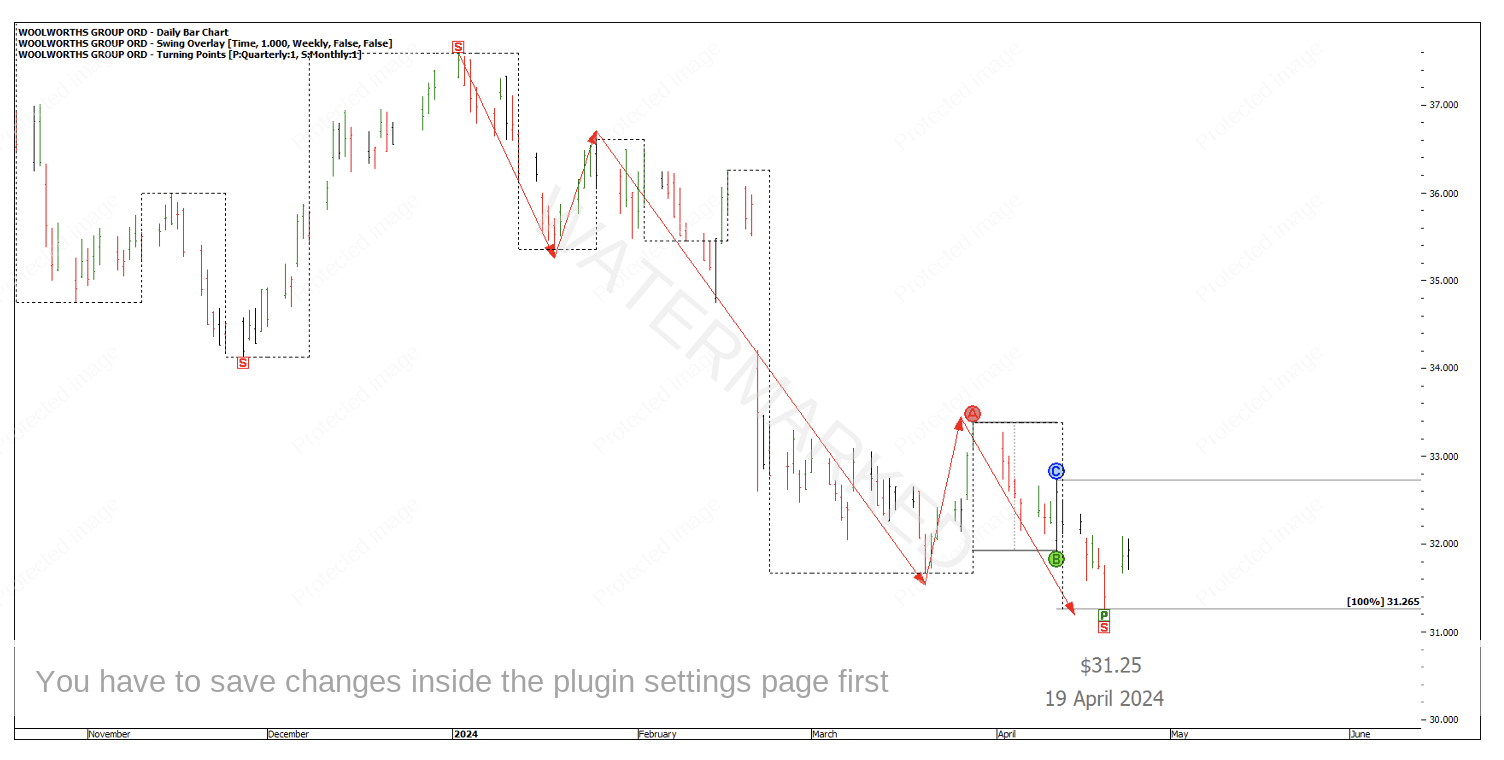
We could now watch the daily overbalance in price to the upside and look for a cluster at a daily Point C if we were looking to trade this move.
If you receive the Platinum Newsletter, then you’ll know that I’m also watching a cluster around 1.25 on Natural Gas. That’s three markets, a stock, currency and a commodity to keep an eye on for some big picture moves. Only one of these needs to come together to have a good year of trading.
Happy Trading,
Gus Hingeley