A Golden Opportunity
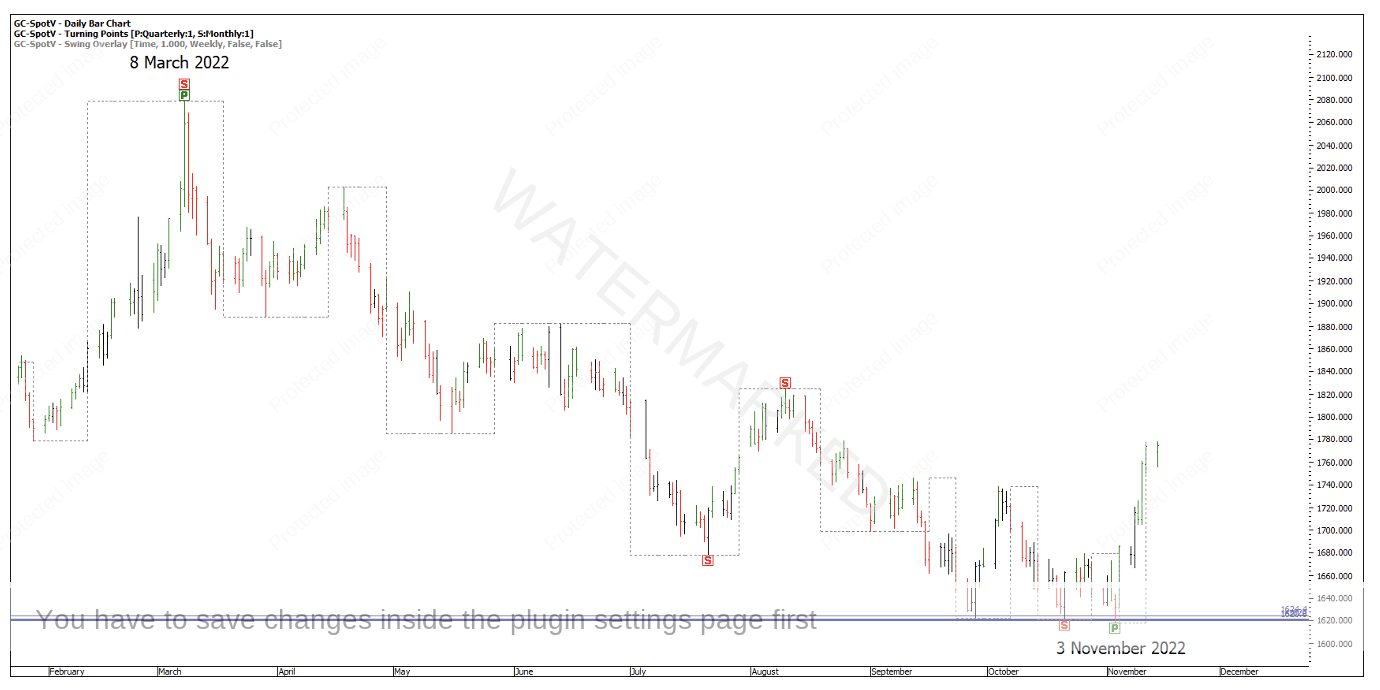
This month’s case study will focus on a recent trade setup on Gold. How many price milestones can you find that calls the triple bottoms to within a variance of 0.25%? By isolating this current quarterly swing down, the milestones are represented in Chart 1 below. As you can see, there isn’t much of a gap between them!
Chart 1 – Gold Cluster
The major milestones I see are listed below. I highly recommend recreating these for yourself to get the most benefit.
- 1622
- 1624.4
- 1620.9
- 1620.6
Some trades have a certain level of doubt especially when the market falls just short of some of the price milestones that make up a cluster. As David once said, hindsight has 20/20 vision!
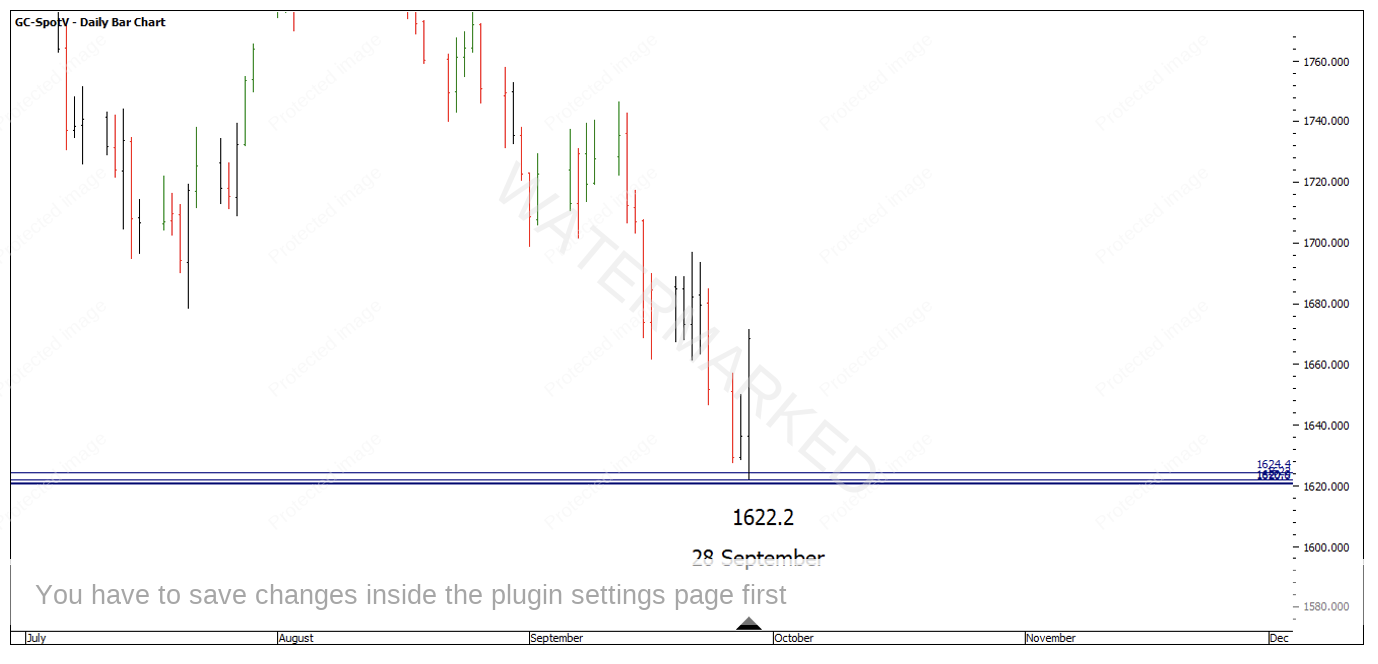
With that being said, this case study had the initial low on 28 September which fell short by three of the four major milestones causing doubt about the setup.
Chart 2 – 28 September Low
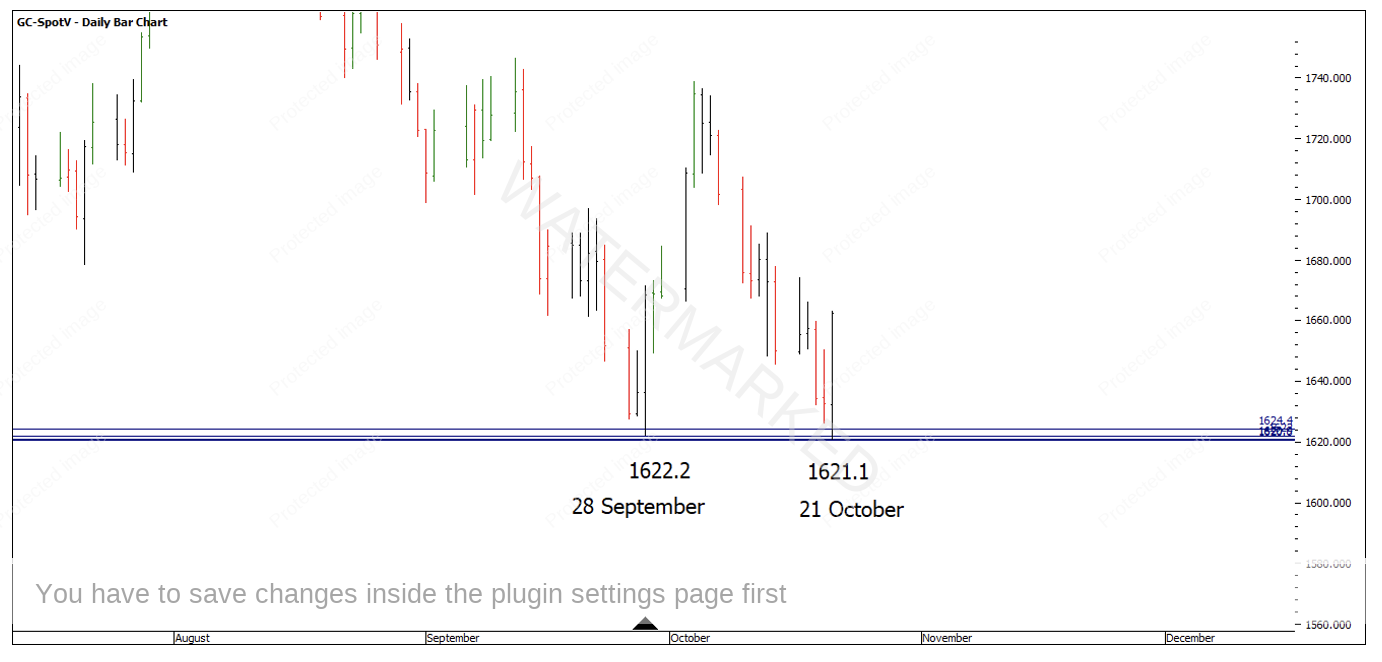
Nearly one month later, Gold came back and double bottomed just breaking the previous 28 September low by $1.10. Still only two parts of the cluster were hit. Do you take the trade?
Chart 3 – Double Bottoms
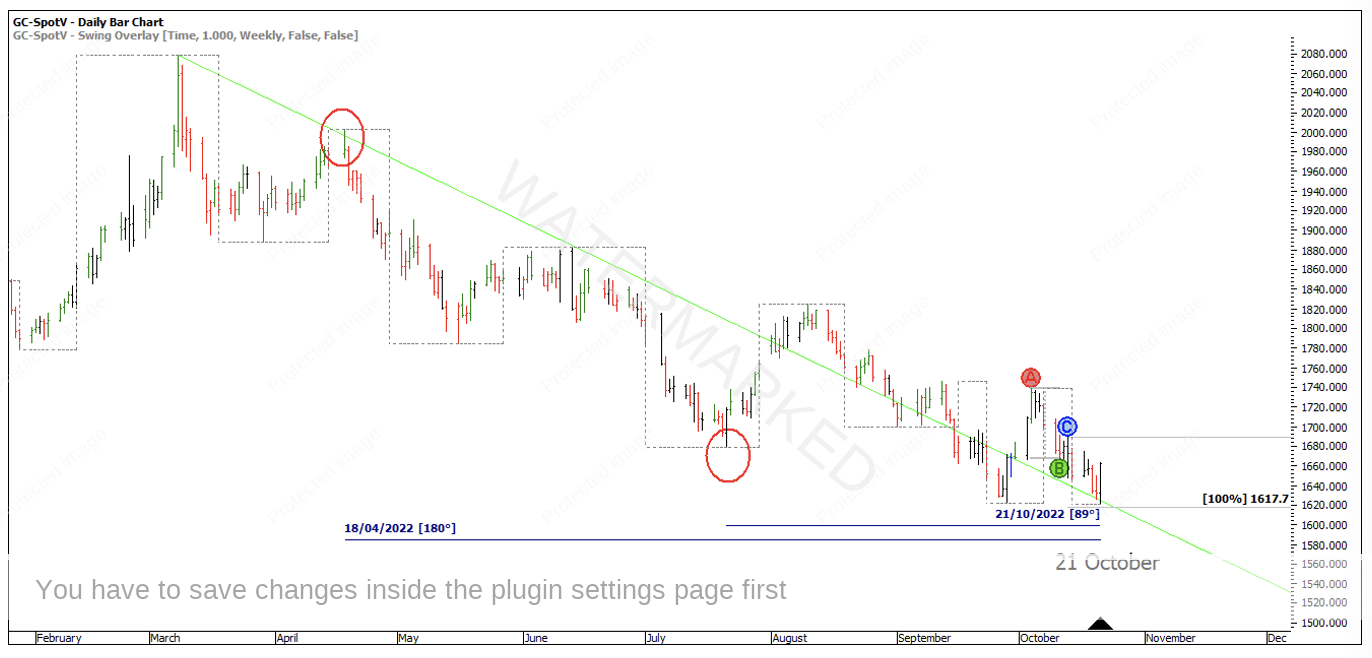
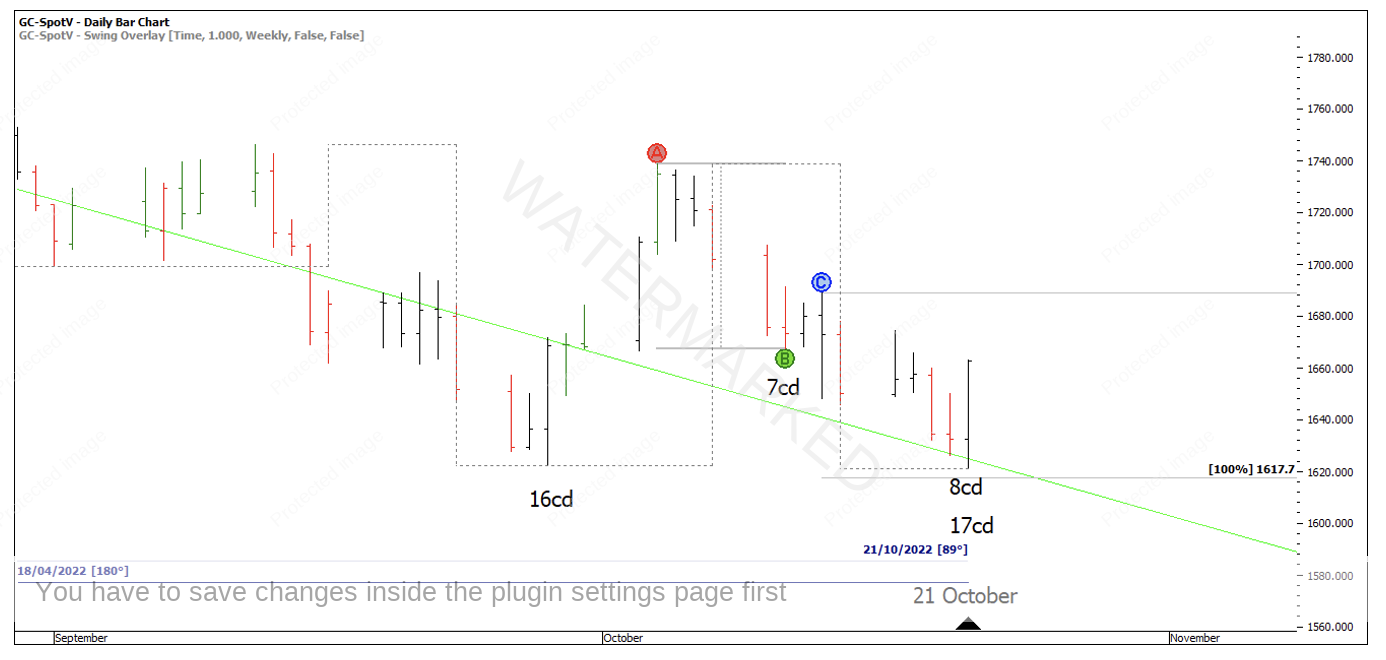
There are definitely elements present at this low of a Classic Gann Setup. Strong 90 and 180 Time by Degrees, finding support on the 2×1 Gann angle from the quarterly swing top and a contacting daily swing range into the false break double bottom.
Chart 4 – Classic Gann Setup
There was also Balancing Time with Time Trend Analysis. The previous weekly swing down was 16 calendar days verse 17 calendar days and the last daily swings down were 7 calendar days verse 8 calendar days.
Chart 5 – Time Trend Analysis
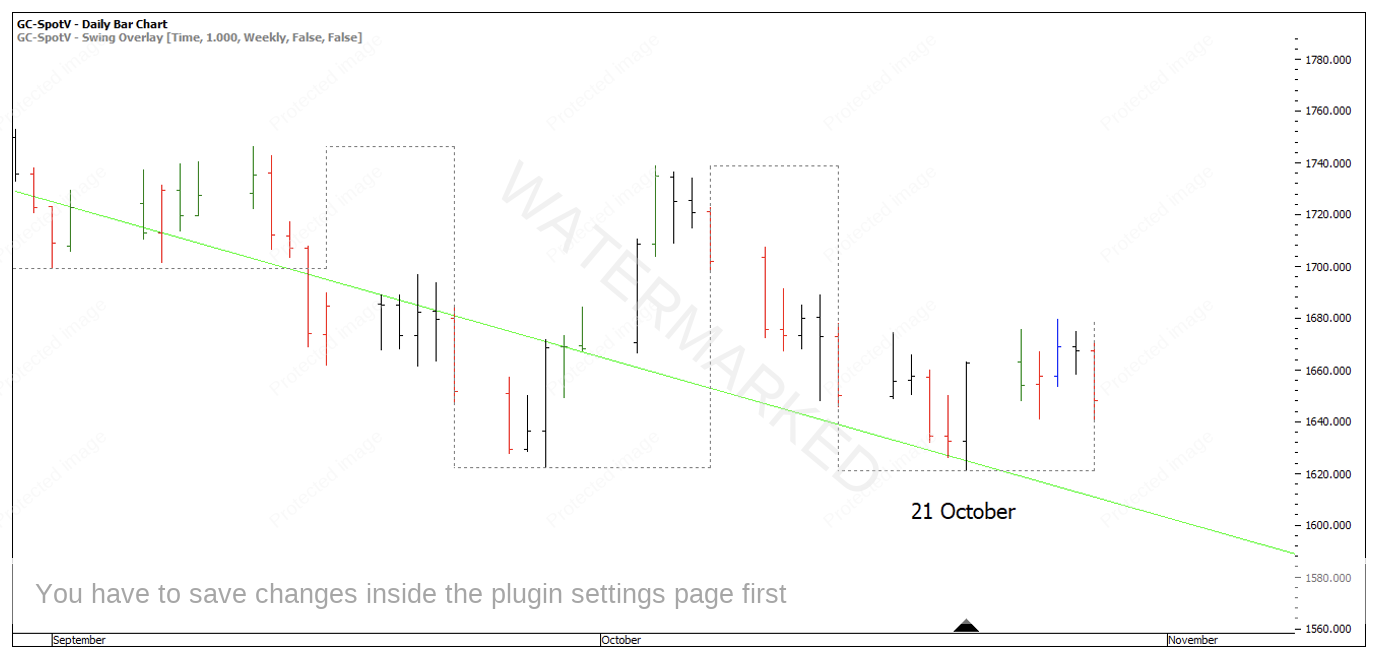
As the market moved away, it was clearly struggling to go up. A week of trading and it wasn’t the explosive move I would expect!
Chart 6 – A Weak Market
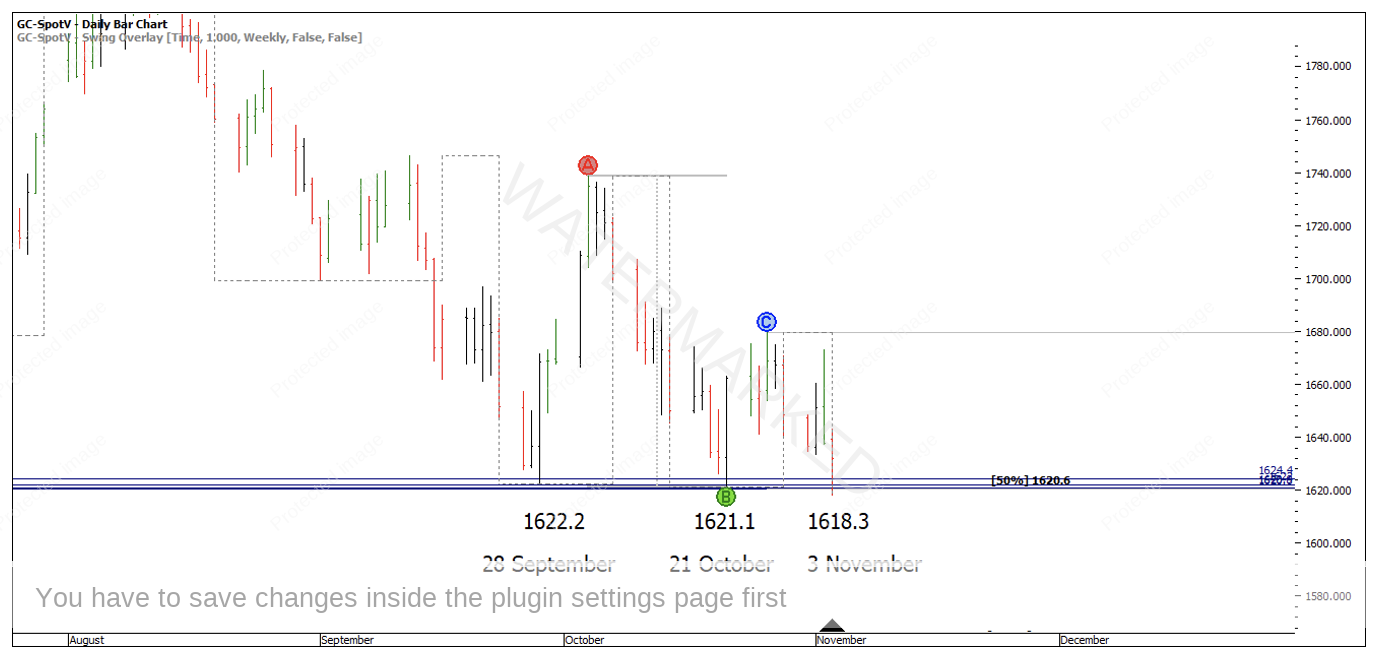
Fast forward to 3 November, Gold makes triple bottoms, this time hitting all four parts of the cluster. This time, the previous weekly swing 50% milestone adds another piece to the cluster at $1620.60, now making this a five-part swing chart cluster.
Chart 7 – Triple Bottoms
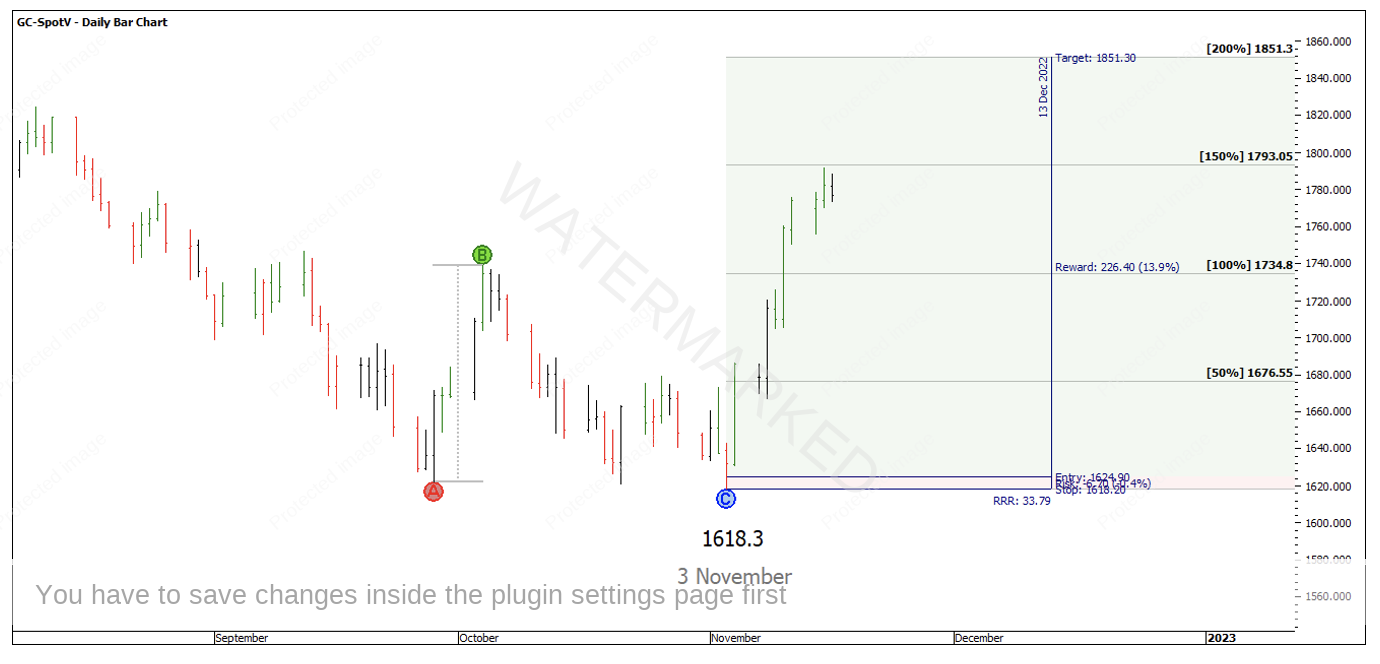
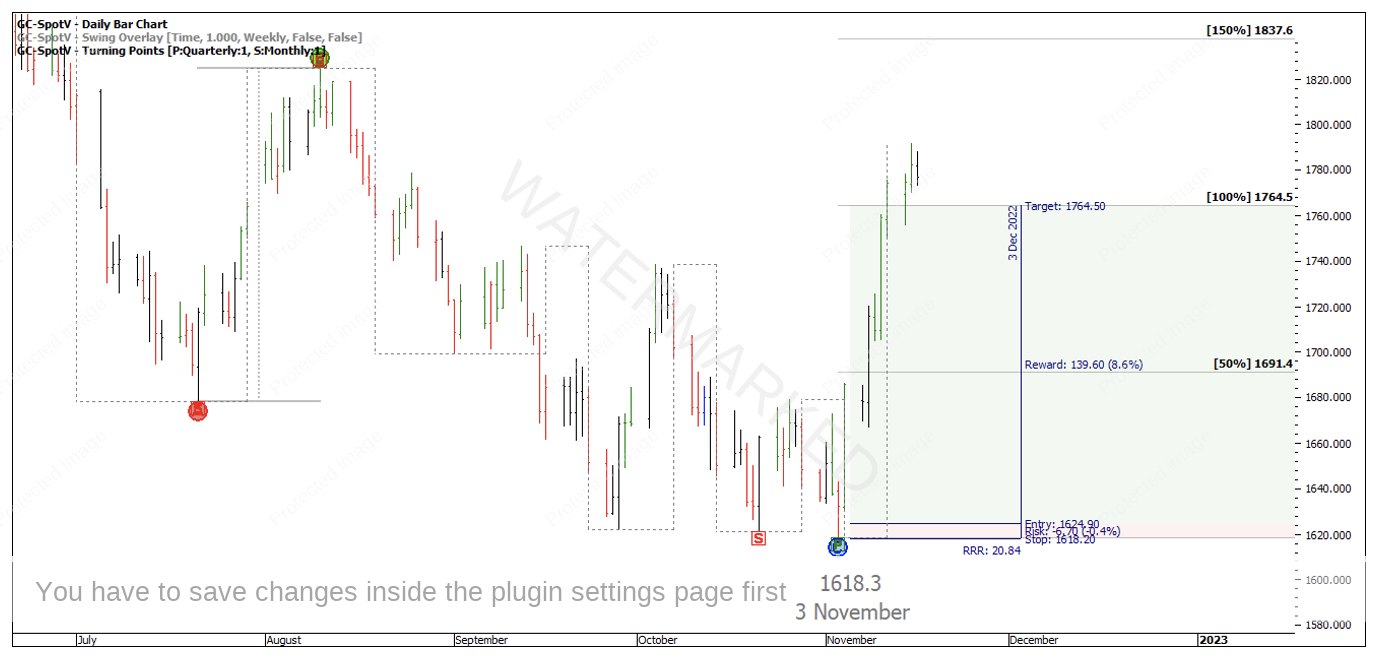
Let’s explore how you could have entered a trade on the 3 November low. Looking at the Gold December contract on barchart.com on a 1 hour time frame, we can use this as our entry as the 1 hour swing chart turns up. With the high of the 1 hour bar at 1624.8 and low at 1618.3 our entry and stop parameters would be:
Entry: 1624.9
Initial Stop Loss: 1618.2
Risk: $6.70 per contract or CFD.
The nice thing about a 1 hour entry is the market has to travel back up through the highest part of the cluster at (1624.4) to be triggered into this trade.
We have a couple of options as an exit target. Considering the the last weekly swing range was so small we can look at the triple bottom milestones for profit taking. The 200% milestone would give this one trade the potential for 33 to 1 Reward to Risk Ratio.
Chart 8 – Triple Bottom Milestones
Another potential target for profit could be the 100% of the previous monthly swing range at 1764.5. If you took profits at the 100%, the Reward to Risk Ratio would have been just over 20:1 and you would now be on the sidelines.
Chart 9 – 100% Previous Monthly Swing Target
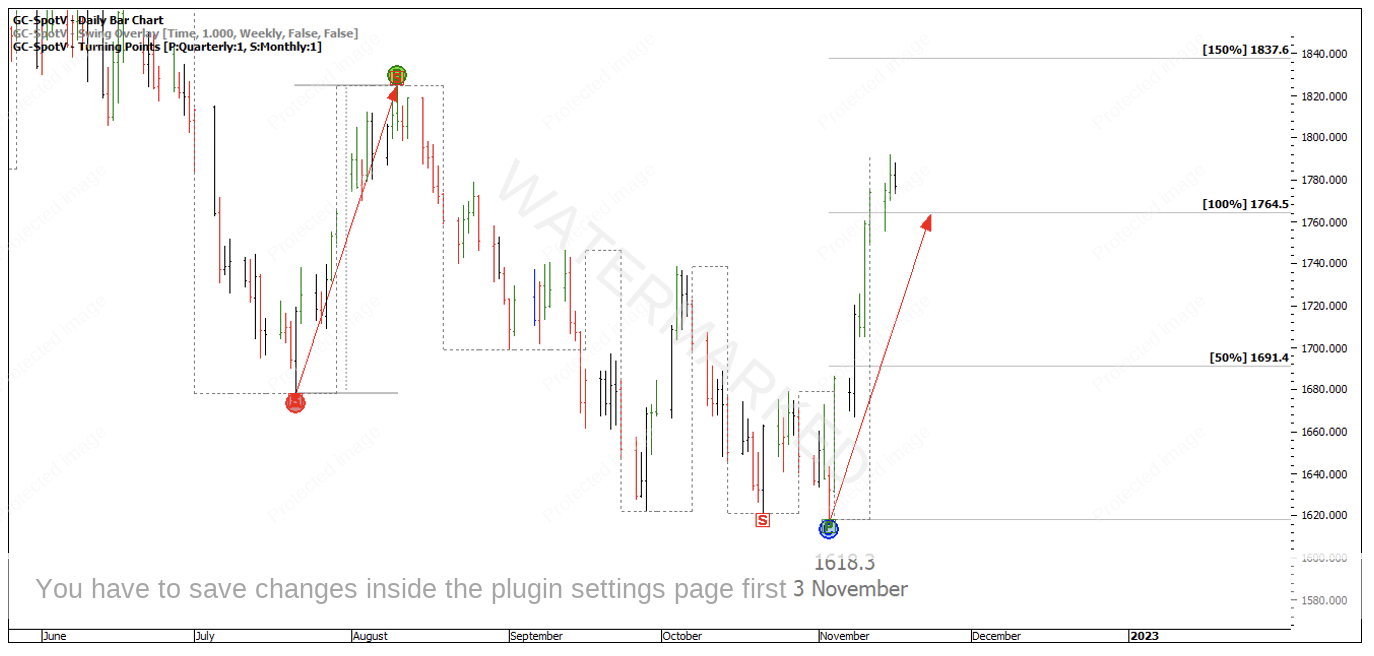
However, Gold still looks to be in a weekly First Range Out from the 3 November low. Could there be more to this move? Looking at the speed angle off the last monthly swing up the current market is running at a greater pitch and now an expanding range.
Chart 10 – Pitch
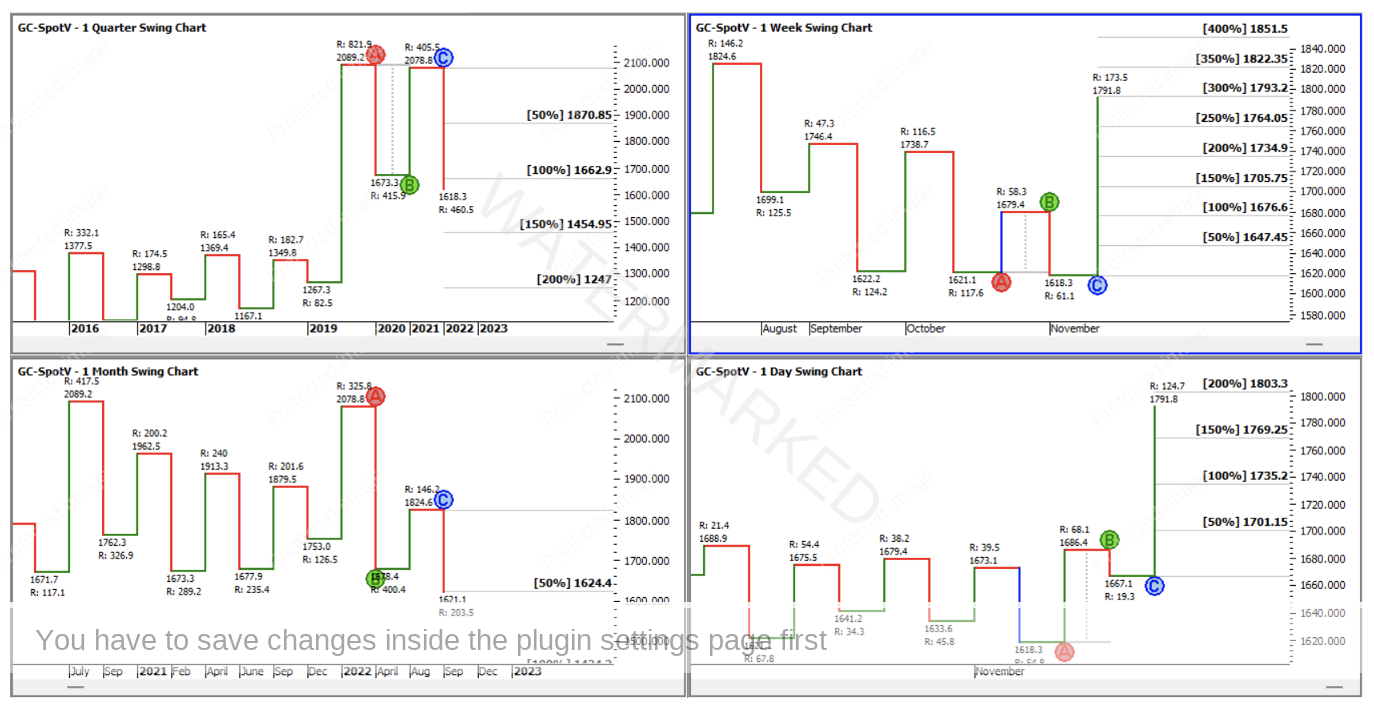
Taking a look at a split screen of the swing charts, the current weekly swing has well and truly overbalanced to the upside. If this market was to follow Gann’s rules, could we reasonably expect a pull back at some stage accompanied by another weekly section up?
Chart 11 – 4 Way Split Screen
At the least this will be another great case study (like Cotton) to watch for the rest of the year and into 2023 for more trading opportunities.
Happy Trading!
Gus Hingeley
