A Little Sugar
This month’s article takes a look at the Sugar futures market in recent times, paying close attention to a trade setup which involved an entry on the intraday chart. This time the three main price cluster inputs are specified directly in the article and are shown on the one chart – the continuous chart which draws its data from the Sugar contract trading with the highest volume at the time, chart symbol SB-SpotV in ProfitSource.
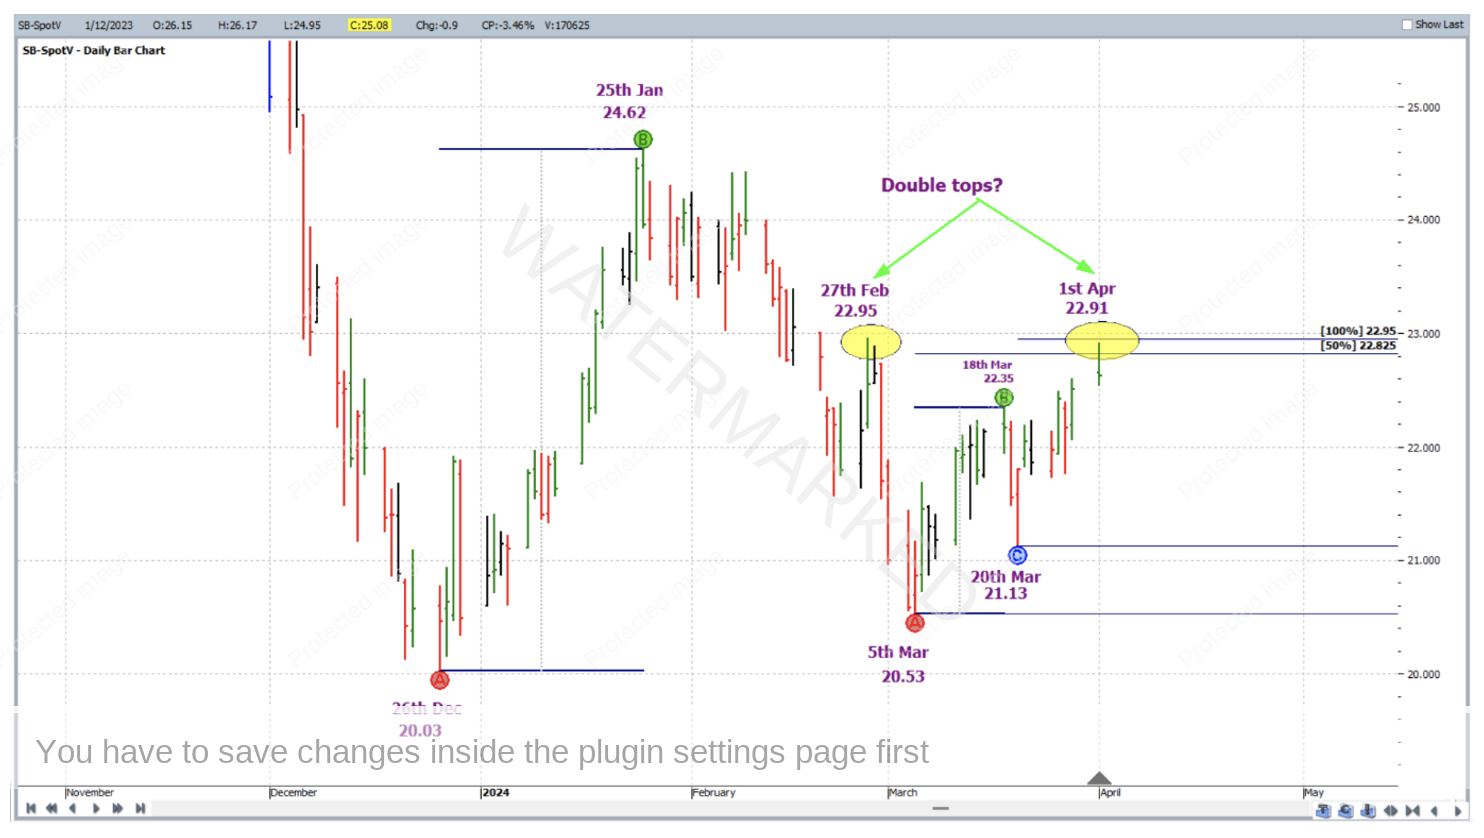
The analysis for the trade is comprised of two applications of the ABC Pressure Points tool (what we alternatively refer to as “Repeating Ranges”), and one double top.
For clarity and ease of reading the chart, only the milestones that are relevant to the price cluster have been left switched on in these software drawing tools: 50% from one ABC application, and 100% from the other. Our charts can get quite busy quite quickly – so by switching off the information which is not part of the analysis (by going into the Drawing Tool’s properties and unchecking as many boxes as required), whenever we refer back to these charts we can quickly re-gather our thought patterns as they were when the chart was created in the first place, efficiently moving onto any other charts if nothing is happening (or about to happen!) with a specific chart on the day, thereby speeding up the daily scanning process/trading routine.
The trade setup came about very early in April of this year, and is shown below on the daily bar chart in Walk Thru mode.
Above of course is the picture, but here is the analysis in words, i.e. the three inputs to the price cluster:
- Repeating Ranges (primary, bigger picture application):
- Point A: 26 December 2023 low (20.03 cents per pound)
- Point B: 25 January 2024 high (24.62)
- Point C: 5 March 2024 low (20.53)
- 50% milestone = 82
- Repeating Ranges (secondary, smaller picture application):
- Point A: 5 March 2024 low (20.53)
- Point B: 18 March 2024 high (22.35)
- Point C: 20 March 2024 low (21.13)
- 100% milestone = 95
- (potential) Double Tops:
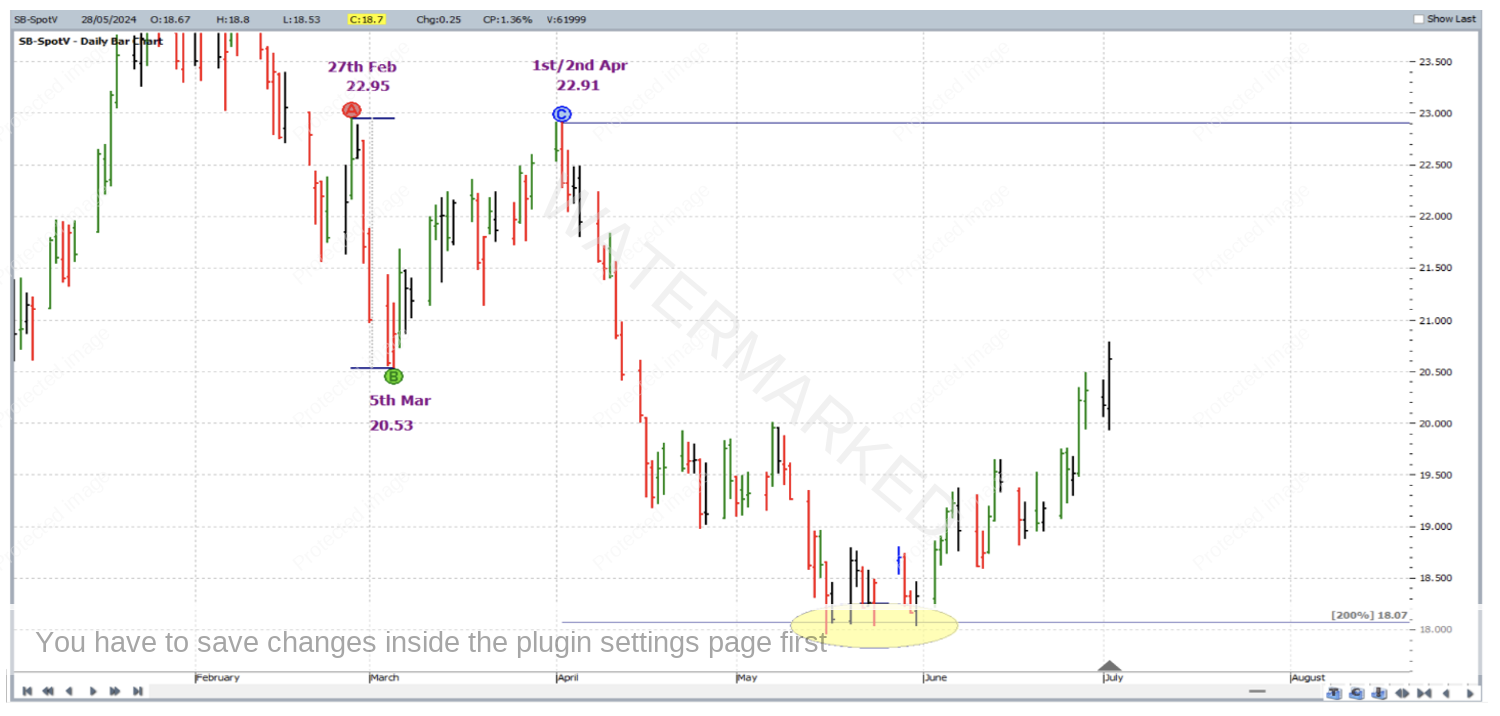
- 27 February 2024 high (95) and 1 April 2024 (22.91)
As an exercise, see if you can reproduce this chart exactly as it is, in your own software.
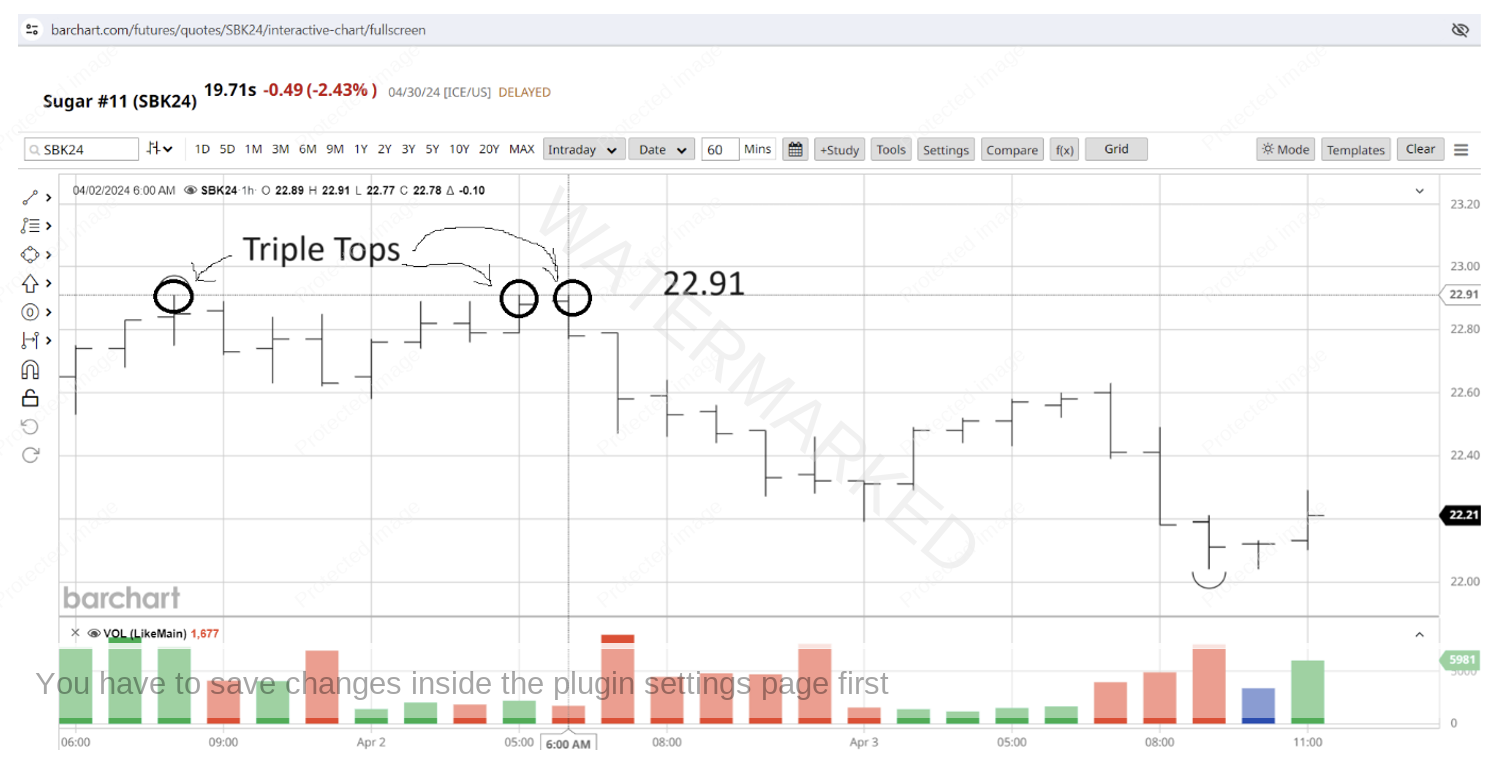
The three price cluster inputs averaged out at 22.91. Zooming into the intraday chart, as the potential top came there were triple tops on the hourly barchart – all at exactly 22.91; this is shown below in a screenshot from barchart.com.
Given the quality of this setup, and the usual goal of a high reward to risk ratio, the turning down of the hourly swing chart just after the triple tops at 7AM Eastern Time on 2 April 2024 would have had you short the May 2024 Sugar contract at 22.76 with an initial exit stop one point above the triple tops (and one point above the cluster average for that matter) at 22.92;
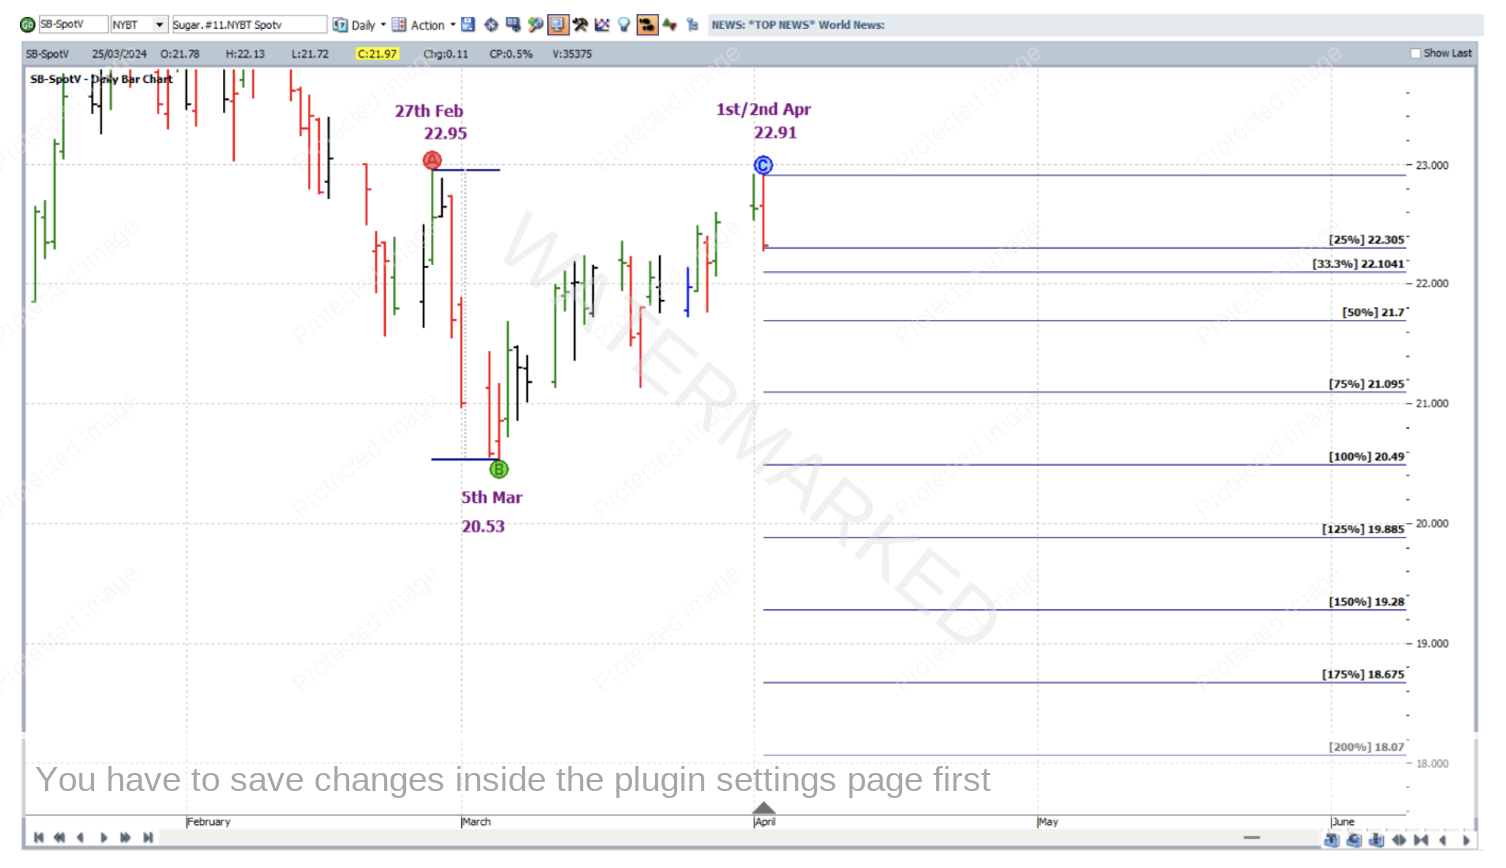
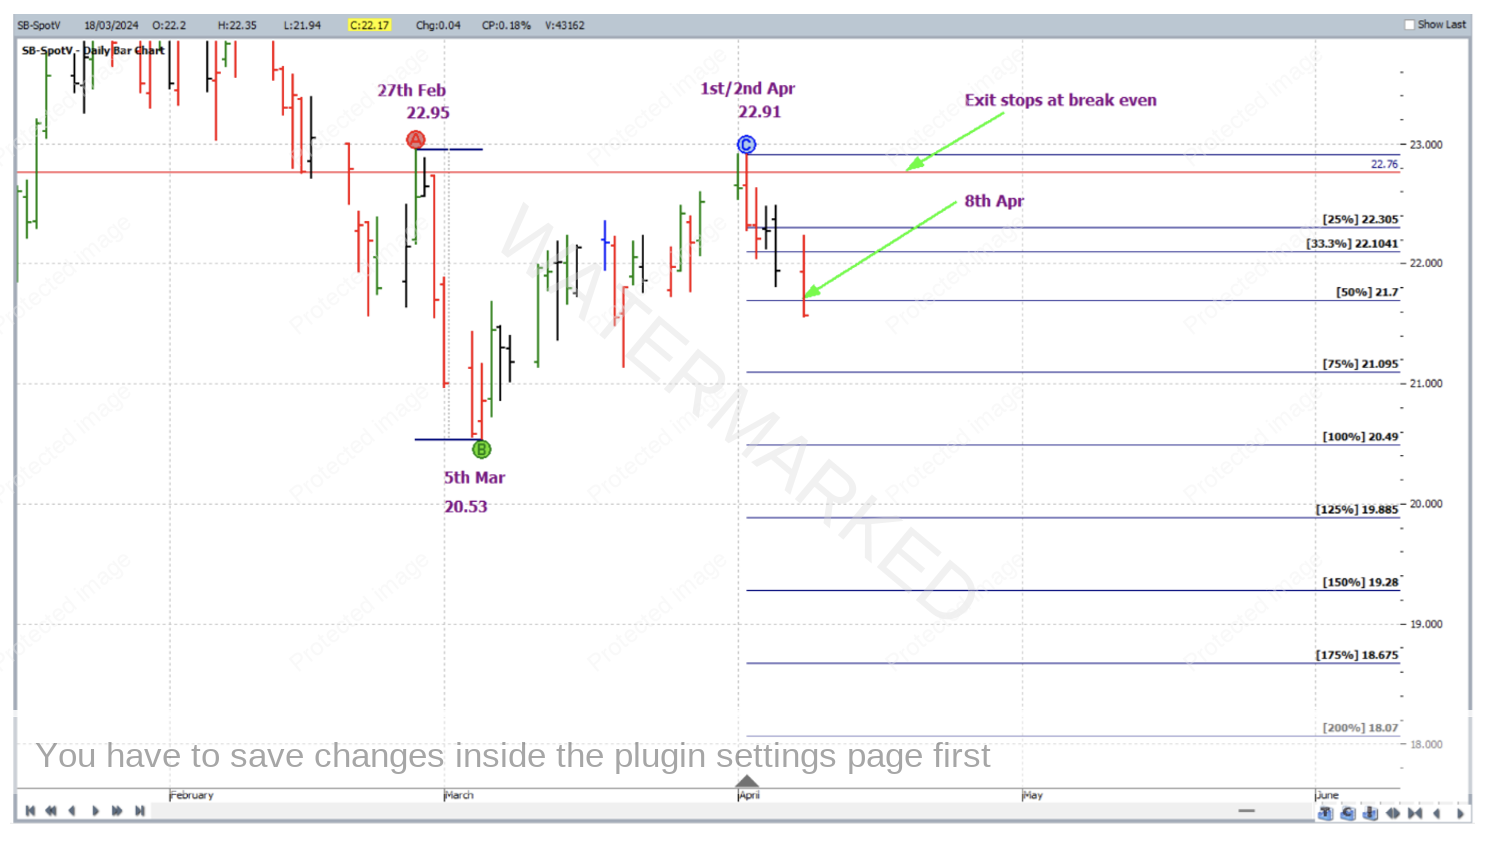
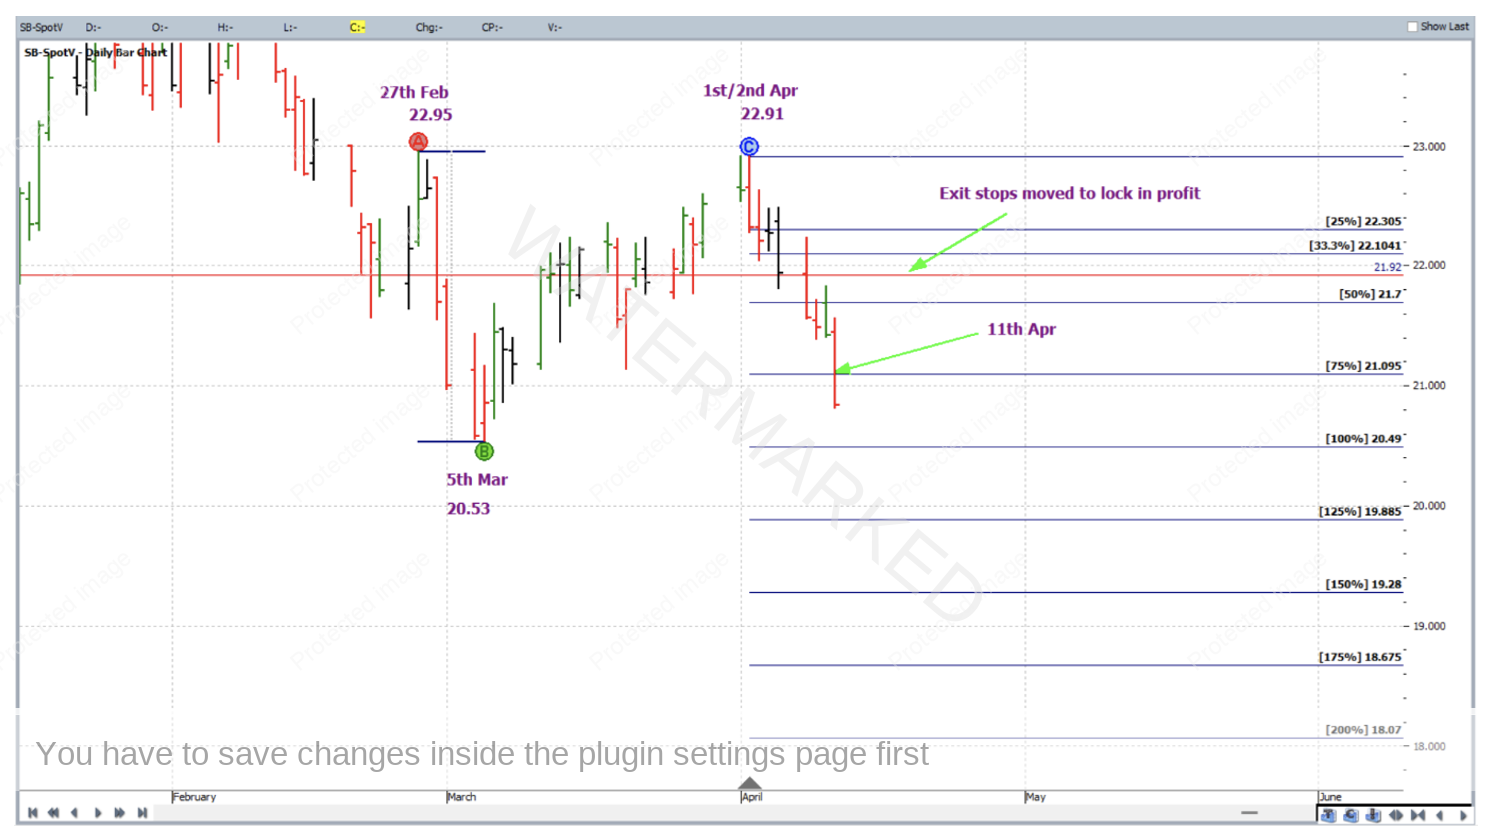
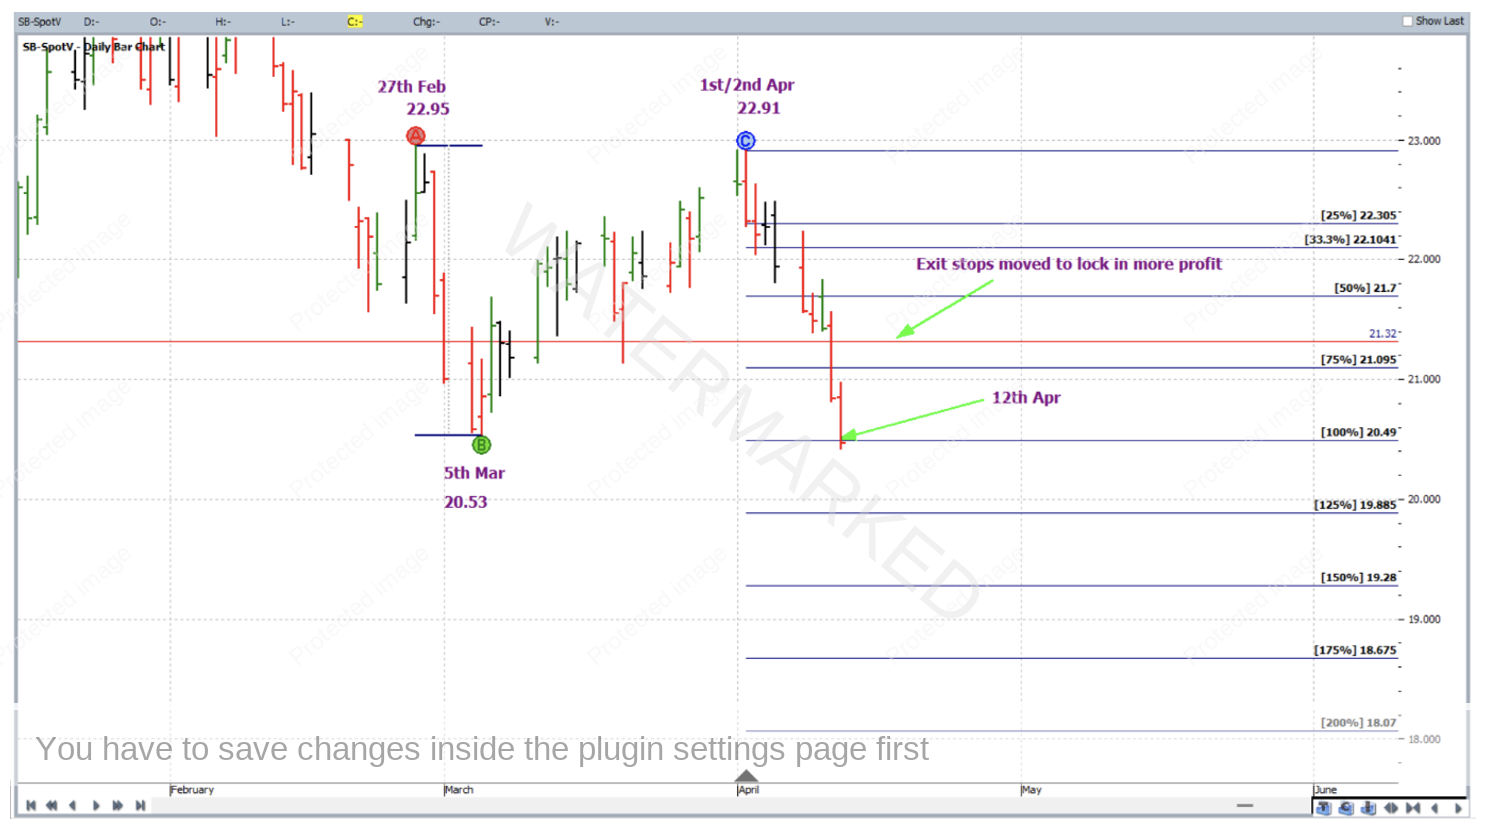
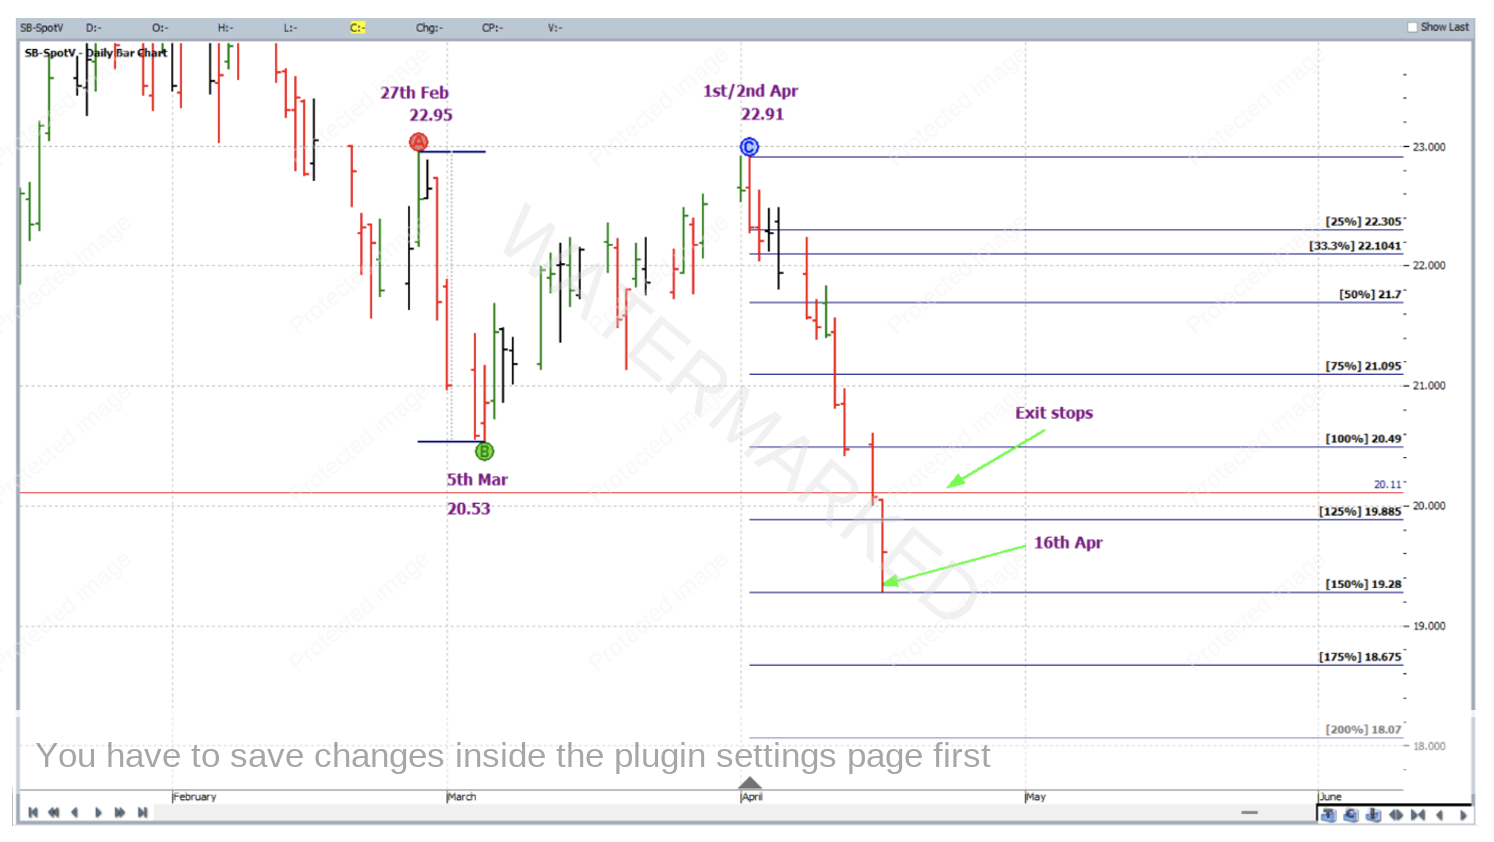
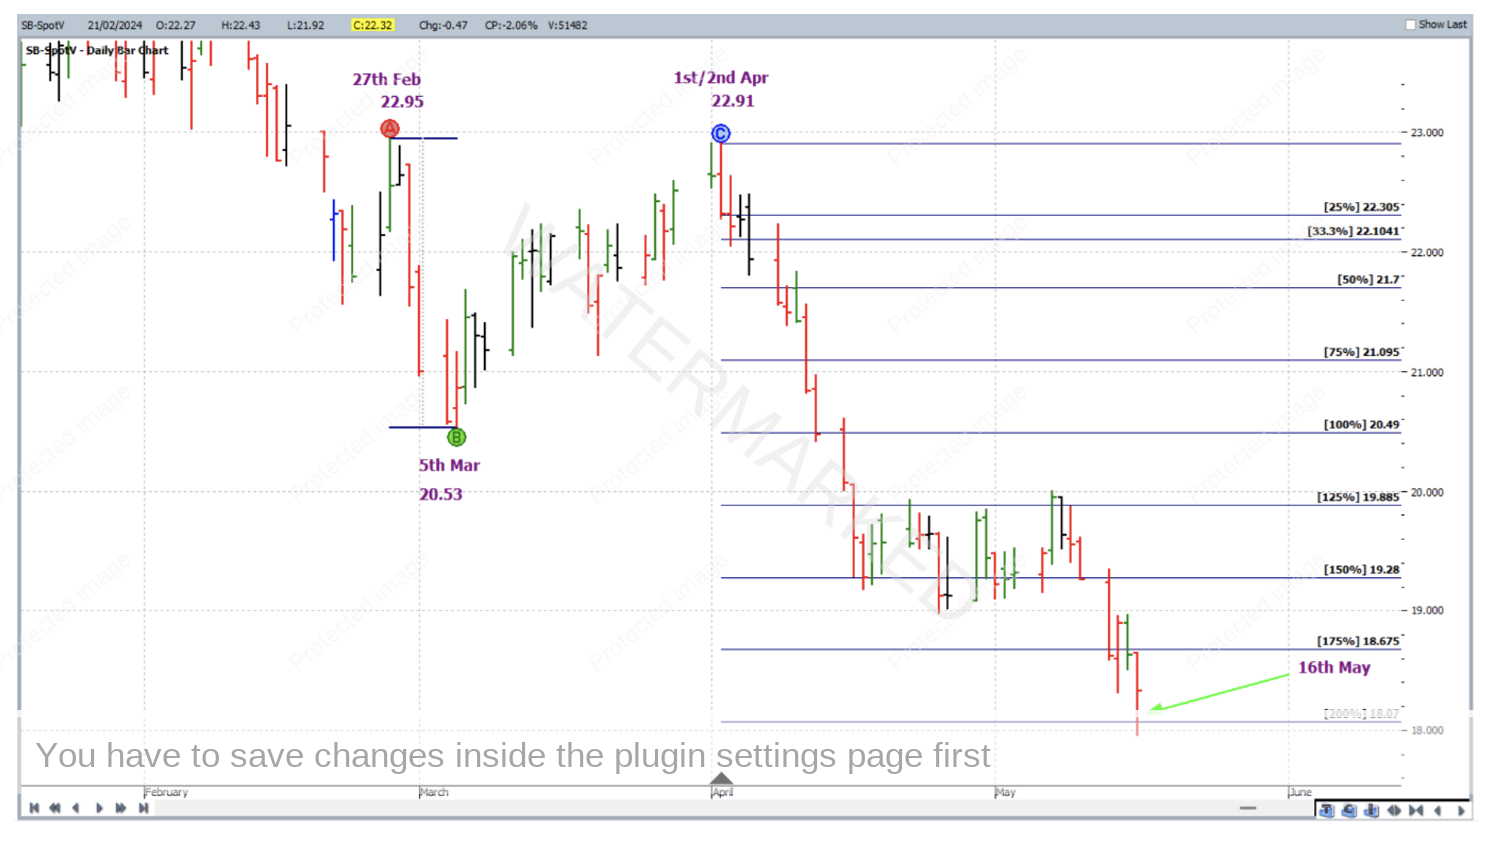
With regards to trade management, with Points A, B and C applied to this potential double top formation as per the chart below, the exit target was the 200% milestone of the double tops, with stops to be managed currency style. This means that as each multiple of 25% was reached, stops were moved down to one third of the average daily range (based on the last 60 weekly bars) above the previous milestone.
On 8 April 2024, the market reached the 50% milestone and stops were moved to break even.
On 11 April 2024, the 75% milestone was reached and exit stops were moved to one third of the average daily range (approximately 22 points) above the 50% milestone (i.e. to 21.70 + 0.22 = 21.92) to lock in some profit.
On 12 April 2024, the 100% milestone was reached and exit stops were moved to one third of the average daily range above the 75% milestone to lock in more profit.
Within the one trading session for 16 April 2024, the market broke through the 125% milestone and lowed precisely on the 150% milestone, so upon receiving those price alerts, stops were moved twice that trading day to lock in even more profit above the 125% milestone.
Continuing to manage stops in this way, the position was held all the way to the 200% milestone, where on 16 May 2024 profits were taken at 18.07. Note that around mid-April, rollover from the May contract to the July contract was required, therefore trade exit was done so from the July 2024 Sugar contract.
Now to break down the rewards, firstly in terms of the Reward to Risk Ratio:
Initial Risk: 22.92 – 22.76 = 0.16 = 16 points (point size is 0.01)
Reward: 22.76 – 18.07 = 4.69 = 469 points
Reward to Risk Ratio: 469/16 = approximately 29 to 1
According to the specifications on the ICE website each point of price movement changes the value of one Sugar futures contract by $11.20USD. So in absolute USD terms the risk and reward for each contract of the trade were determined as follows:
Risk = $11.20 x 16 = $179.20
Reward = $11.20 x 469 = $5,252.80
At the time of taking profit this reward was approximately $7,860 AUD.
If 1% of the account size was risked across the space of the hourly bar at trade entry, the resulting percentage change to the account size after taking profits would be calculated as:
29 x 1% = 29%
When trading this strongly trending market via a CFD, much lower minimum position sizes are available.
If stalking out intraday entries on the overnight market feels a little red-eyed (and they can be!), alternatively, a much less energetic (not to mention less aggressive) entry signal was at the turning down of the daily swing chart on 2 April 2024. It would have had you short at the lower price of 22.52 but would, after following the same trade management plan and doing all reward calculations, still have offered a Reward to Risk Ratio of 11 to 1. And if you’d missed the extreme top, a First Lower Swing top entry on 5 April would have also offered 11 to 1.
This trade came around about the Easter period. Needless to say this is a very busy time for most, therefore extra diligence and discipline was required to maintain the trading routine in order to capture a trade as such, especially if the goal was a very big Reward to Risk Ratio.
On a final note, we observe the 200% milestone and how it has since supported the market. It could have even gone towards a case for the calling of the next low! David wrote the 200% rule for double tops and double bottoms in the Number One Trading Plan manual with good reason.
Work hard, work smart
Andrew Baraniak
