A Look at the Euro
Taking a look at the Euro, I’m going back to the 28 December 2023 and 8 March 2024 monthly swing tops as this month’s case study. Chart 1 below shows three weekly swings up into roughly 100% of the previous monthly swing range. The last weekly swing range of 417 points was contracting and a sign that this monthly swing might be over.
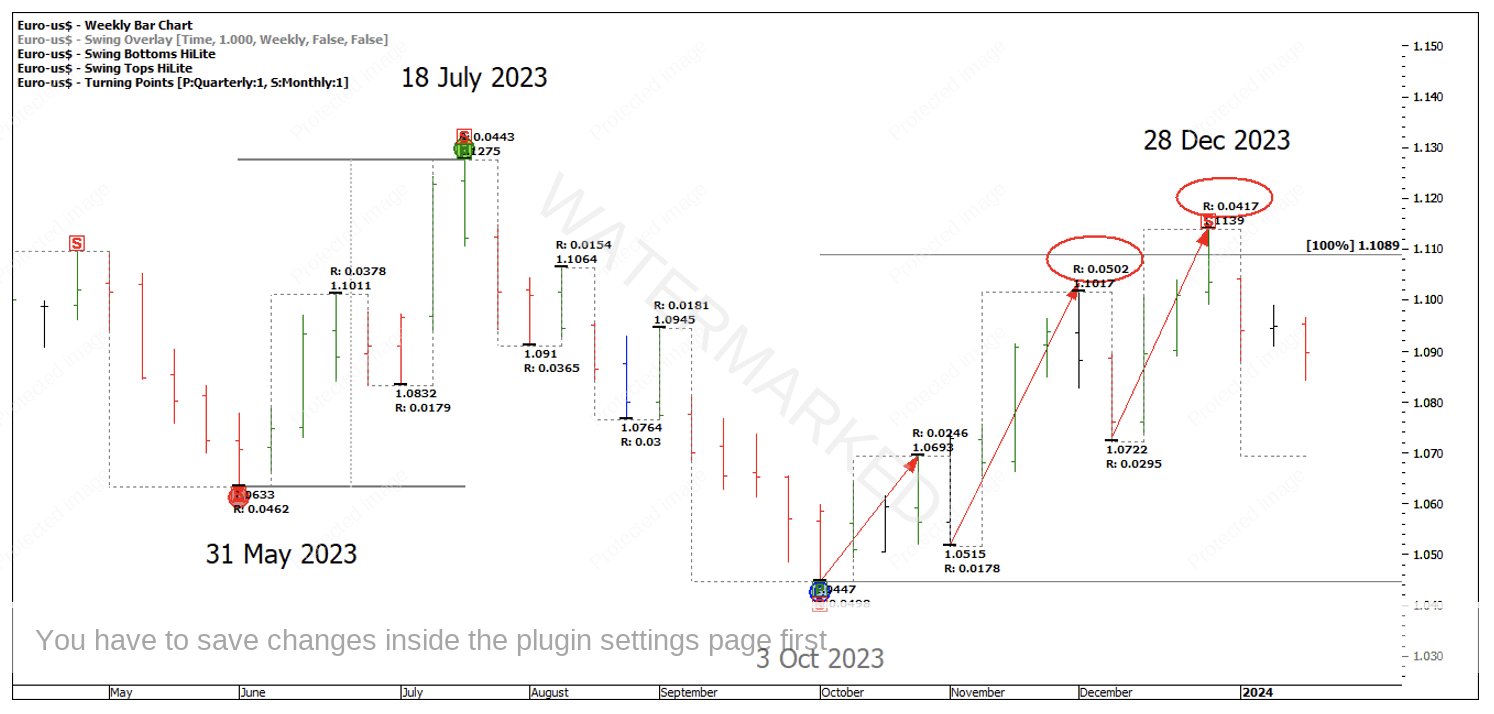
Chart 1 – Sections of the Market
Next, we saw the Overbalance in Time and Price.
In Chart 2 below, you can see a price range of 446 points being 150% compared to its last. Not a full 200% although seven weeks down is a big Overbalance in Time compared to the one-week pullbacks seen previously from 3 October to 28 December.
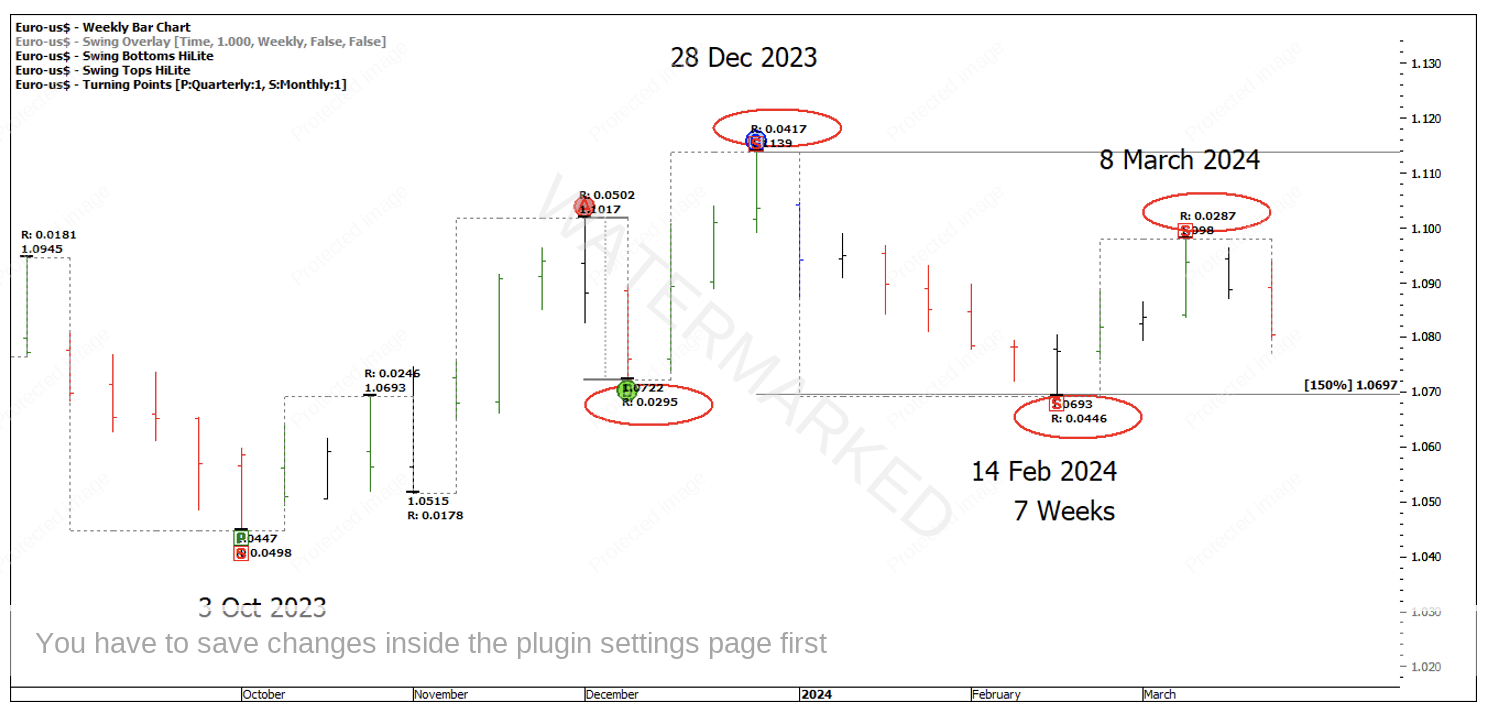
Chart 2 – Overbalance in Time and Price
Next a contracting price range up into the 8 March top of 287 points, a bit over 50% of the previous range up of 417 points. This is often the failure point, but how could you have picked the 8 March top as a weekly swing high to get short from?
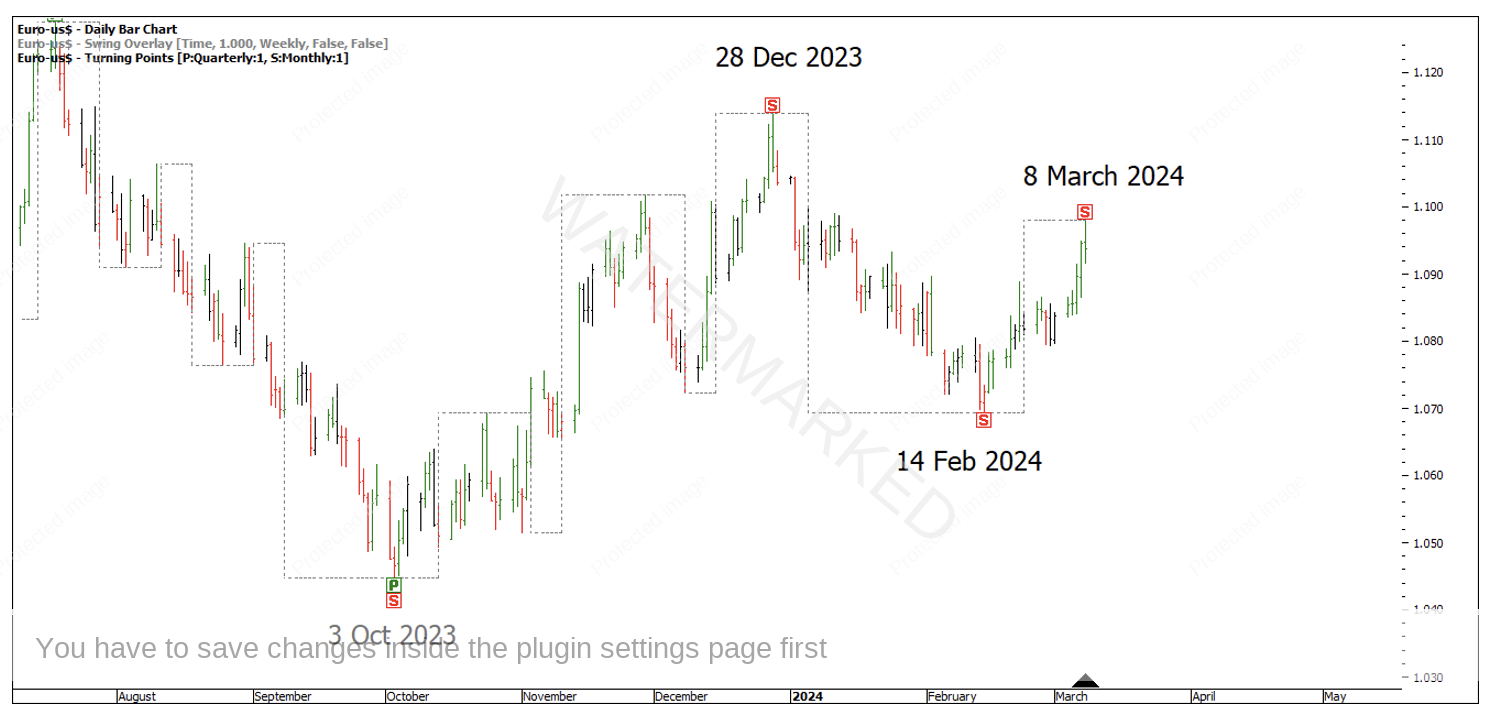
Chart 3 – Weekly Swing Overlay
The run down into 14 February was 48 days, the run up into 8 March was a near exact 50% time retracement of 23 days. The daily swing range was a repeating time range up of 8 days.
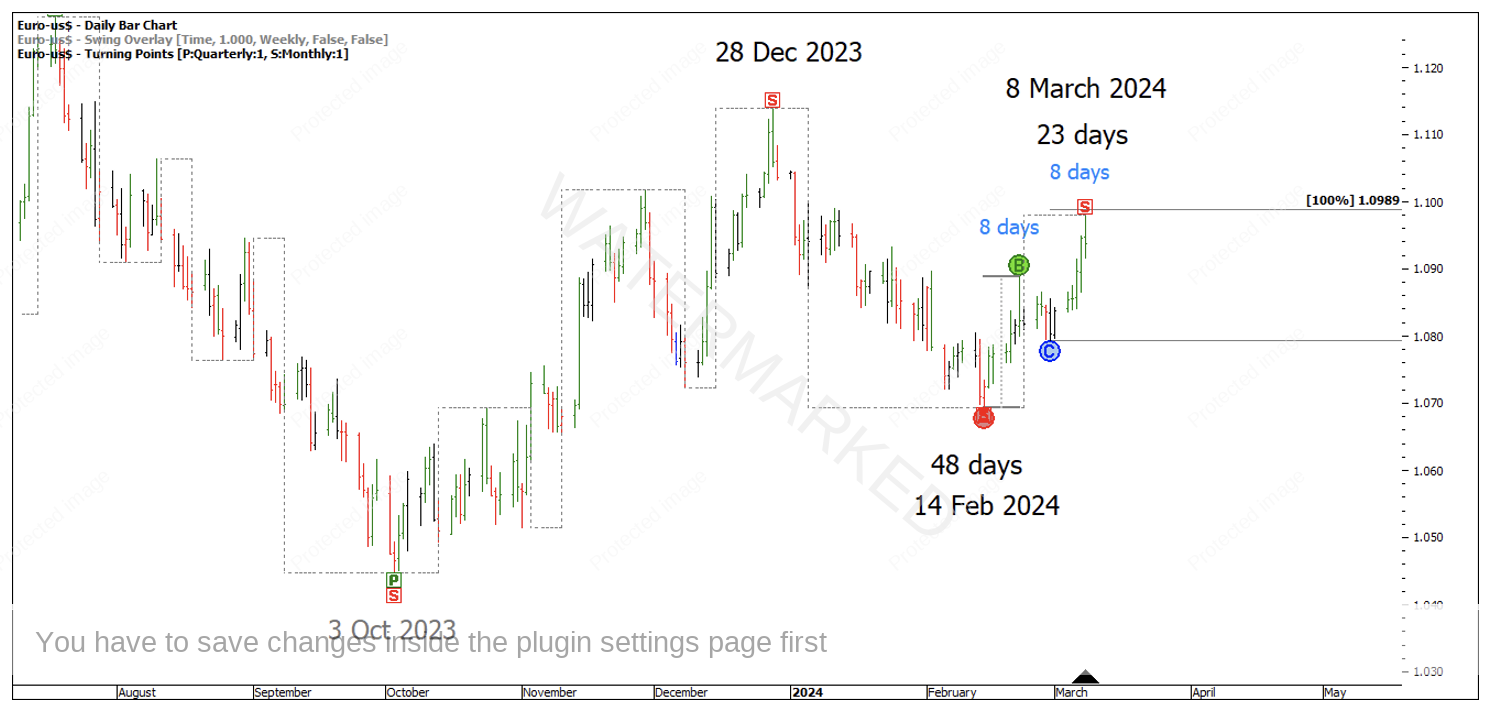
Chart 4 – Time Balance
This is good time harmony, but to top it off, 8 March is 92 degrees from the 8 December 2023 low.
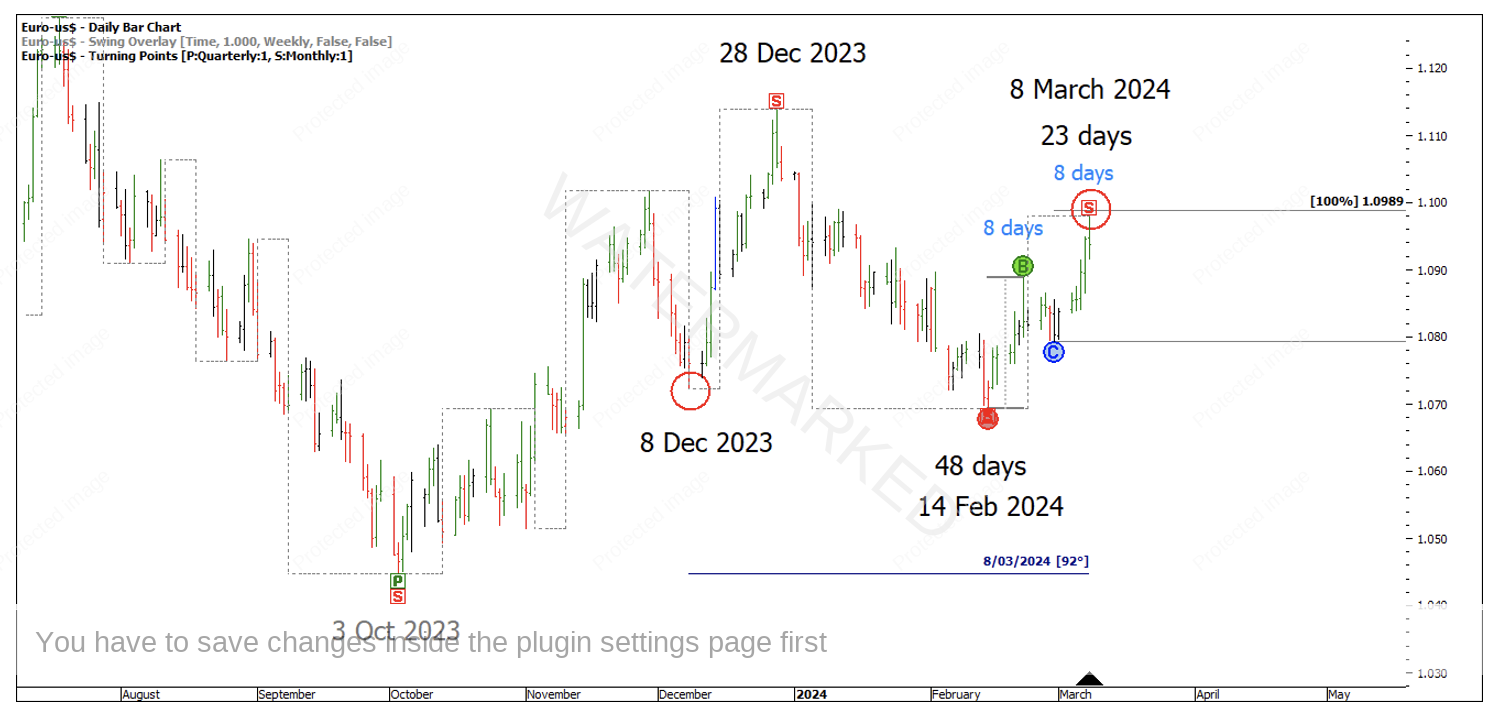
Chart 5 – Time by Degrees
Looking at a big picture Ranges Resistance Card over the quarterly range from 6 January 2021 to 28 September 2022, the 8 March top sits on a large 50% retracement. There have been multiple false breaks of this level and has been stronger resistance than has been support.
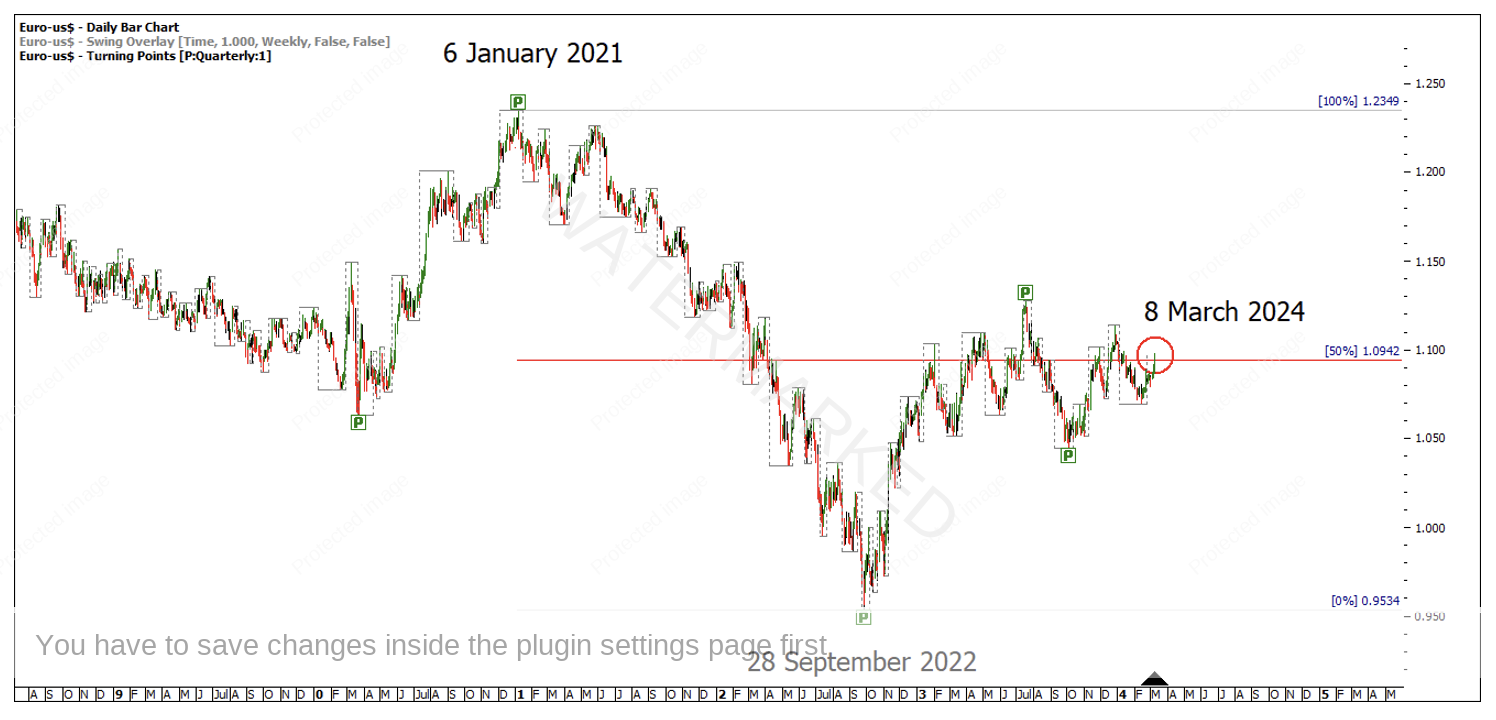
Chart 6 – Quarterly Range 50% Retracement
A smaller Range Resistance Card shows the 8 March top finding resistance at the 62.5% resistance level of the weekly swing range.
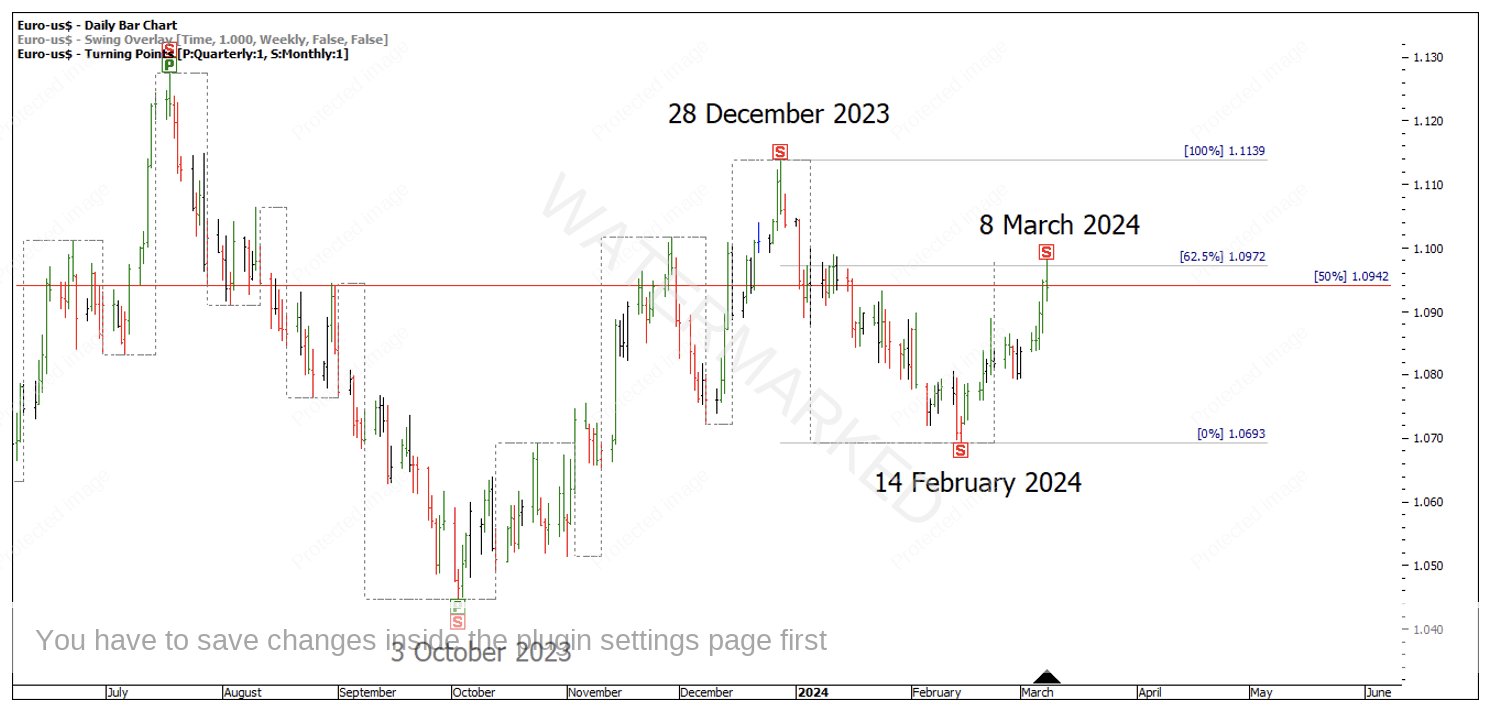
Chart 7 – Weekly Ranges Resistance Card
Looking at a few possible entry scenarios, the 1-hour bar on the day of the top was a very large range bar of 61 points. An inside bar followed, and entry could have been gained as the low of this inside bar was broken at 1.0944 with a stop at 1.0981 and a risk of 37 points.
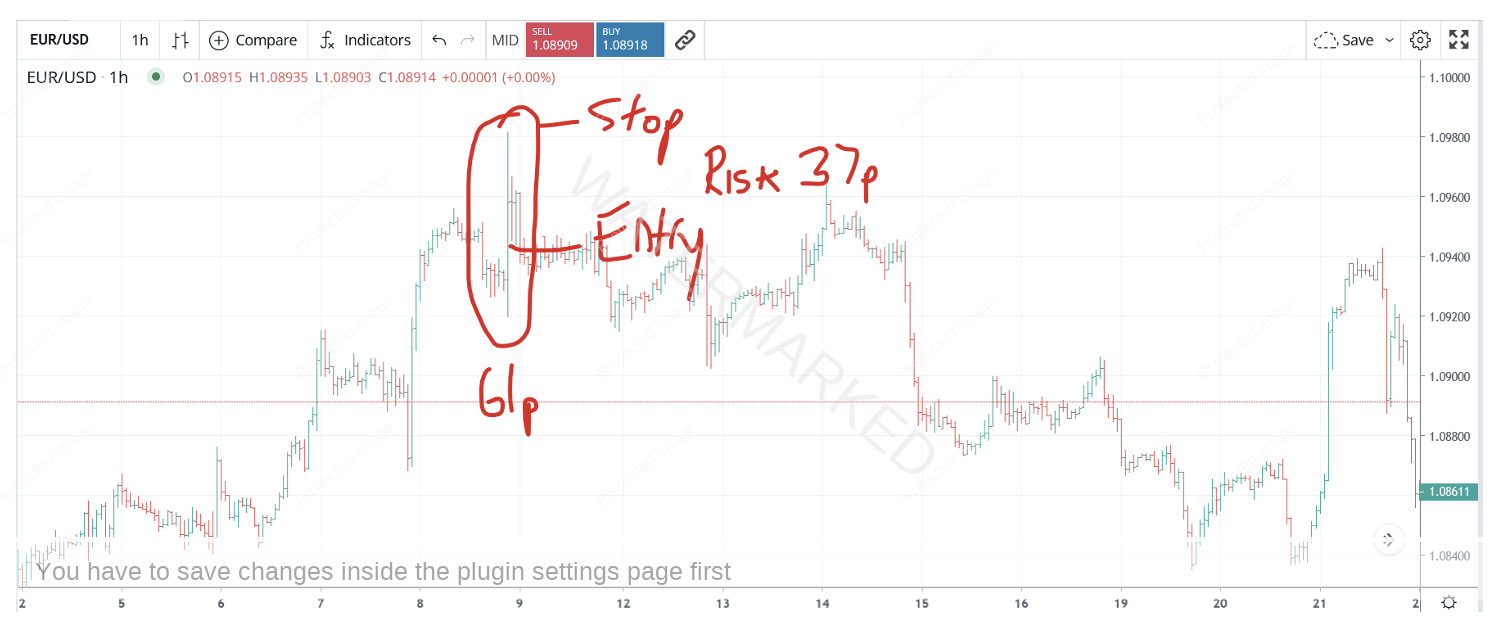
Chart 8 – 1 Hour Bar Chart
Best case scenario, if you had managed to take profits at 100% of the weekly swing range, you could have banked an 8.5 to 1 Reward to Risk Ratio (RRR) on the trade.
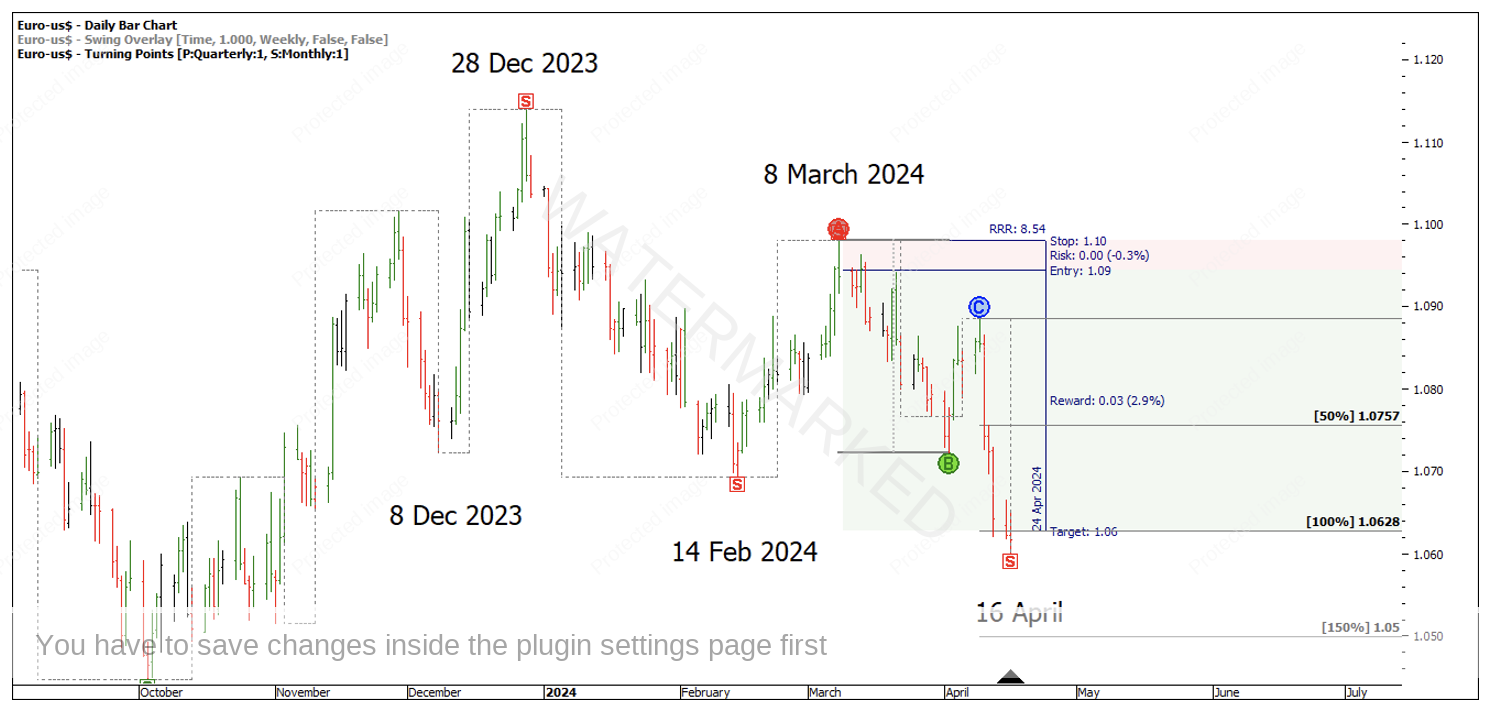
Chart 9 – Reward to Risk Ratio
However, I believe there could have been a much better return on offer by patiently waiting for a smaller entry bar and a lower risk. There are two options below that are worth thinking about how you may have entered. I’ll leave it for anyone interested to investigate further a possible entry type and the kind of Reward to Risk Ratio return that was up for offer on what was only a small move.

Chart 10 – Potential 1 Hour Entry

Chart 11 – Potential 1 Hour Entry
The Euro has been pushing higher out of April and June lows. This large 50% level mentioned earlier is again approaching and there the potential for double tops at the 100% milestone which lines up with the 8 March top.
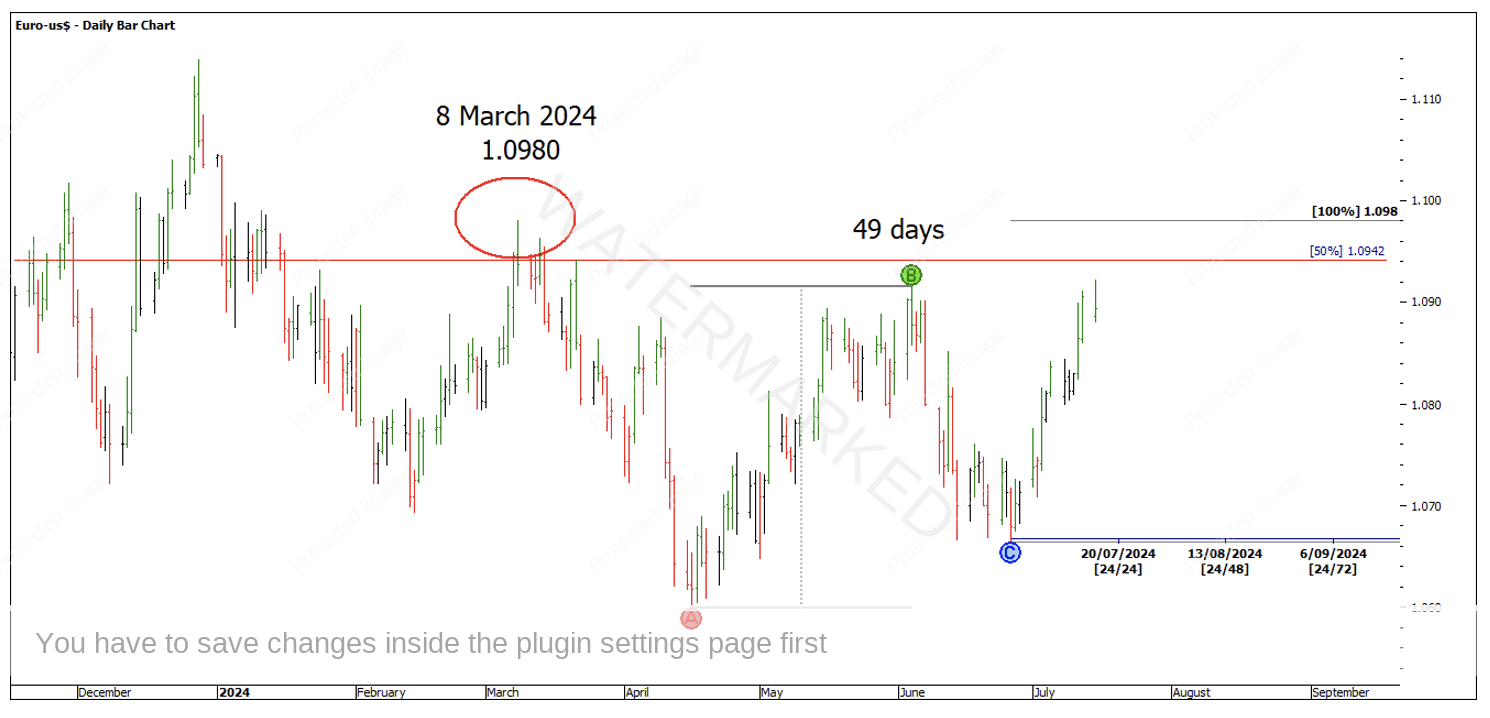
Chart 12 – Approaching Support or Resistance
This type of double top setup is always worth watching, but if tops are clearly broken then the 50% level which has previously been resistance may become the new support level.
Happy Trading,
Gus Hingeley