A Picture Tells a Thousand Words
It’s been a big month since the last Safety in the Market article. To recap, the SPI200 put in a weekly swing high on 27 March at 8070 then dropped 898 points to make a low on 7 April at 7172.
Could you have been short and profited from this move down, regardless of the news? I had some of my best trading through January and the first half of February then found myself in the ‘washing machine’ a bit through the second half of February and March.
On reflection when I look at the weekly and daily swing chart with no emotion, I wonder why I was overthinking it.
If I could sum up one of the greatest setups straight out of the Active Trader Program in one picture Chart 1 below would be it! If you are a little unsure at all why the below is a great setup then take your time and study the chart below carefully.
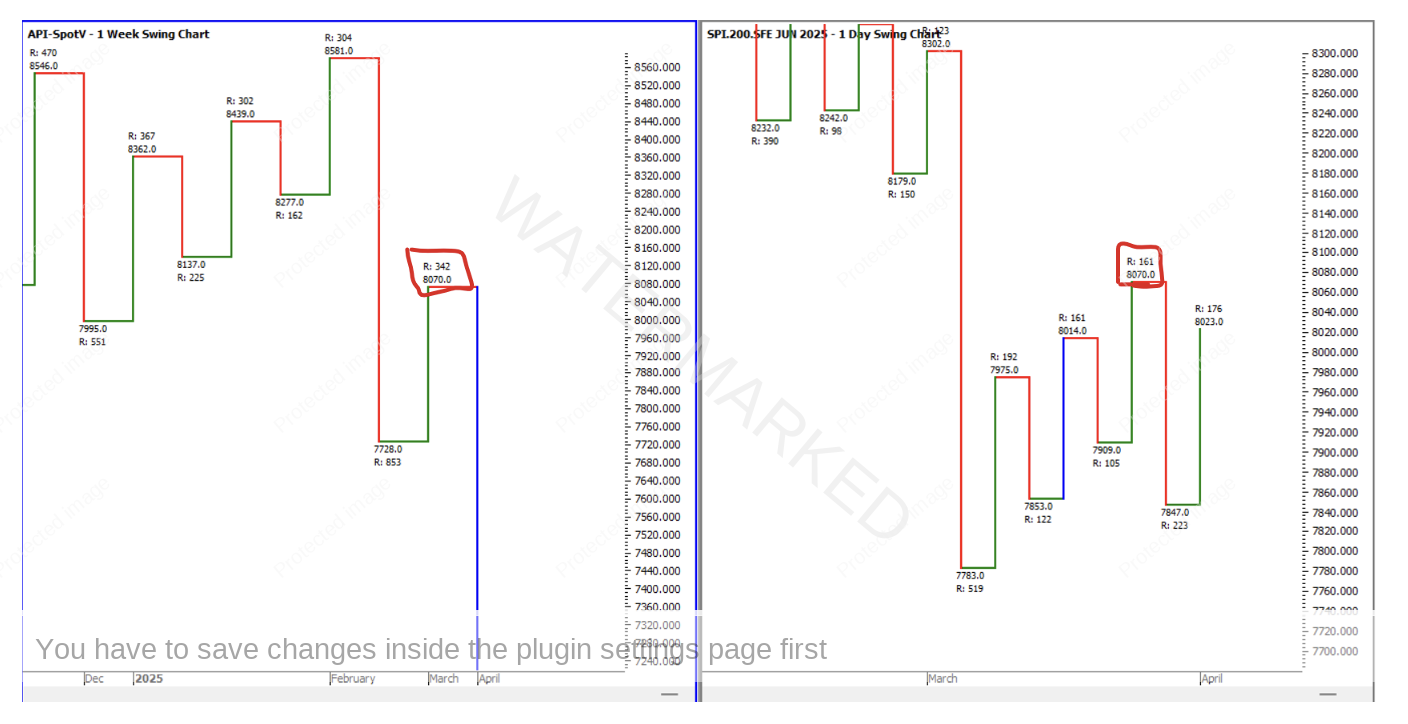
Chart 1
The left Chart is the weekly swing chart and shows three weekly swings up into 8581 followed by a big Overbalance in Price then a swing up of 342 points into 8070 or just through 100% of the last weekly swing up of 304 points.
The right-side chart is the June contract month (API-2025.J) and shows three daily swings up into 8070. This time we saw the SPI200 do an exact repeating range of 161 points into 100% of the last weekly swing range. Then a 200% Overbalance in Price to the downside of 225 points. This is a very strong signal the market is heading lower, and the weekly swing top is in. Amazing how clear the swing charts make it look when you take out all the noise spewing out from the media.
You will notice I’m showing the contract month instead of the continuous contract as contract roll over was around mid-March, and you need to be looking at both.
As you can see in Chart 2 below the continuous chart has a slightly different picture. Instead of showing three swings into 8070 finishing with an exact repeating range, we see two swings, with the second failing at 50%. You should always be watching both these charts.
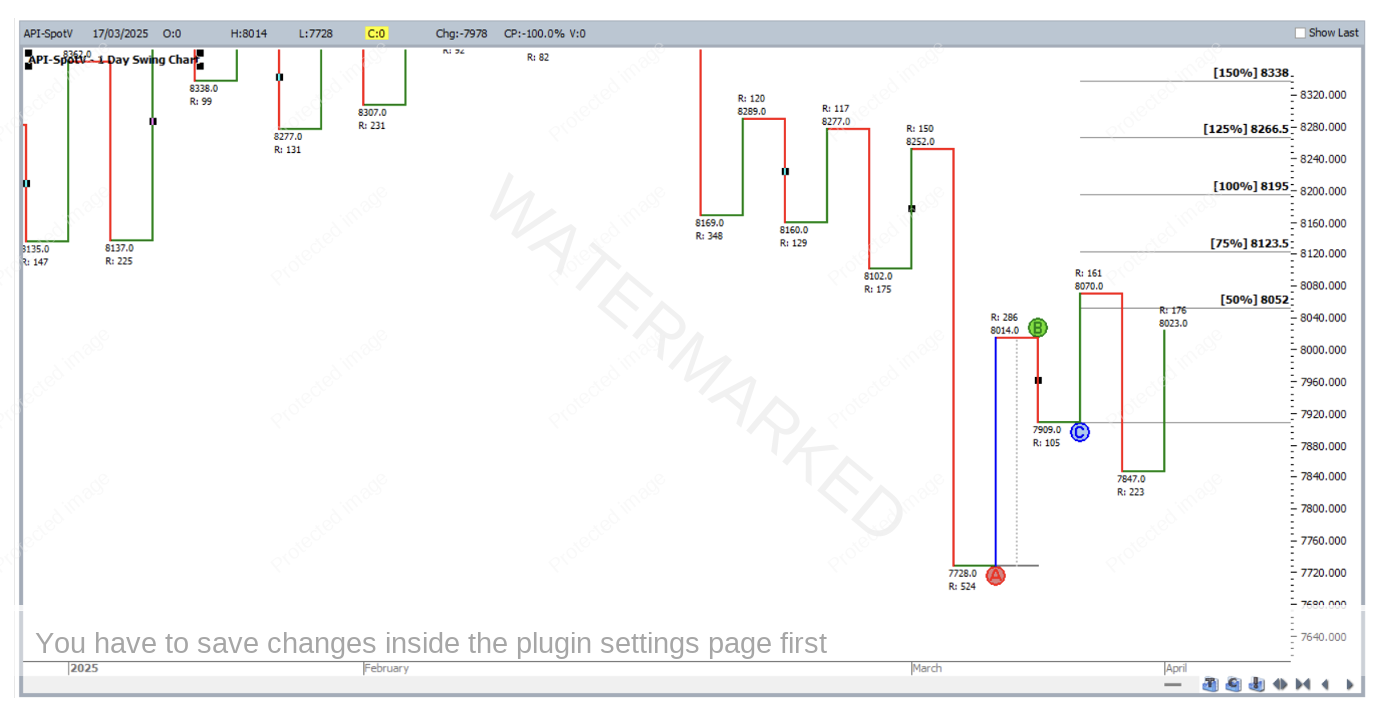
Chart 2
Now trading this move had its challenges! If you had been on the front foot and looking for a weekly top to get short out of, then watching the 4-hour swing chart for the last daily swing up into 8070 saw three 4-hour swings into the high with the third swing failing to reach the 50% milestone.
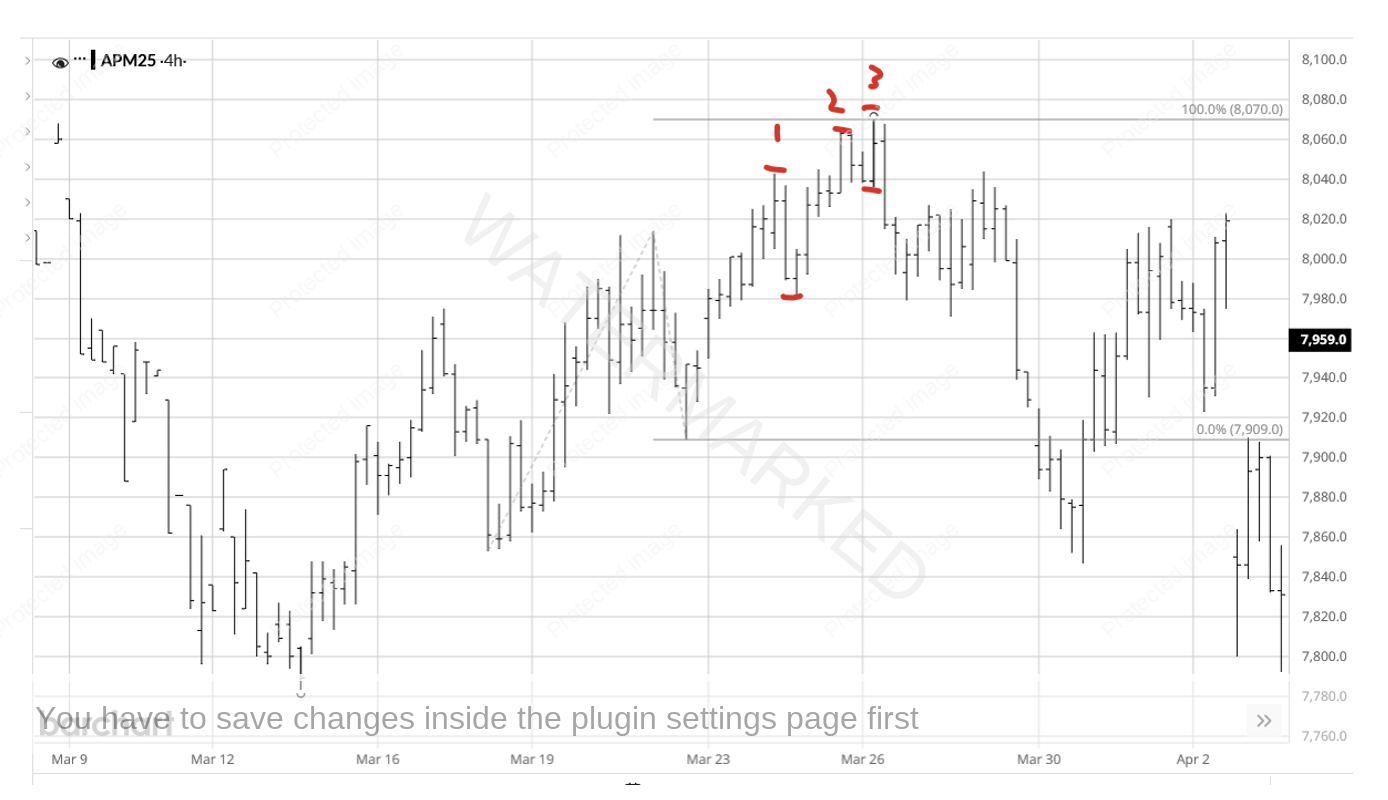
Chart 3
If you had entered as the 4-hour swing chart turned down at 8035, it would have confirmed a contracting swing up that failed to hit the 50% milestone of 8077.5. David Bowden said that for an ABC trade, if the trade fails to reach Point B, then breaks Point C it’s a very bad sign! This form reading can be applied to the below and the second last 4-hour swing into the top.
The SPI200 never reached 8077.5 or Point B, then entry was gained at 8035 as Point C was taken out or as the 4-hour swing chart turned down. This could have you in the trade with about a 36-point risk.
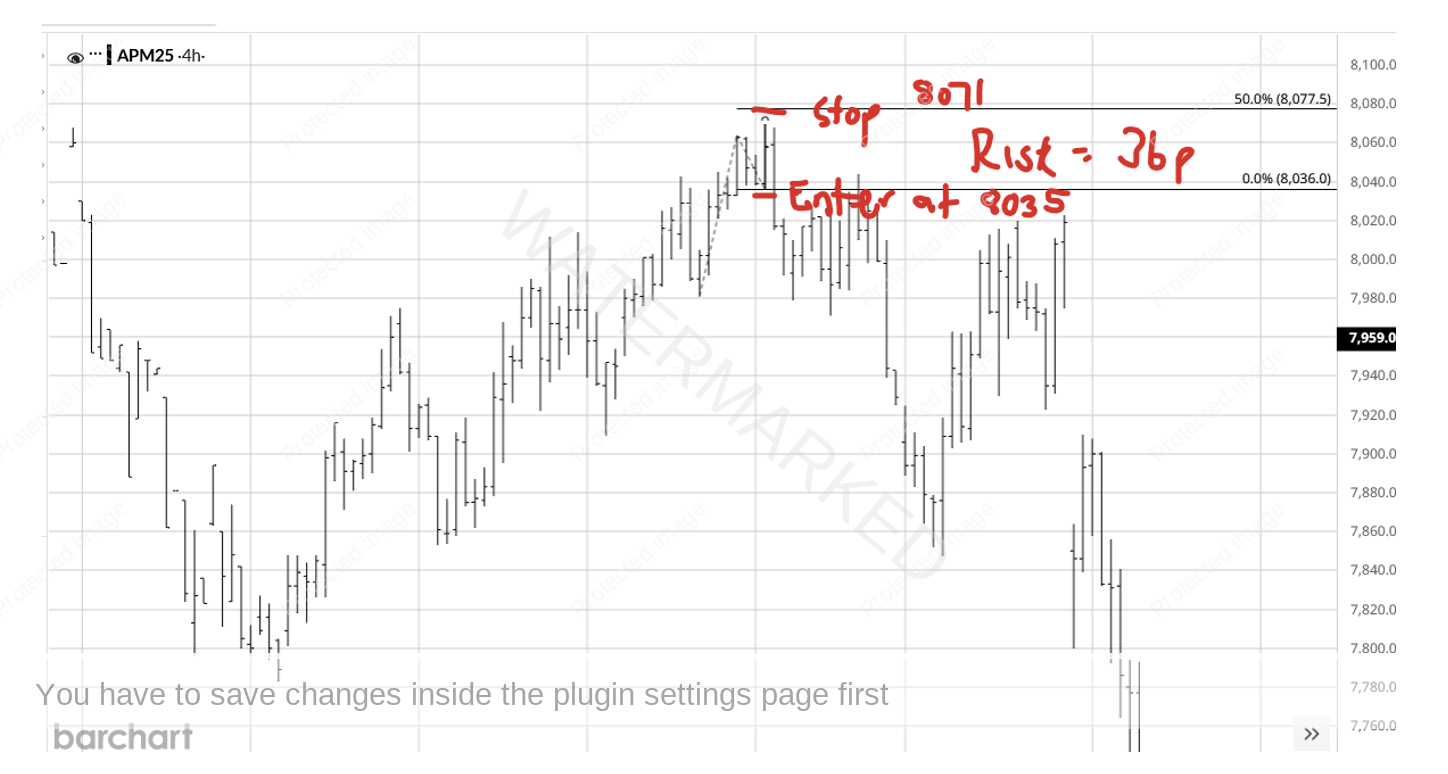
Chart 4
Needless to say, there was a great Reward to Risk Ratio for this one entry giving you about a 22 to 1 if you exited at the 100% weekly swing milestone.
There were other entries depending on your trading plan parameters, so I would encourage you to do a thorough analysis of this time if you were in a trade or not and potentially update or tweak your trading plan if required.
So far, we’ve seen a low at 7172 on 7 April which is finding support on the
- 100% weekly swing milestone = 7217
- 50% of the COVID run down = 7193
- 75% retracement between 8581 and 6746 = 7204
- 400% of the Daily first Range Out = 7178

Chart 5
Time will tell whether this is going to be our yearly low or not, it wouldn’t surprise me if it was. We saw the SPI200 do a daily range of 566 points in the day/night session dropping into the low, then another daily range of 551 points coming out of the low under very high volume and at a very strong pitch that could be comparable to the 2020 COVID low.
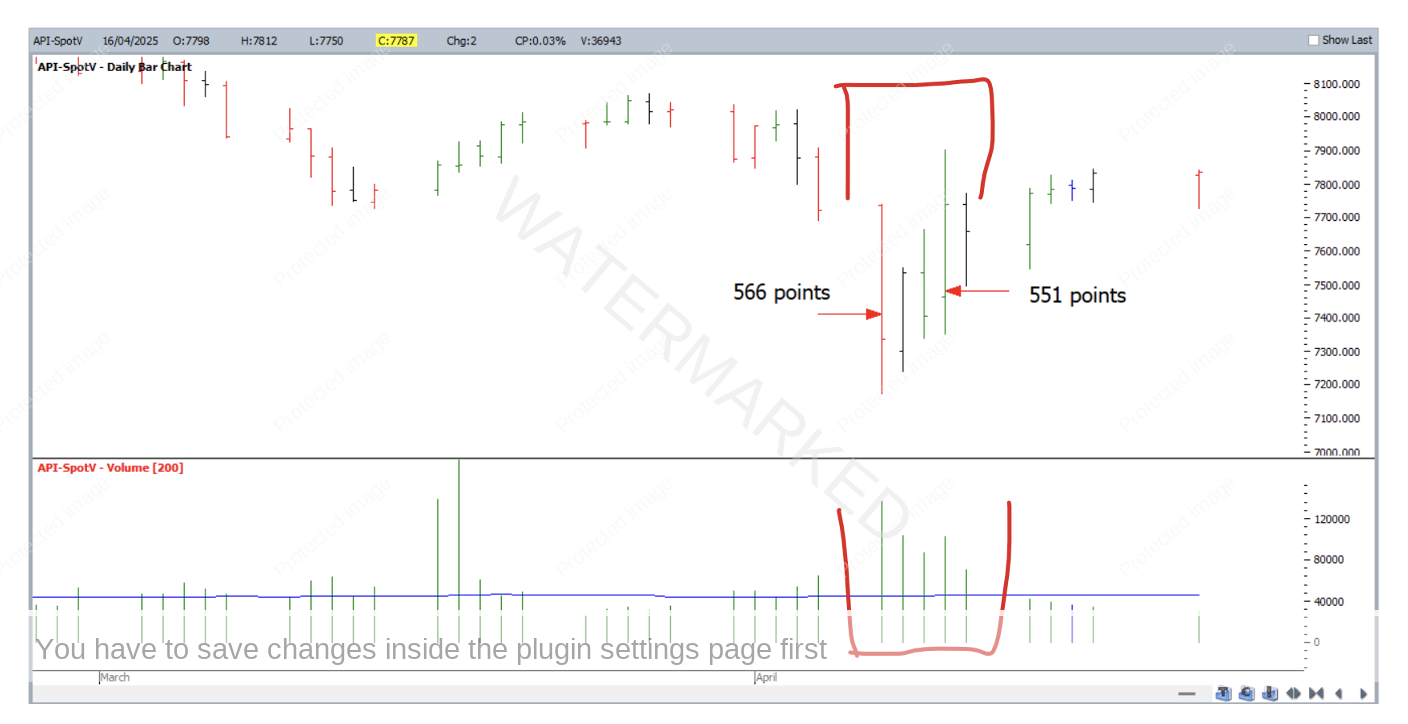
Chart 6
Regardless of my opinion, we are best to watch the swing charts and let them be the indicator of when to trade and when to stay out.
Happy Trading,
Gus