A Send Off
I would like to take this opportunity to give a huge heart felt thank you to Mat and to take a moment to appreciate your contribution to helping students like myself along their trading journey.
I remember in 2017 when I started my Master Forecasting journey how incredibly fortunate I felt to have email support from Mat to help me dissect what seemed like an impossible task. It was a dream come true, and I’m not sure I would have been able to get through it without your support!
From myself I wish you all the very best and hopefully see you back in the SITM realm one day!
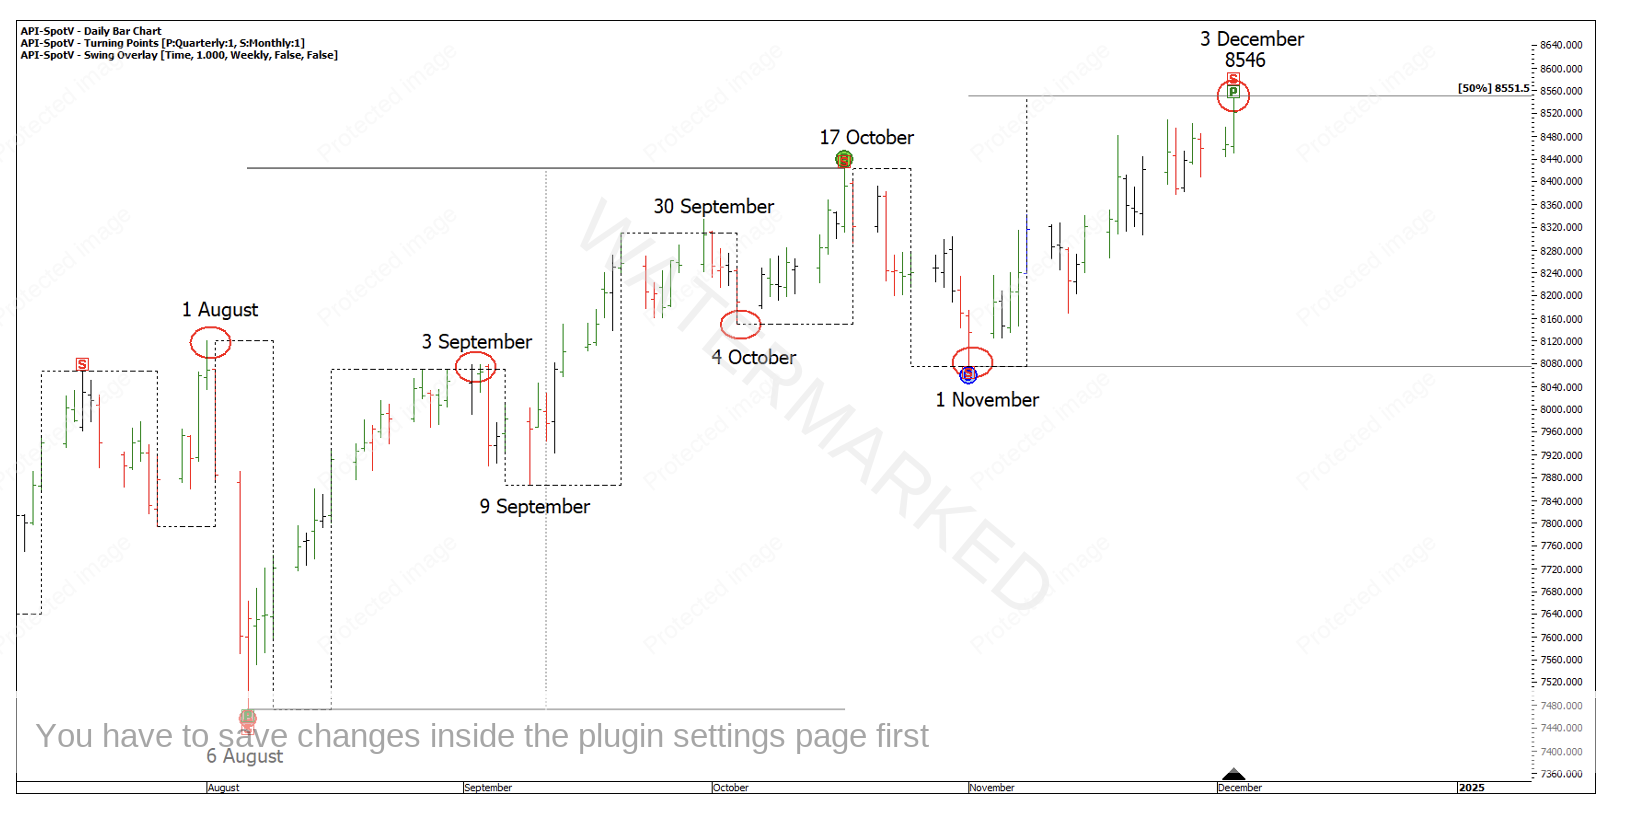
This month I want to look at the 3 December top on the SPI200 as a starting point for a cluster. Starting with the monthly turning points on the daily bar chart, 50% of the monthly swing gave a price target of 8551.5, see Chart 1 below.
Chart 1 – Monthly 50% Milestone
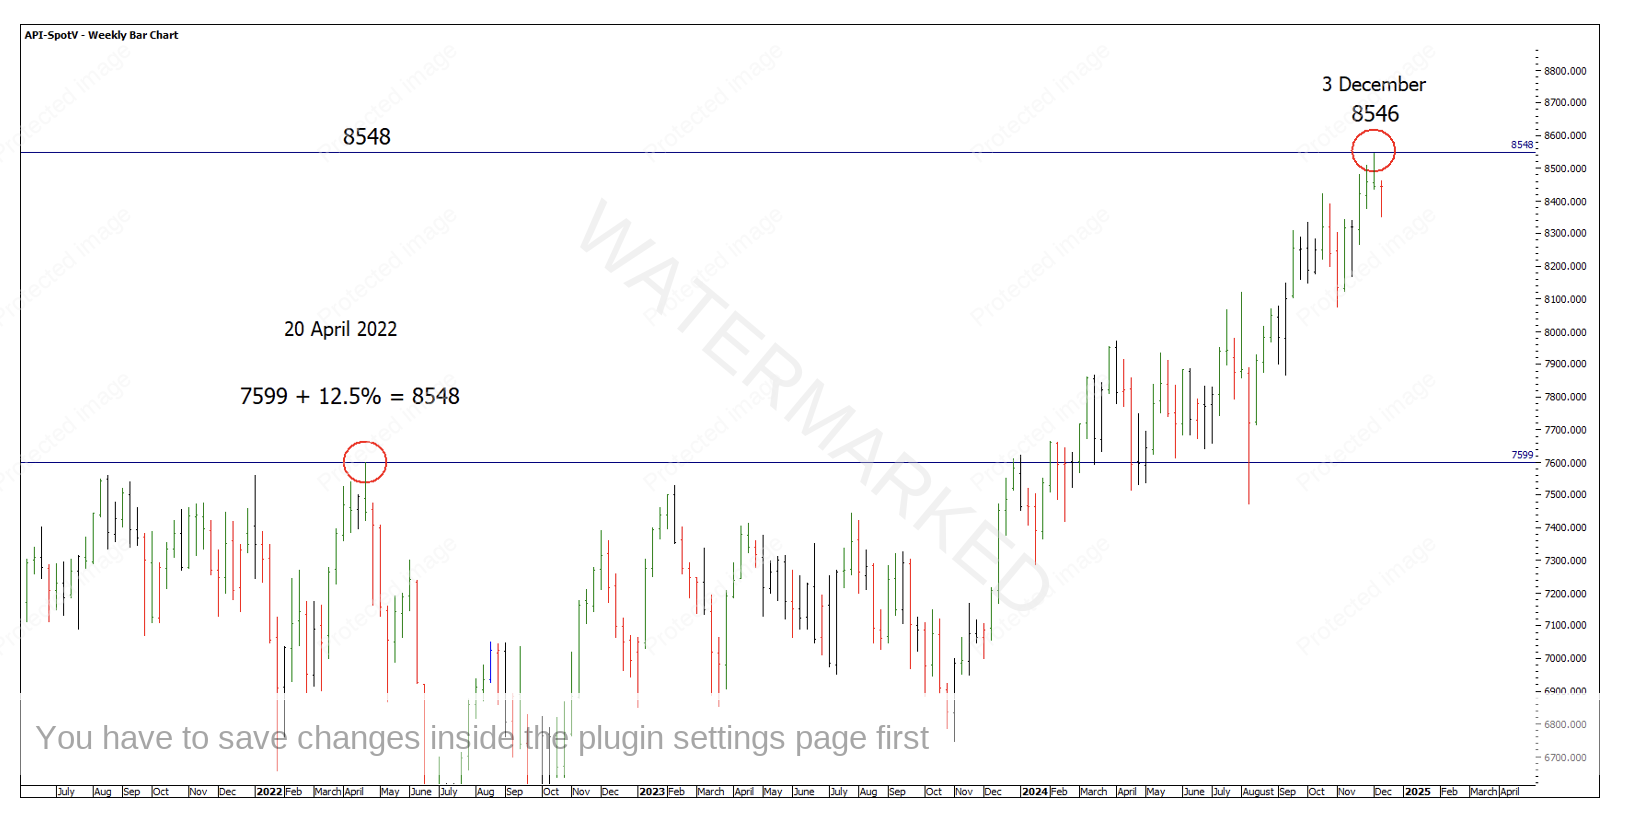
In W.D Gann’s book 45 Years in Wall Street he demonstrates years of market action and how percentages of Highs, Lows and Ranges act as support and resistance.
Here is a near perfect example, the 2022 All Time High (for that time) of 7599 plus 1/8 or 12.5% gives 8548, within 2 points of the current high at 8546!
Chart 2 – Percentage of Highs
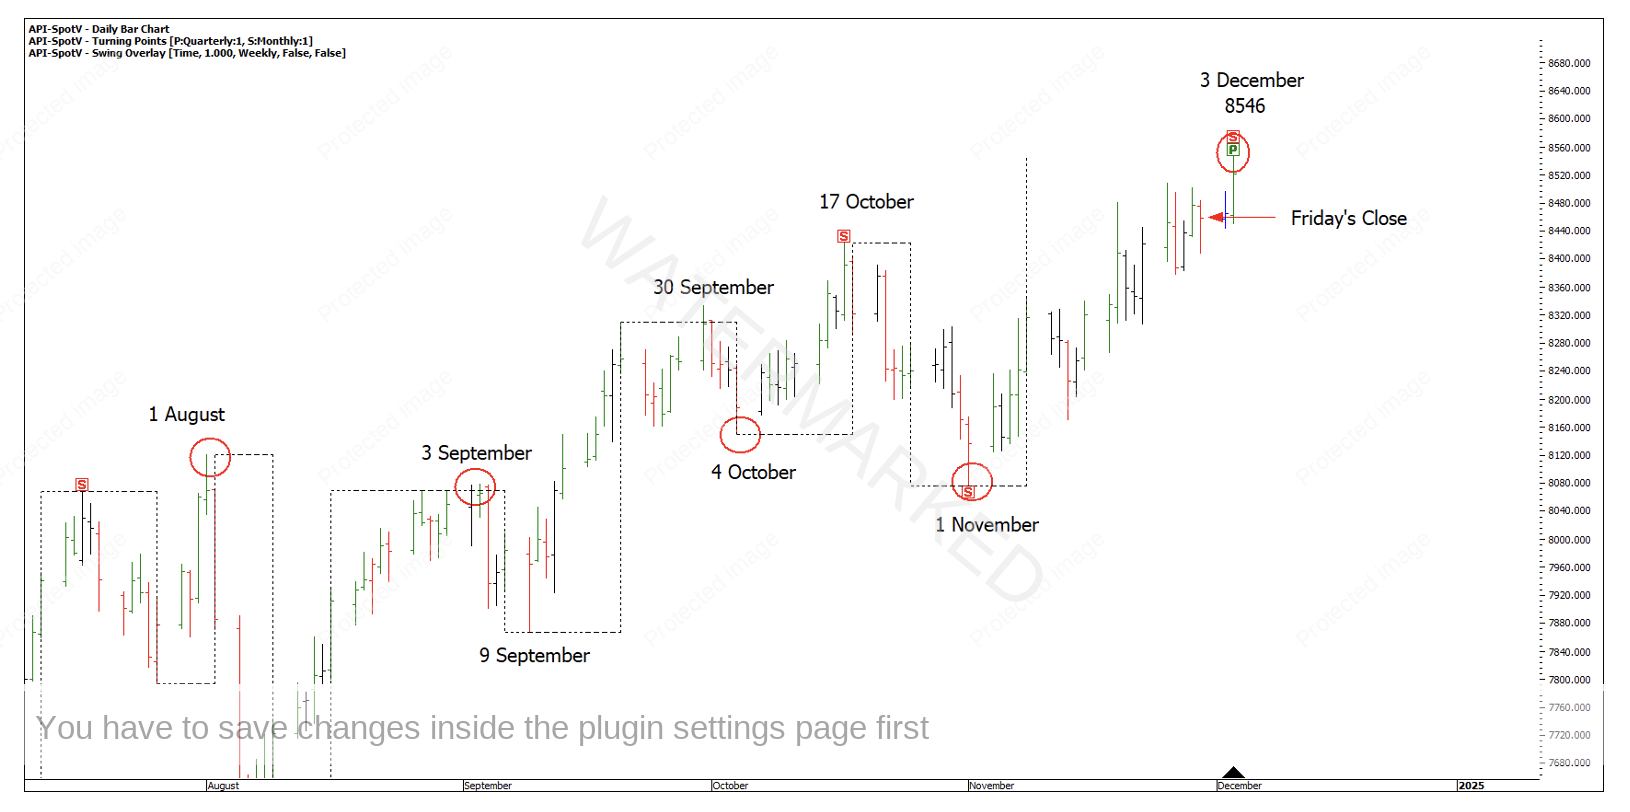
Form reading, the Friday 29 November close of the day session closed below the open and below Thursdays close. This was the first time since 1 November there was a weak Friday close pattern. This close pattern has a high probability that the market is getting ready to turn and can be easily added into your trading plan.
Chart 3 – Friday’s Close Pattern
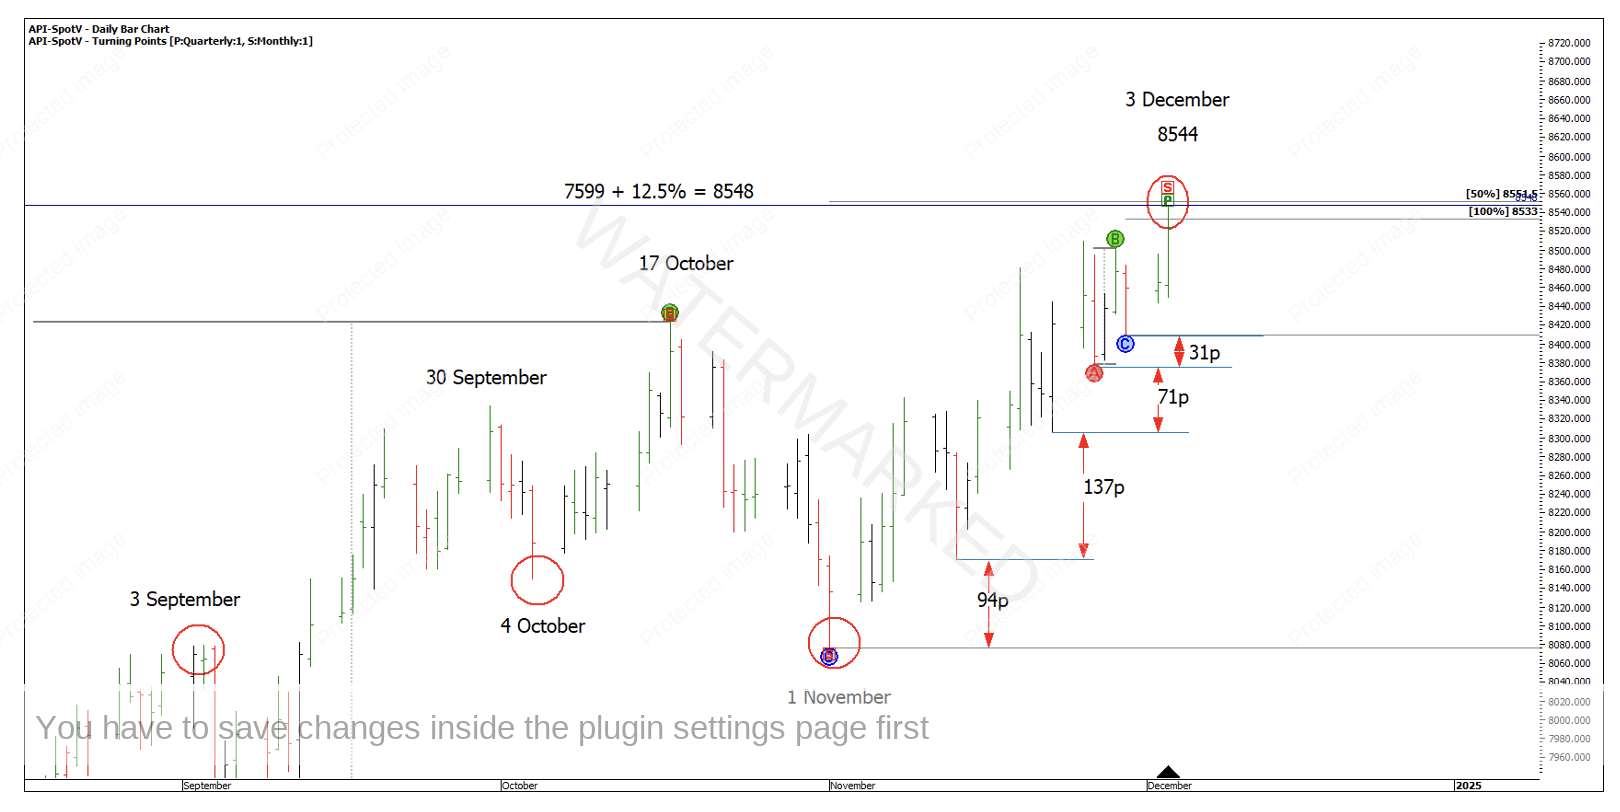
Also, late November was showing signs the market was slowing in momentum with contracting daily swing ranges to the upside. Another good illustration of this slowing momentum is seeing the distance between the swing lows reduce in point size.
Chart 4 – Form Reading
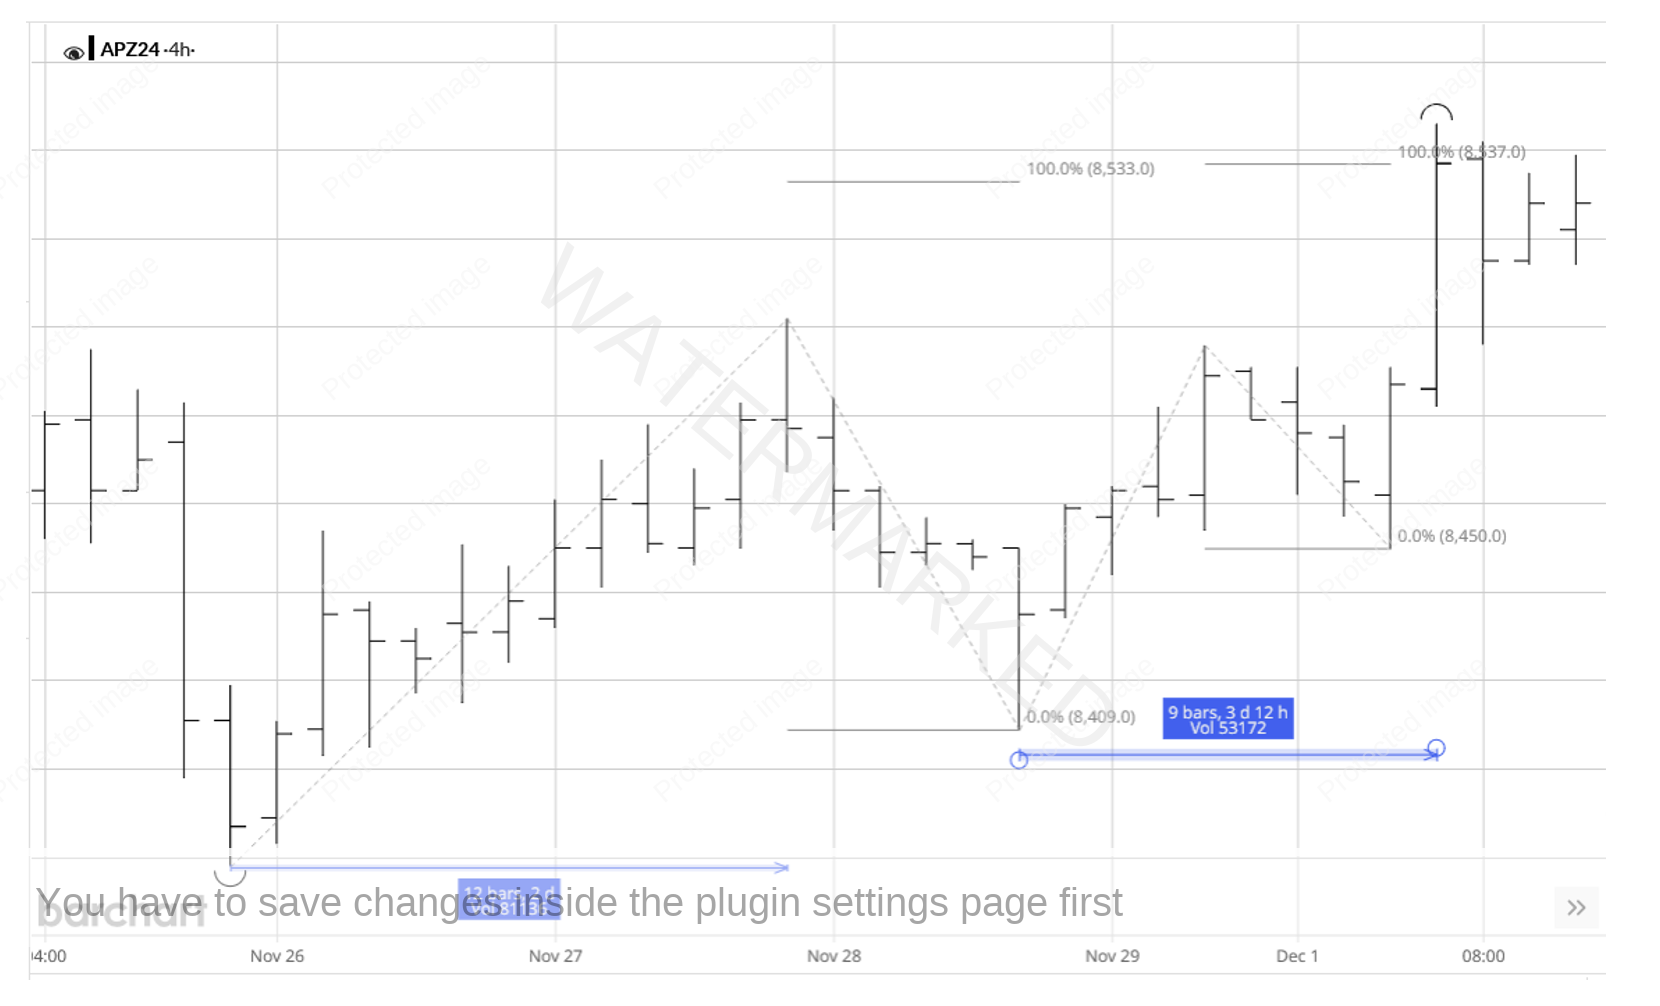
The final daily swing into the 3 December high was 13 points through a 100% repeating range with a target of 8533. Ideally you like to see less ‘lost motion’ however sometimes you have to give the market a little bit of wiggle room.
The last daily swing range up into the top was also made up of two 4-hour sections, with the second section repeating 100% into the top at 8537.
Chart 5 – 4 Hour Repeating Range
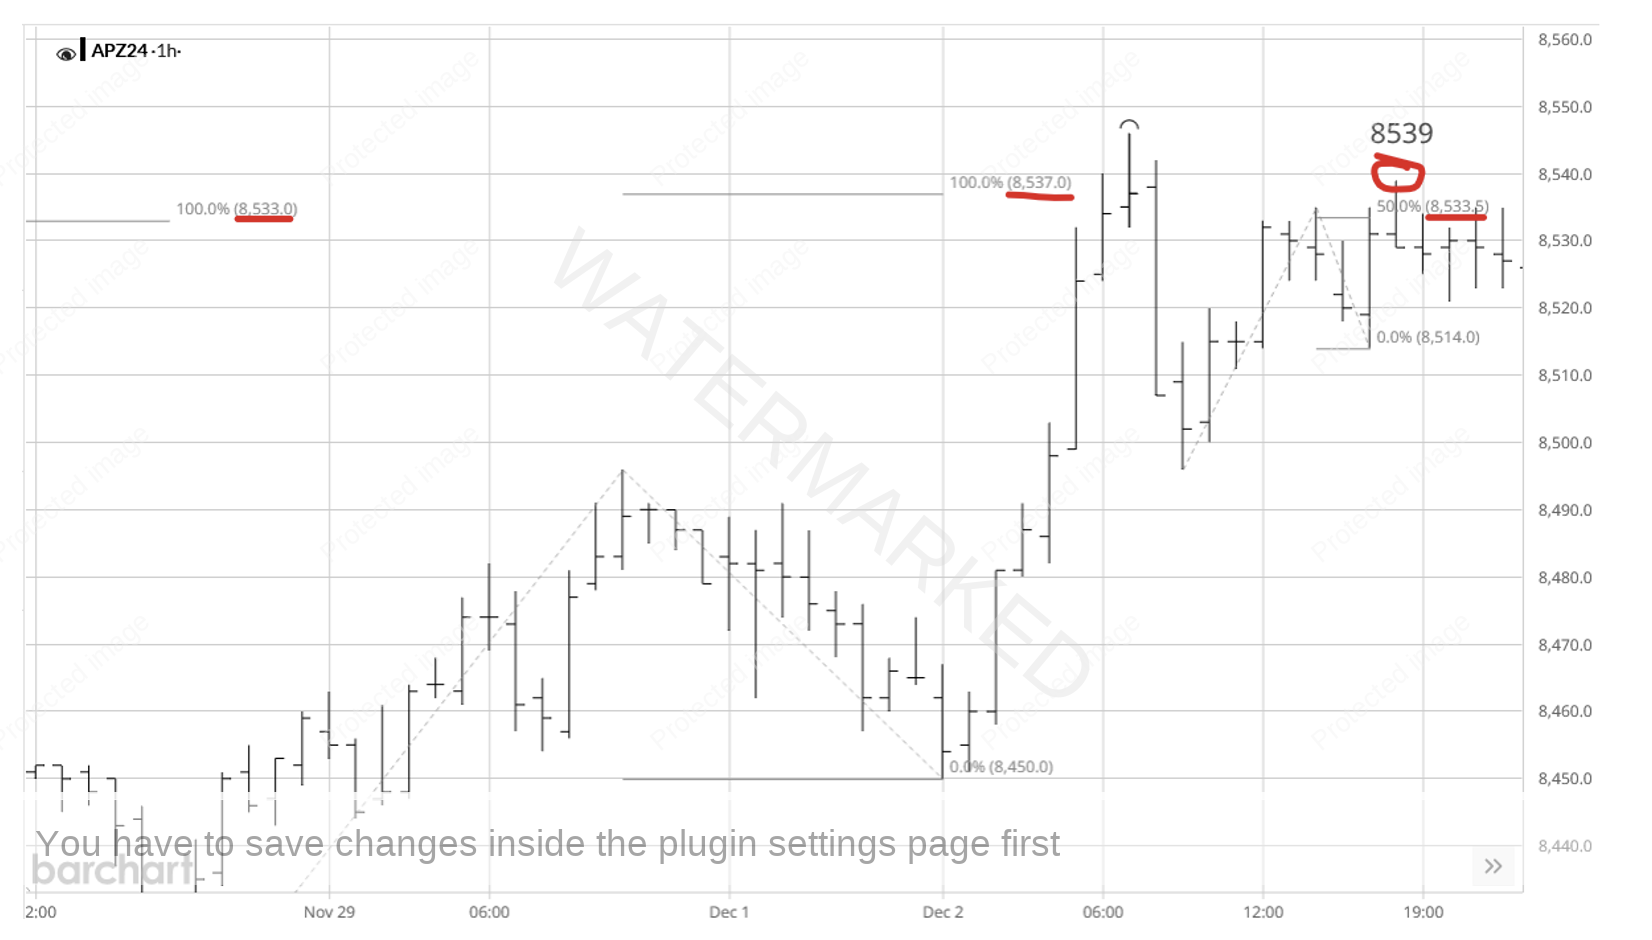
With signs of completion on the daily chart and 4 hourly chart, you can drop down to the 1 hour chart. In this instance the last 4 hourly swing was all one 1 hourly swing. However, waiting for a better entry paid dividends with a failed swing up into 8539, and a smaller risk on entry. The hourly swing high hit 8539 then gave a signal bar after retesting the 100% daily swing milestone and 100% 4-hour swing milestone from underneath.
Chart 6 – Failed 1 Hour Swing
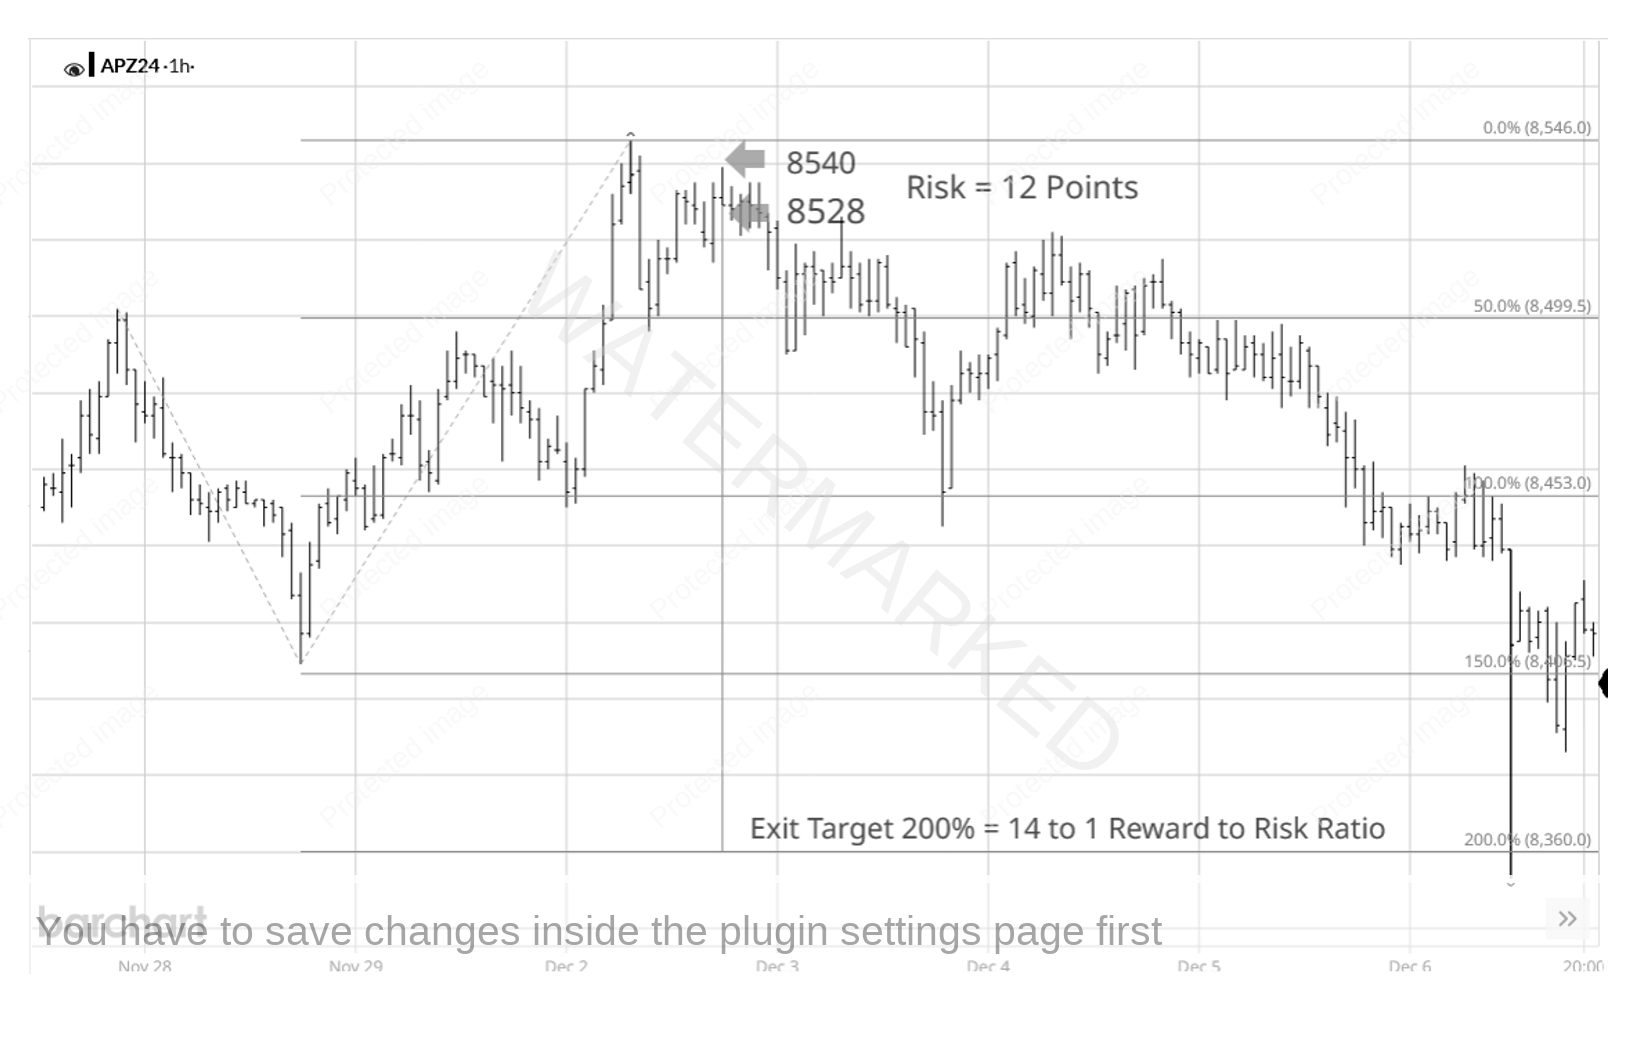
If you had entered after the failed 1-hour swing chart turned down, you could have been in with 12 points of risk. Using the last daily swing range down as a reference range, a 200% Overbalance in Price gave a target of 8360. 8528-8360 = 168 points or a 14 to 1 Reward to Risk Ratio.
Chart 7 – Reward to Risk Ratio
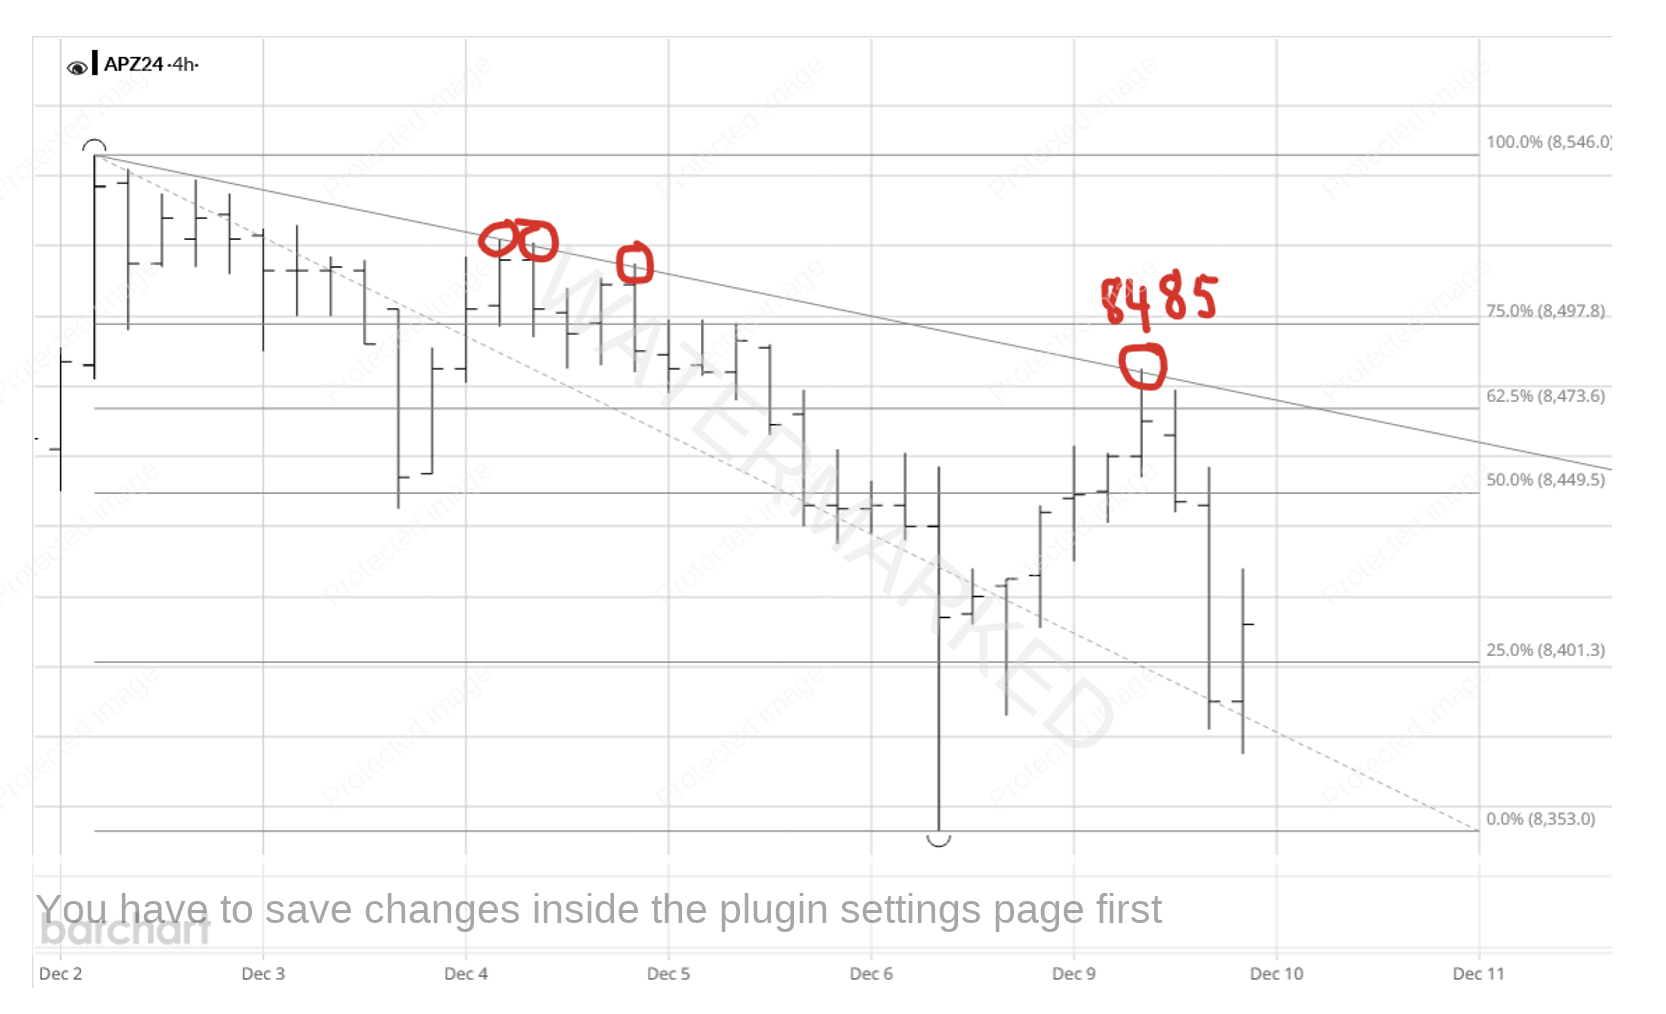
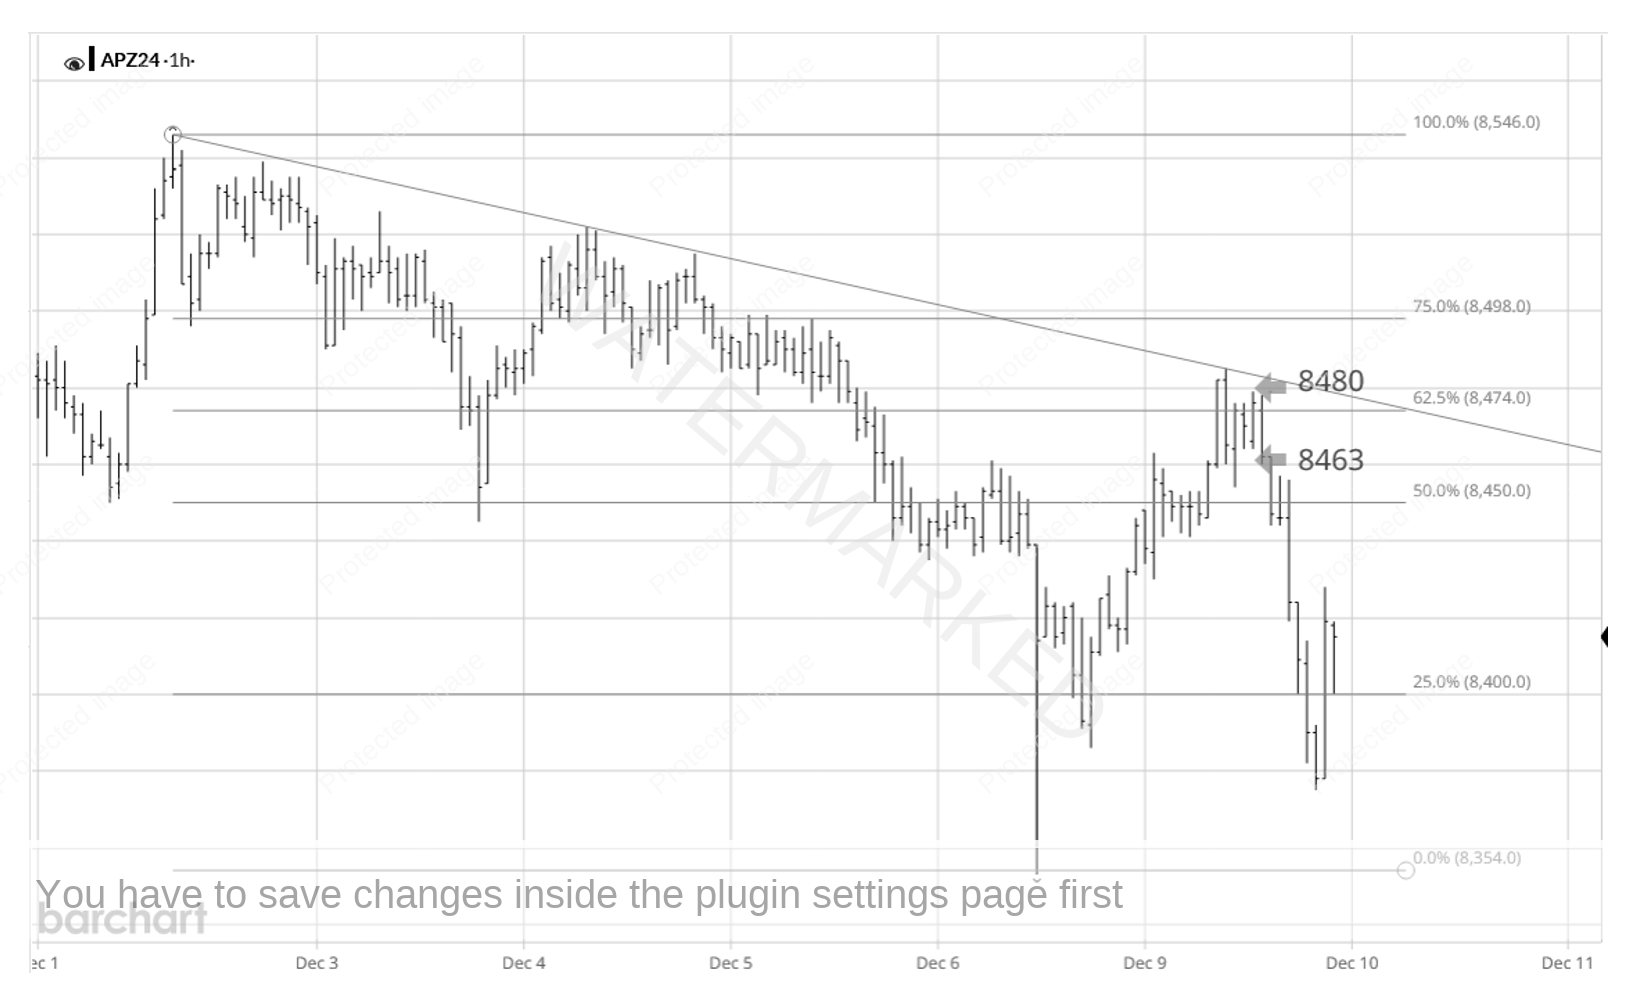
The above covers entering at the cluster and trading the daily Overbalance in Price. You can always look for another tight entry on the Daily Retest. In this instance it wasn’t quite as clean and there wasn’t a repeating or contracting 4-hour swing into the retest top at 8485, although it did find resistance at the trendline just through a 62.5% retracement.
Chart 8 – Daily Retest
If you entered on the 1 hour First Lower Swing Top at 8463 and a stop at 8480, you have 17 points of risk and could well have this trade at break even and now let the market unfold. With a 14 to 1 on the first trade, even a 6 to 1 gets you to 20 to 1 over two trades!
Chart 9 – Retest Entry
Using David’s final lesson from the Master Forecasting Course, there looks to be some big moves on the cards for 2025.
I’m excited for all that’s to come next year and look forward to hearing many more amazing stories from SITM students of their best trades yet. I wish everyone a very Merry Christmas and a safe and happy New Year!
Happy Trading,
Gus Hingeley
