A Step Back in Time… and Price
Chart 1 below shows the monthly bar chart of the Dow Jones (INDU) at the time.
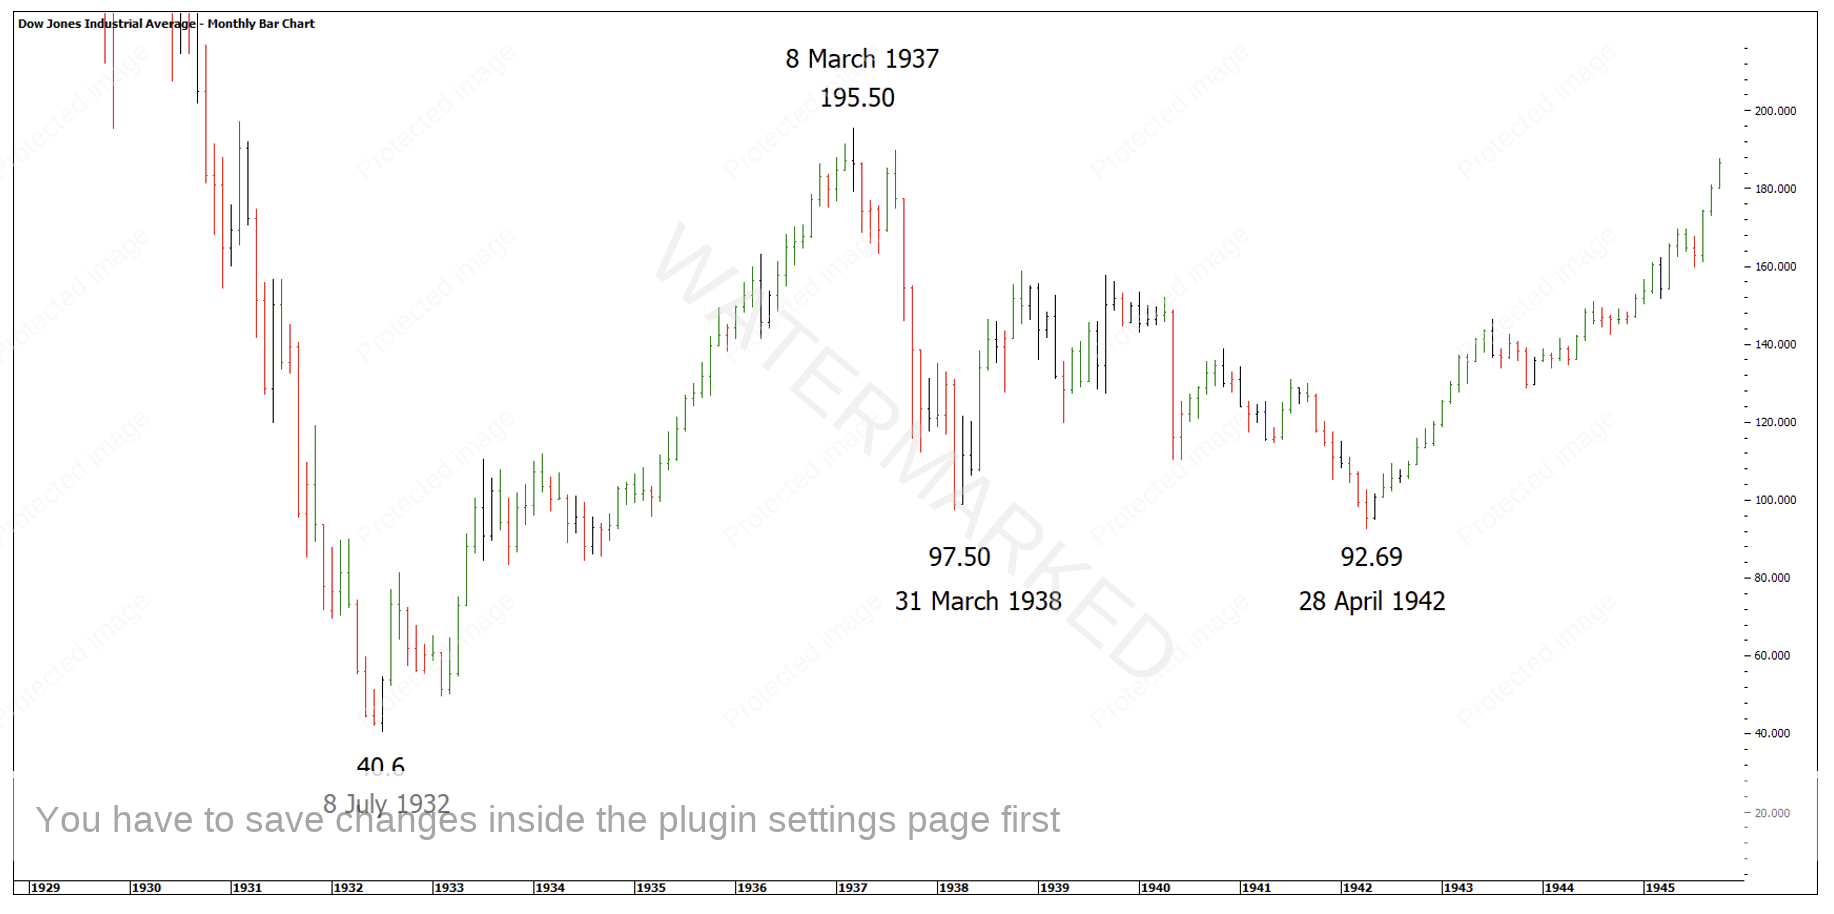
Chart 1 – Dow Jones
This setup that W.D Gann talks about isn’t described on one page, he spreads the message across a few.
“We apply the same rule and subtract 50% from 195.50 which gives 97.75 as a support and buying level. 1938, March 31 the Averages made low at 97.50 and another Bull Market started”.
P36, 45 Years in Wall Street
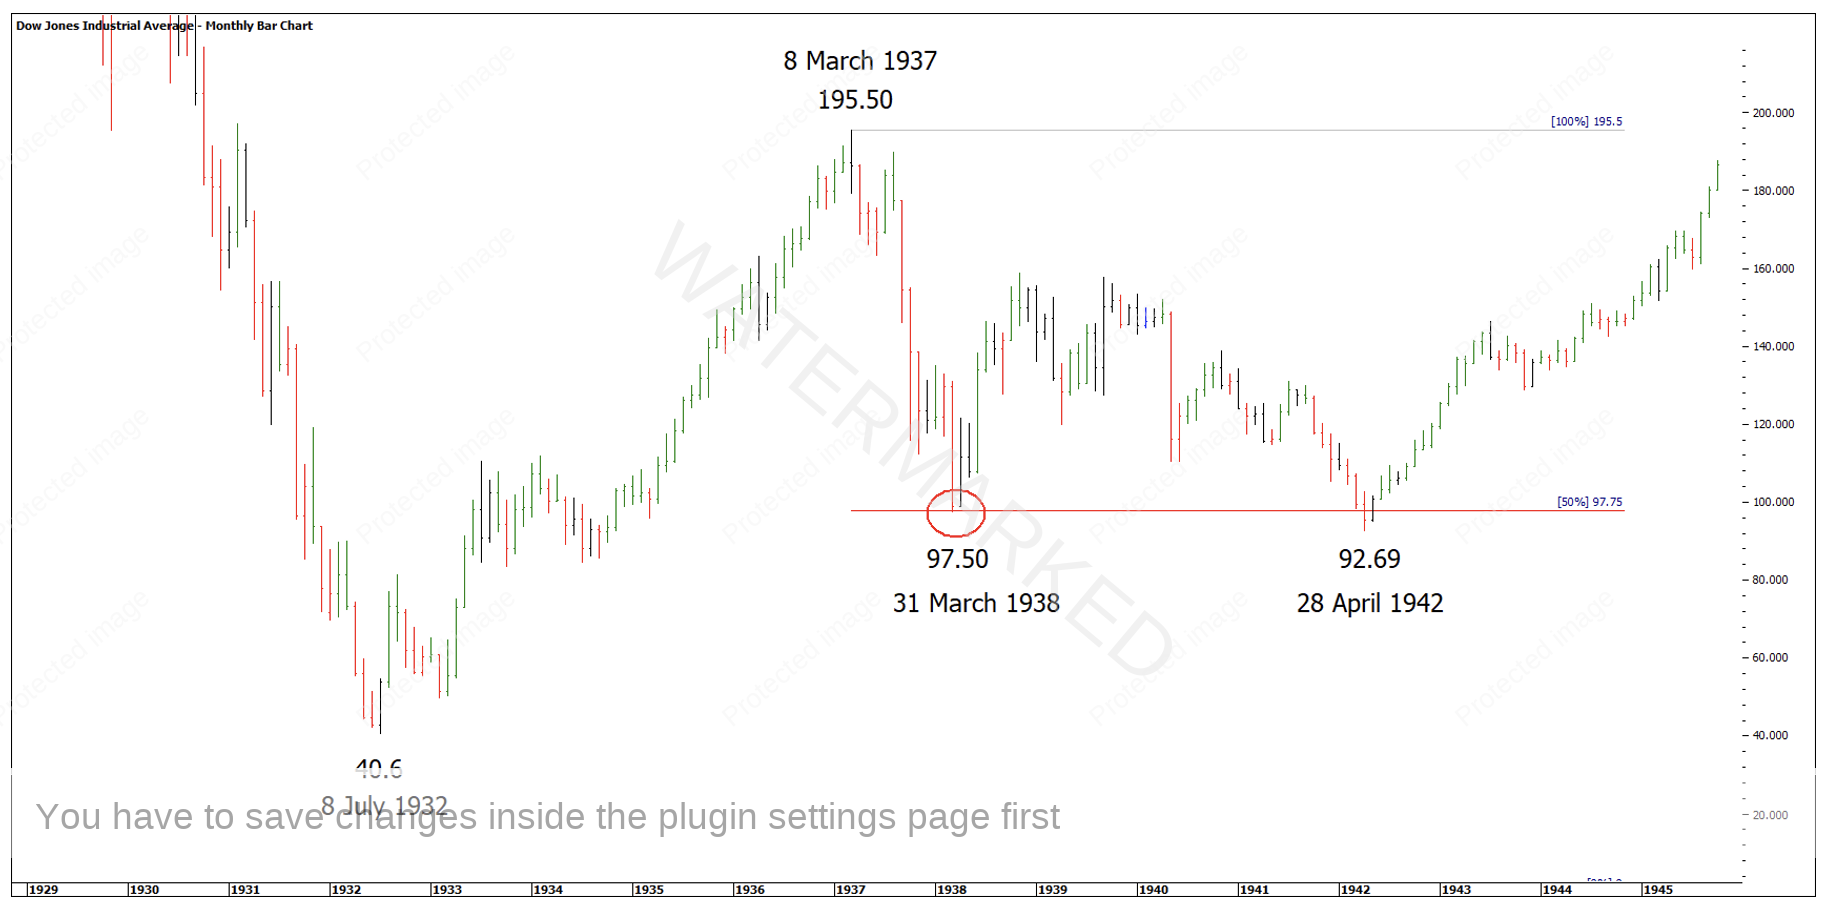
Chart 2 – 50% of a Major High
“1942, April 28, low 92.69. This was less than 5 points under the low of 1938 and was a buying point as this was a Triple Bottom, which was confirmed by the 3-Day Chart and the 9-Point Swing Chart. It was a place to buy stocks for a big Bull Market”.
P36, 45 Years in Wall Street
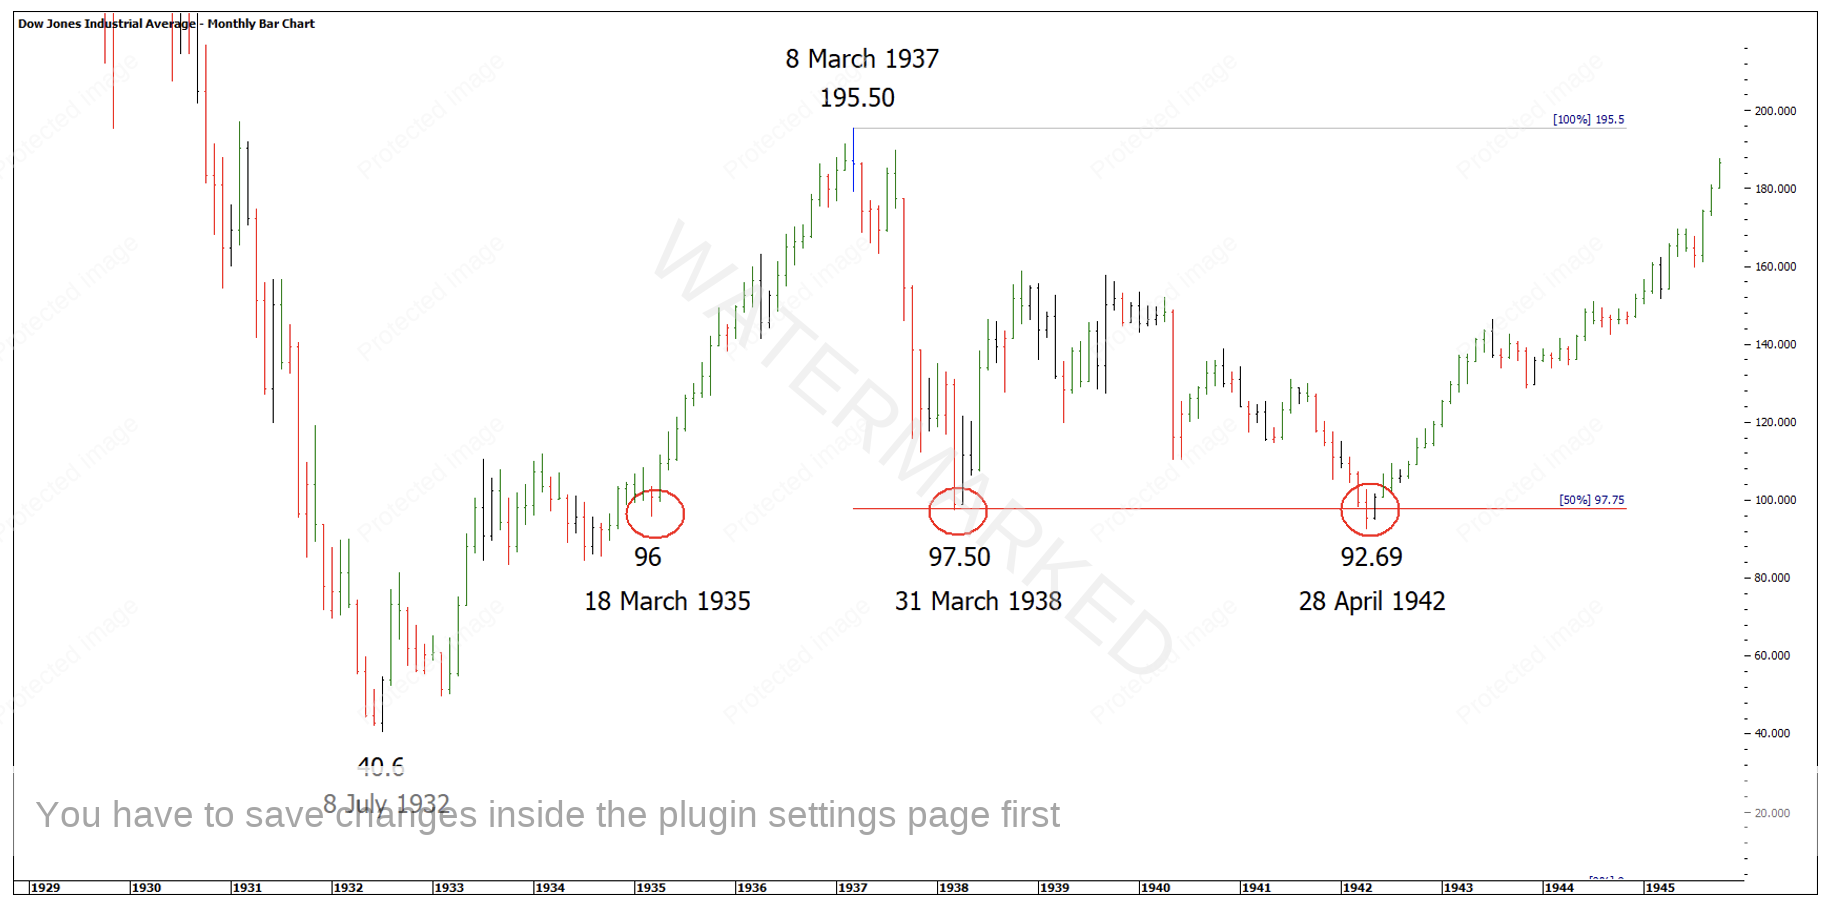
Chart 3 – Double Bottoms on 50%
“1942, April 28, low 92.69. From March 31, 1938 the time was 49 months.
The low on March 31, 1938 was 97.50 The low on March 18, 1935 was 96. Therefore, at this time the averages failed to go five points under the Old Bottom and made this a buying level which was confirmed in a short period of time by the three-day chart”
P52, 45 Years in Wall Street
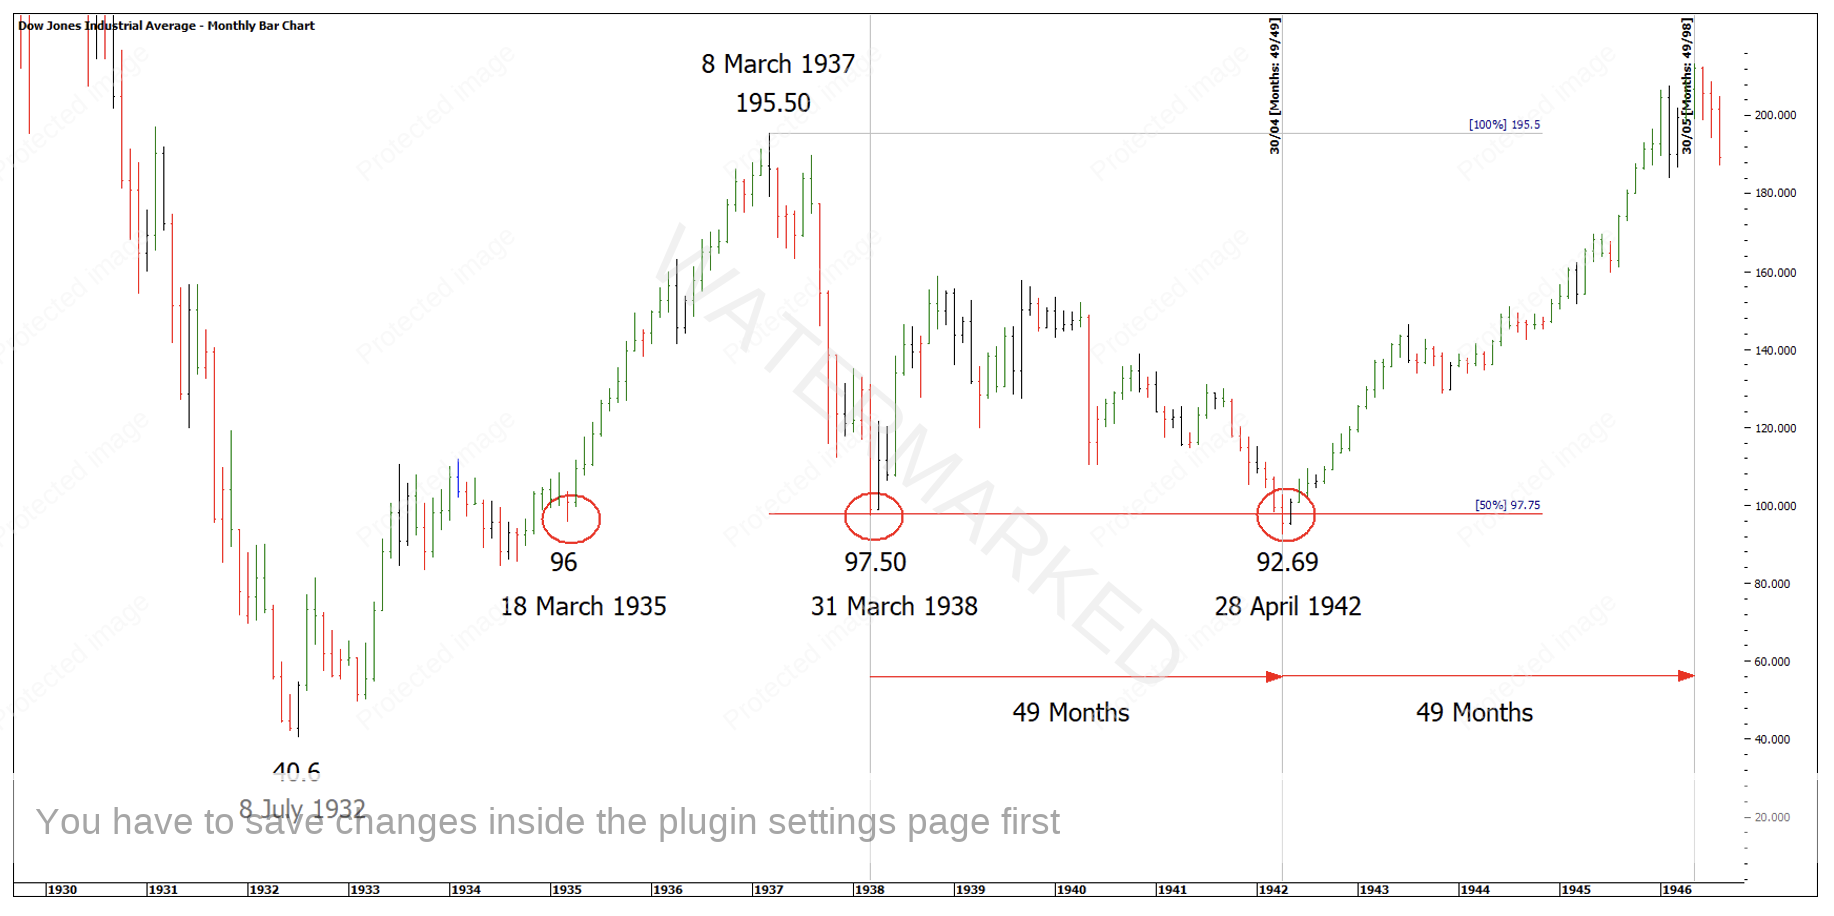
Chart 4 – 49 Months Low to Low
In April, 1942, stocks had been declining from the extreme high of March 10, 1937 and were down over 5 years, running out a long time cycle. Therefore, when prices broke these old levels, and failed to go 5 points lower, you would buy stocks figuring the trend was getting ready to change.
P62. 45 Years in Wall Street
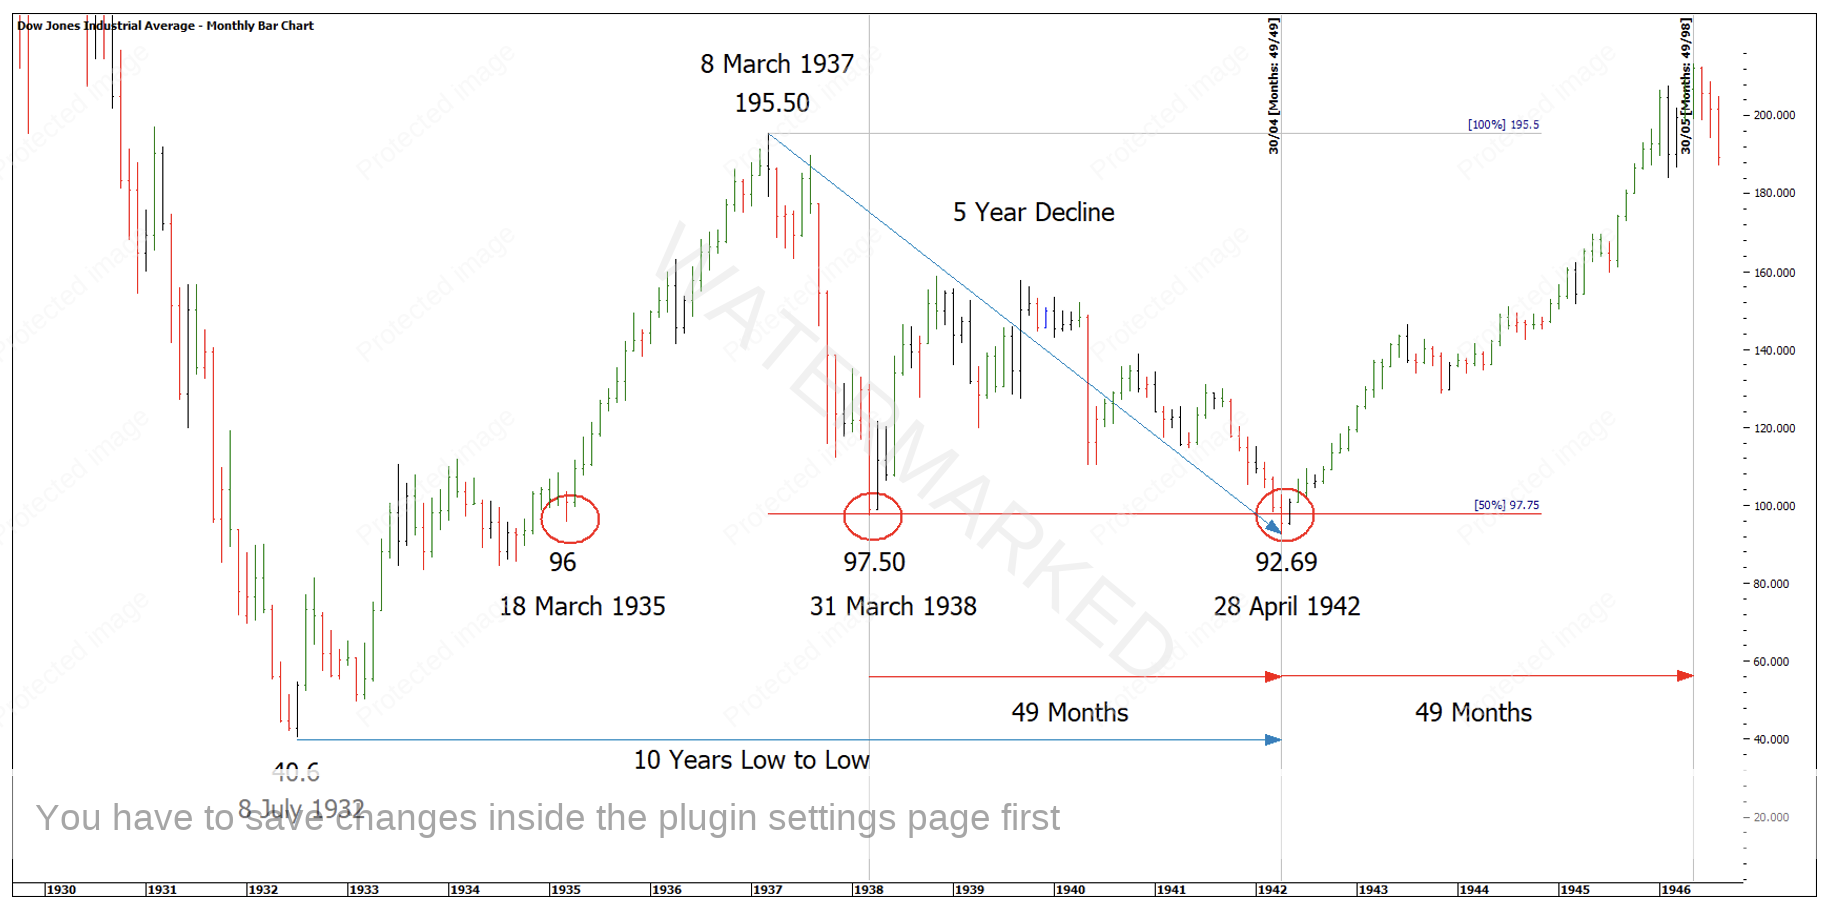
Chart 5 – 5 Year Decline
I think it’s also important to note there was more price harmony down at the 92.69 low as you can see in Chart 6 below.
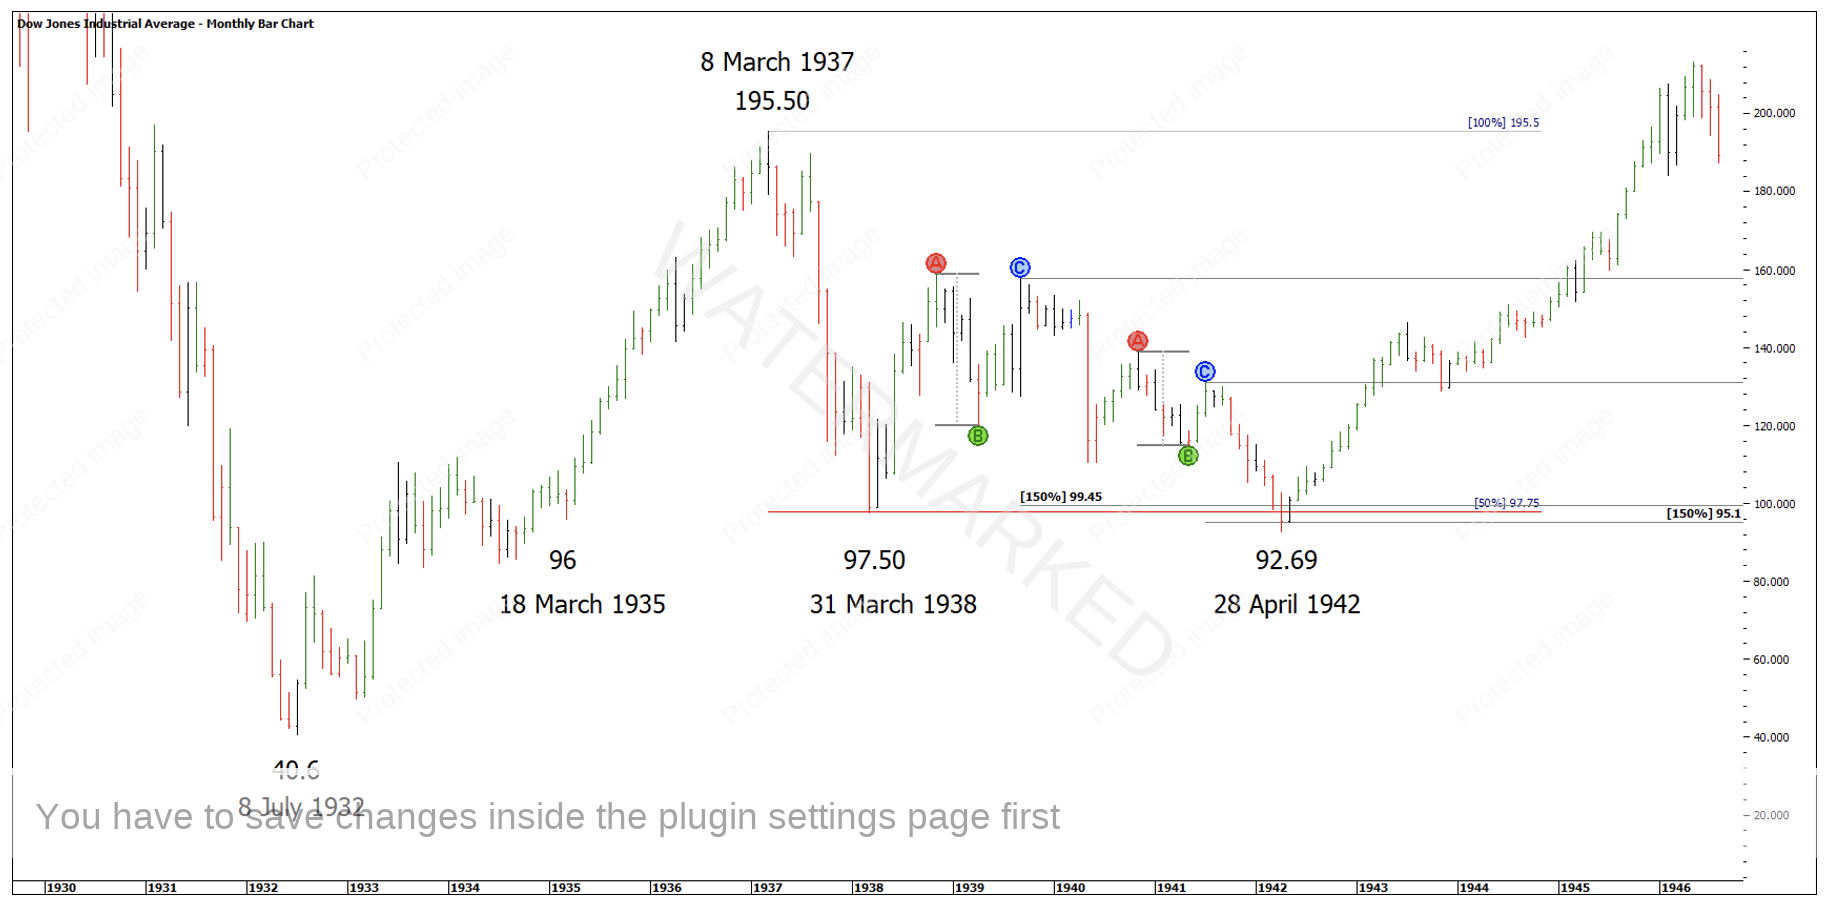
Chart 6 – Price Cluster
A recap of this setup:
- A false break Double Bottom
- 50% Resistance Level of a Major high
- 49 Months between Double Bottoms
- 5 Years down from the 8 March 1937 high
- 10 Years from the 8 July 1932 low
Although Gann doesn’t say just watch a combination of 49 months and 5 years. He says;
“Always check to see if the market is exactly 1,2,3, 4 or 5 years from any extreme High or Low price. Check back to see if the Time Period is 15, 22, 34, 42, 48 or 49 months from any extreme or low price as these are important time periods to watch for a Change in Trend”
P13, 45 Years in Wall Street
A more recent example of this type of setup is on an Australian stock, Bank of Queensland, ‘BOQ’ in ProfitSource, that called the 22 April 2020 low at $4.38.
- Support on 75% of the All-Time High price
- 5 Year decline from 19 March 2015 high to 22 April 2020 low
- Low to low time frame of 42 months
- The market then more than doubled in price.
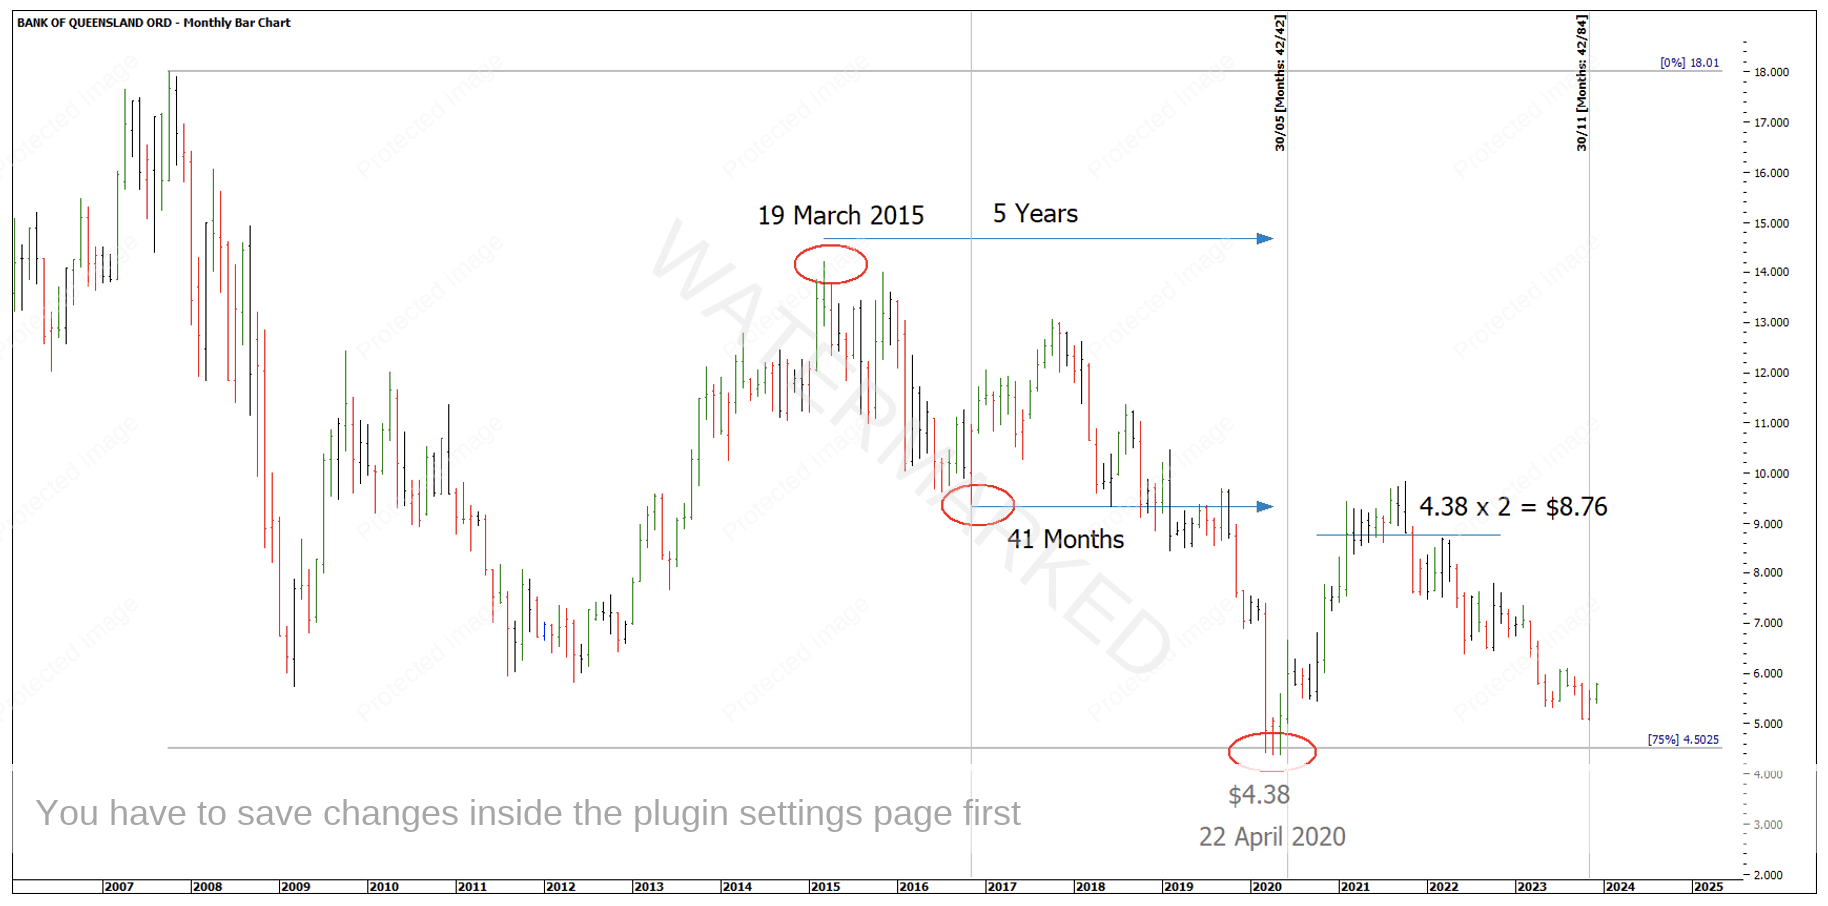
Chart 7 – Bank of Queensland
This setup is a great trading plan, but also a great investment plan for the time poor trader. Buying and holding independent stocks in this position could be another way to profit from the big moves without exposure to the risk of gaps or incurring on going CFD holding costs.
I can highly recommend printing out a monthly bar chart of the Dow Jones and marking up the chart as WD Gann walks you through years of the Dow in action, as if he’s there in the room with you.
Wishing everyone a very happy and safe Christmas and New Year. I’m really looking forward to what 2024 has in store for the traders and investors alike seeking to walk their own path!
Happy Trading,
Gus Hingeley