A Walk Down History Lane
Charles Darwin
At the start of my January 2020 Platinum Article’s I made the opening statement; “2020 is going to be an opportunistic one!” and it sure hasn’t let us down. There has been a lot of change happening at present, May Oil futures crashing to zero, isolation requirements and global slowdowns. The decisions you made yesterday will likely be different to the decisions you make today due to the fast-changing environment. Though, this does not mean you have to buy into the hysteria that is being portrayed at present.
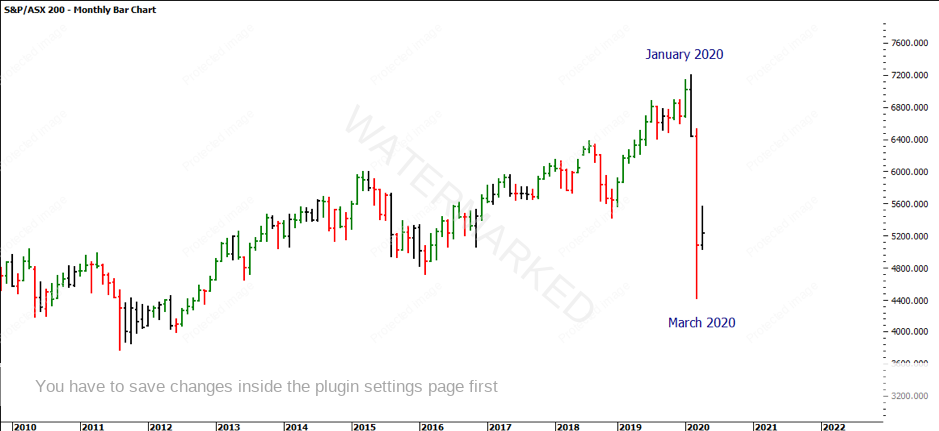
The Coronavirus Disease 2019 (COVID-19) outbreak in Wuhan China seems to have brought the year to what the media report as an unexpected crash. The basis of the Gann methodology states that:
W.D. Gann
With the following in mind, let’s take a deeper dive down history lane. 100 years ago, the Spanish flu pandemic, which swept the globe in a series of waves from 1918 to 1920, was one of the deadliest infectious disease outbreaks in known history. For those of you who have W.D. Gann’s Master Stock Market Course, Gann writes about this period of the market, and a well-tuned cycle of 100 years is a well-deserved read.
Back in 1918 when the Spanish Flu pandemic hit the Australian shores, the government acted swiftly by quarantining all overseas arrivals including those returning from their war efforts in World War 1. They also closed places where the public would gather including schools, churches, theatres, restaurants and hotels and cancelled sporting games. Major events such as the Sydney Royal Easter Show were cancelled, and war victory celebrations were postponed to avoid people congregating in large groups. The public swarmed the shops and panic buying began with shoppers grabbed everything they could from the shelves. They wore facemasks in an attempt to protect themselves and those infected were isolated with the worst cases hospitalised. This is exactly what we are seeing now!
The result of this in 1918 was that there were massive economic and social hardships and disruptions globally. 40% of the Australian population caught the virus, and close to 15,000 Australians died, which equated to around 0.29% of the total population. This was much lower than the rest of the world. The difference today of course is that we have much better healthcare systems, we are far more mobile, and our communication moves very quickly due to the internet. Looking at how quickly news spreads, it creates a lot more fear, anxiety and hysteria than it did back in 1918, yet the Spanish Flu spread just as quickly.
When the dust settled, Australia was looked at as a safe haven country and set to become the lucky country again. Australia is often looked at as a safe haven during times of international strife or recession. We have location, which is great for exports to Asia and in particular China. We have an abundance of natural resources, stable governance and a stable economic outlook.
At present, Australia & New Zealand are already showing signs of recovery, with less than 7,000 infected, less than 100 deaths and a recovery rate of over 80% of the infected. Yes, we will likely see more cases and death, but compared to the rest of the world, we are very safe and going to be looked at as a safe haven by the rest of the world – which ultimately will increase immigration in the mid to long term.
While Gann wrote about the 100-year cycle, if we turn to the Chinese Zodiac, 2020 is a year of the Rat, starting from January 25th, 2020 and lasting until February 11th, 2021. The Year of the Rat is the first zodiac sign in the Chinese Zodiac cycle. The Chinese Zodiac is associated with traditional Chinese chronology — a 60-year calendrical cycle, which is the combination of the 12 Earthly Branches (12 terms corresponding to 12 animals, months, and hours) and the 10 Heavenly Stems. A Rat year occurs every 12 years, which, looking at hindsight 12 years ago was 2008.
By using history as a guide, we can explore the previous crashes that have occurred and use hindsight to guide us. David said that hindsight looked at often enough can become foresight.
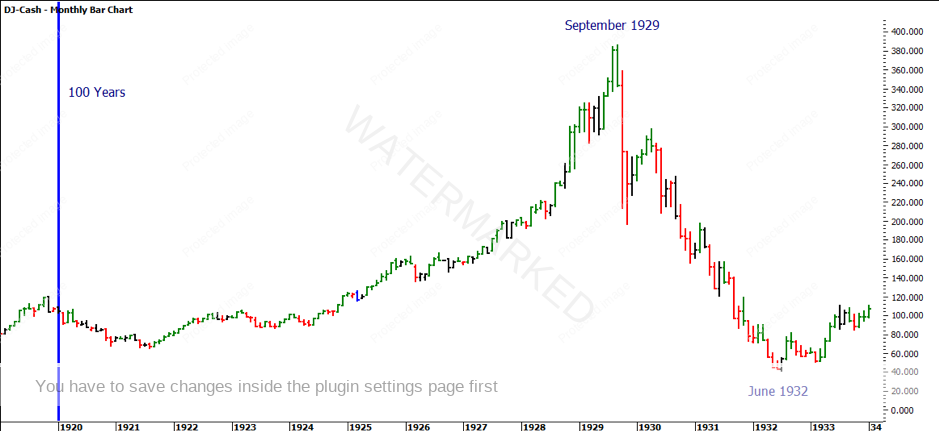
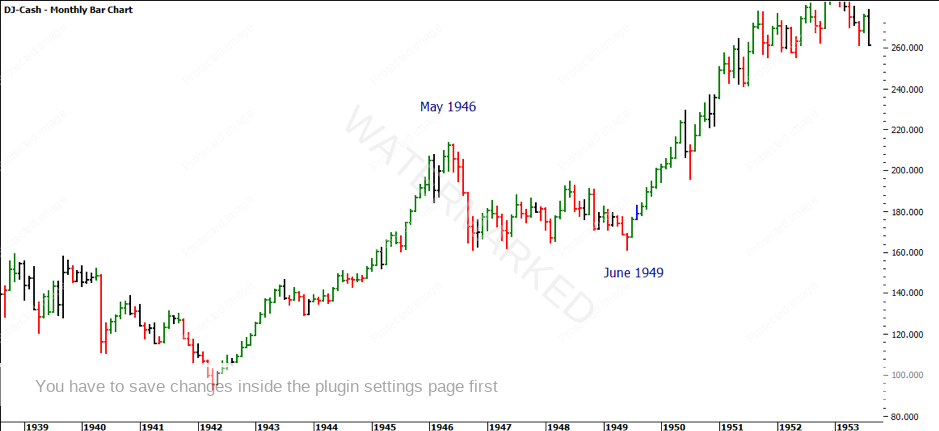
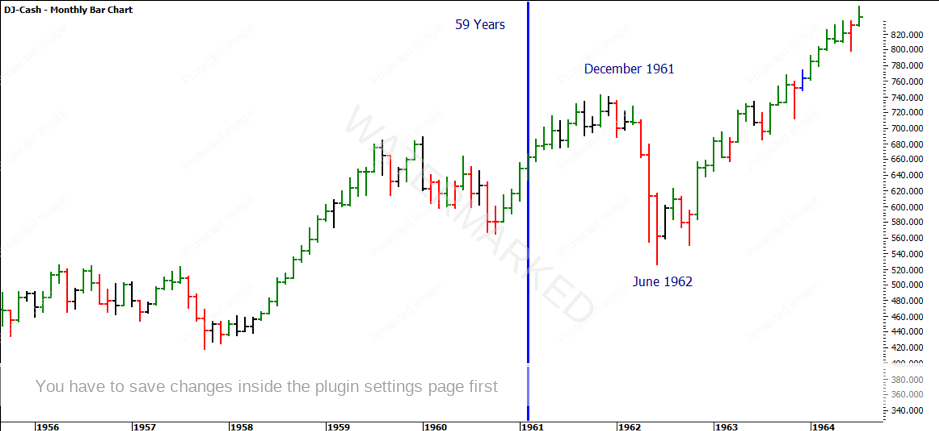
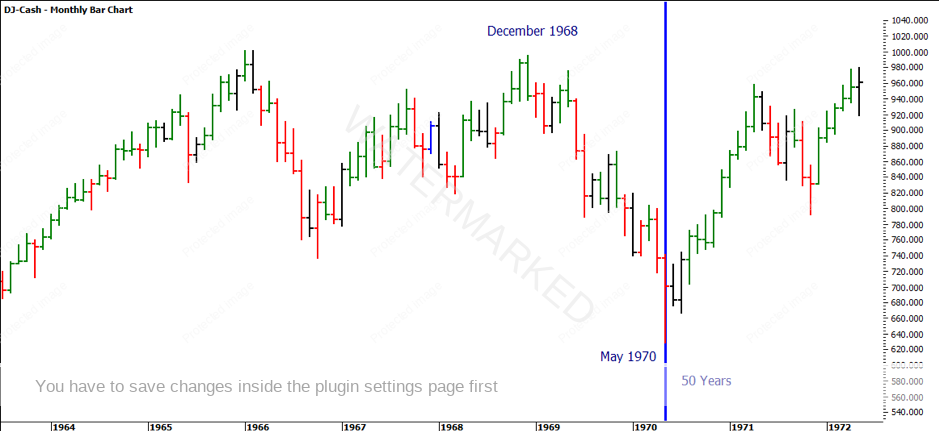
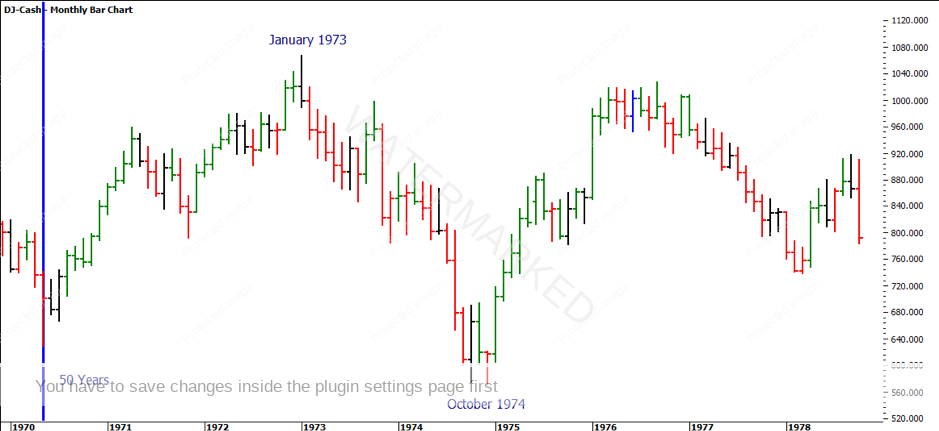
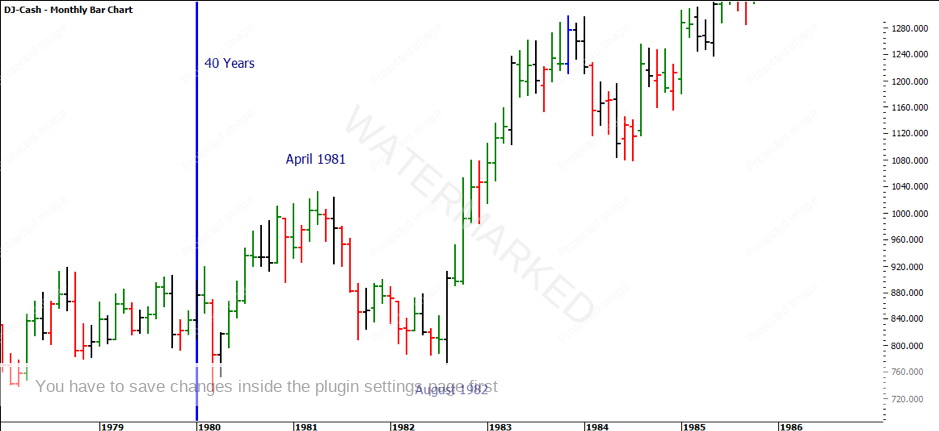
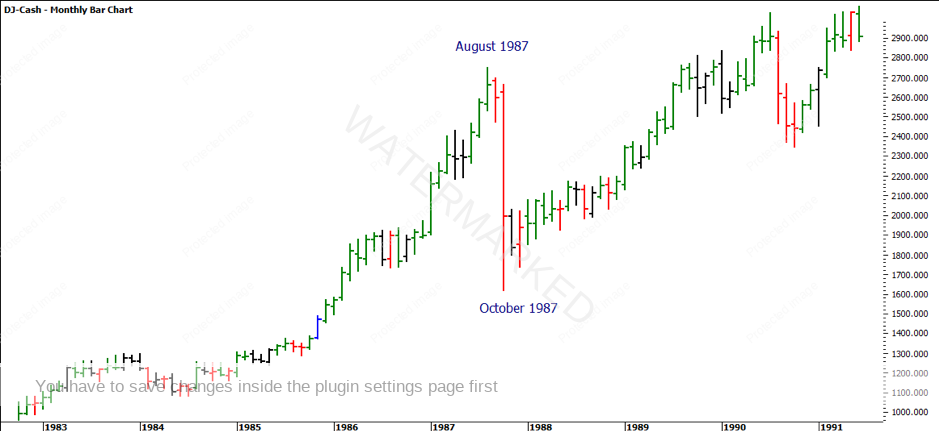
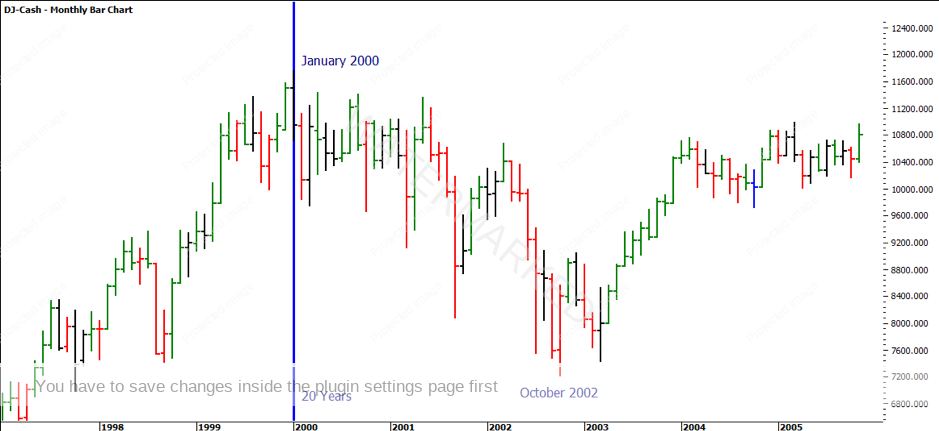
A bear market is often referred to when stock prices fall for a sustained period, dropping at least 20% from their peak. The charts below are using the Dow Jones Industrial Average. The code in ProfitSource is DJ-Cash.
The Great Depression
| Period | September 1929 - June 1932 |
| S&P500 Loss | -86.1% |
| Dow Jones Loss | -89.4% |
| Duration | 34 months |
| Cycle from 2020 | 90 years |
Inventory Recession
| Period | May 1946 - June 1949 |
| S&P500 Loss | -29.6% |
| Dow Jones Loss | -24.7% |
| Duration | 37 months |
| Cycle from 2020 | 74 years |
Bay of Pigs Attack & Cold War Speculation
| Period | December 1961 - June 1962 |
| S&P500 Loss | -28.0% |
| Dow Jones Loss | -29.3% |
| Duration | 6 months |
| Cycle from 2020 | 59 years |
Vietnam War Tension
| Period | December 1968 - May 1970 |
| S&P500 Loss | -36.1% |
| Dow Jones Loss | -30.0% |
| Duration | 18 months |
| Cycle from 2020 | 50 years |
Arab Oil Embargo & Watergate Scandal
| Period | January 1973 - October 1974 |
| S&P500 Loss | -48.0% |
| Dow Jones Loss | -46.5% |
| Duration | 21 months |
| Cycle from 2020 | 46 years |
Sustained Inflation
| Period | April 1981 - August 1982 |
| S&P500 Loss | -27.8% |
| Dow Jones Loss | -24.3% |
| XJO Loss | -40.6% |
| Duration | 21 months |
| Cycle from 2020 | 40 years |
Black Friday
| Period | August 1987 - October 1987 |
| S&P500 Loss | -35.5% |
| Dow Jones Loss | -41.1% |
| XJO Loss | -50.3% |
| Duration | 3 months |
| Cycle from 2020 | 33 years |
Tech Bubble
| Period | January 2000 - October 2002 |
| S&P500 Loss | -49.1% |
| Dow Jones Loss | -38.7% |
| XJO Loss | -23.1% |
| Duration | 30 months |
| Cycle from 2020 | 20 years |
Global Financial Credit Crisis
| Period Loss | October 2007 - March 2009 |
| S&P500 Loss | -56.4% |
| Dow Jones Loss | -54.4% |
| XJO Loss | -54.4% |
| Duration | 17 months |
| Cycle from 2020 | 12 years |
COVID-19
| Period | January 2020 - March 2020 |
| S&P500 Loss | -32.6% |
| Dow Jones Loss | -36.0% |
| XJO Loss | -33.1% |
| Duration | Currently 3 months |
In terms of price, the average decline on the S&P500 was -47.68%. If we’d expect the average to repeat, we could potentially see the market drop another 15.07%. Though the Great Depression in 1929 was largely an outlier, so if not included in the data sample the average decline was 42.88%. Assuming we were expecting things to play to the average, we could see the market drop another 10.27% before we see a major low form.
In terms of time, the average duration of these nine crashes is 20.7 months. Assuming the COVID-19 crash started when the market dropped -36% in February 2020, we can likely expect that on average, the projected duration from February will be September 2021.
“Everything has a major and a minor [cycle], and in order to be accurate in forecasting the future, you must know the major cycle, as the most money is made when extreme fluctuations occur.”
He goes on to say:
“The major cycle of stocks occurs every 49 to 50 years. A period of “jubilee” years of extreme high or low prices, lasting from 5 to 7 years occur at the end of the 50-year cycle.”
Fast-forwarding to 2020, we have experienced rapid growth in the stock market from 2012 to 2020. 50 years ago, this was ended with a ‘mild’ recession, which is what we may experience this year. The reason I say ‘mild’ is because it wasn’t a deep depression like the 1929 Great Recession. While I don’t have political or central bank experience, based on history the likelihood of getting out of this mess will likely be the raising of interest rates which will send inflation high. The US election will take place in the 4th Quarter of 2020 and it will be interesting to see how things unfold in the lead up to that.
In closing, I will finish with one of Gann’s statements and that is:
“That the purpose in trading is not to pick exact highs and lows. The purpose is to make money. Always have a plan. The opportunities are many in the markets, and you will miss many. But do not worry or fret about missing an opportunity, as another will be along shortly.
Trade from a plan and do not react to the markets. Knowledge, discipline, courage and hard work are the requirements of skilful trading.”
It’s Your Perception,
Robert Steer
