A Westpac Trade
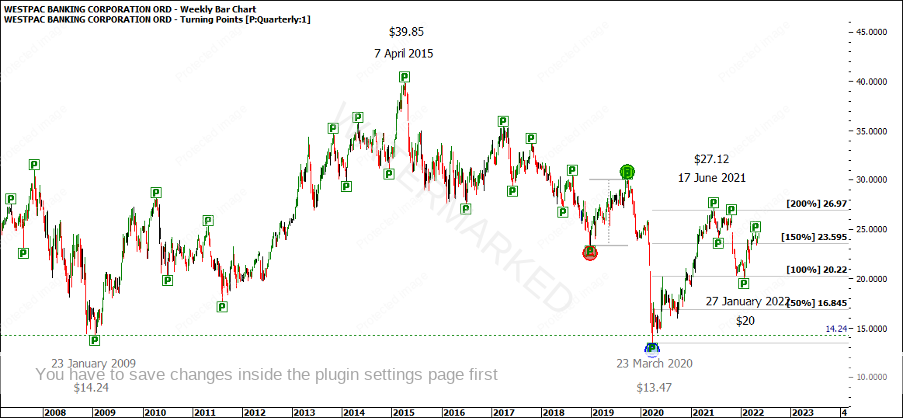
On 23 March 2020, Westpac made big double bottoms 11 years and 2 months apart. Out of a cluster we can expect to see an overbalance in price as an indication the trend has changed. The run up into 17 June 2021 was a near perfect 200% overbalance in price on the quarterly swing chart.
Chart 1 – Westpac Double Bottoms
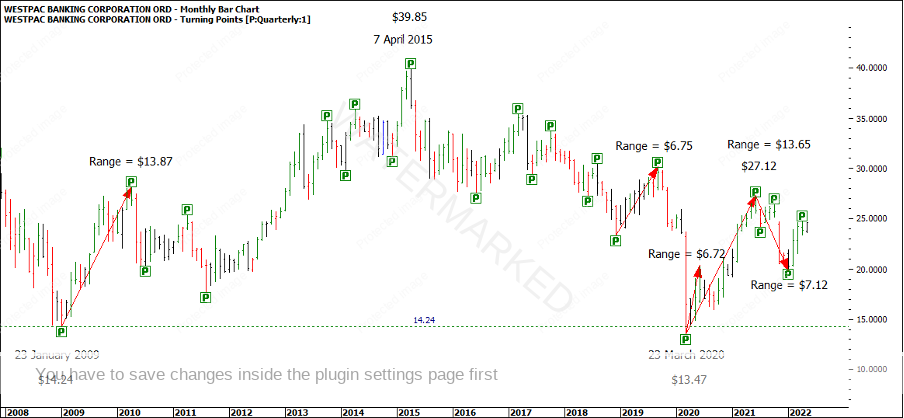
The last quarterly swing range up prior to the 23 March 2020 low was a range of $6.75. This would be considered a ‘Prime Number’. If you would like to read more on this topic, head to Section 11 – Price Forecasting from The Number One Trading Plan.
I think it’s fascinating to see how the ranges and the high and low prices relate. Looking at the chart below, you can see how $6.75 or multiples of it show up in more than one range.
Chart 2 – Harmony of Numbers
The $13.47 low is very close to two multiples of $6.75 (6.75 x 2 = $13.50), also two multiples of $13.47 = $26.94 which called the end of the quarterly first range out.
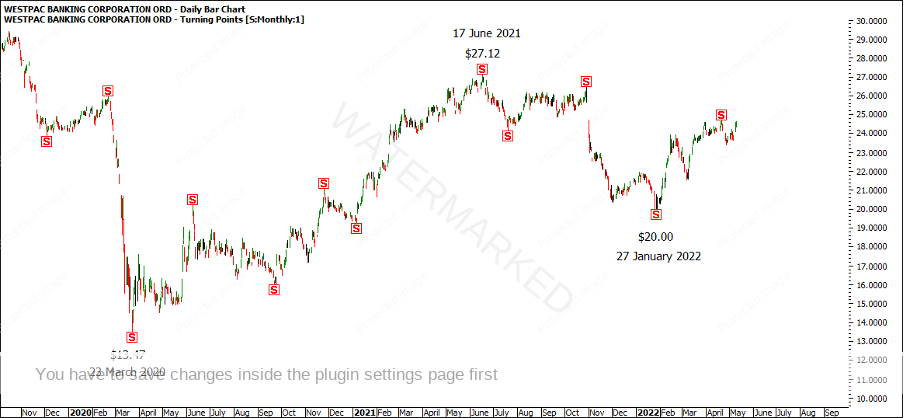
Moving on, 27 January 2022, Westpac made a retest low at $20.00. What reasons can you find for a cluster at this point? I’ll leave this for you to investigate further as you only learn by doing, although students of our Active Trader Program Coaching class might like to review our April live session for some clues!
Chart 3 – 27 January 2022 Low
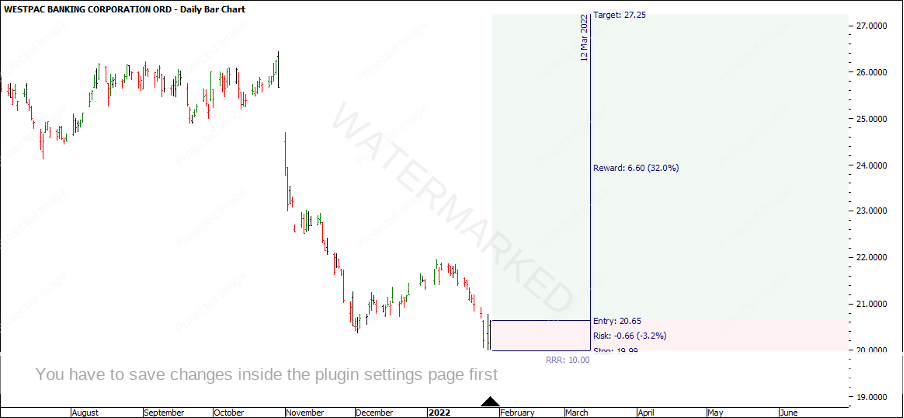
Looking at our trading strategies for entry and stop management in Chart 4 below, we could enter as the swing chart turns up on the daily swing chart. 27 January was the low, 28 January was an inside day so an entry stop would be placed at $20.65 and a stop loss at $19.99. As you can see, this is a large bar and gives a risk of 66 cents for the trade. This means the market would have to go to at least $27.25 to be a 10:1 Reward to Risk Ratio trade.
Chart 4 – Daily Reward to Risk Ratio
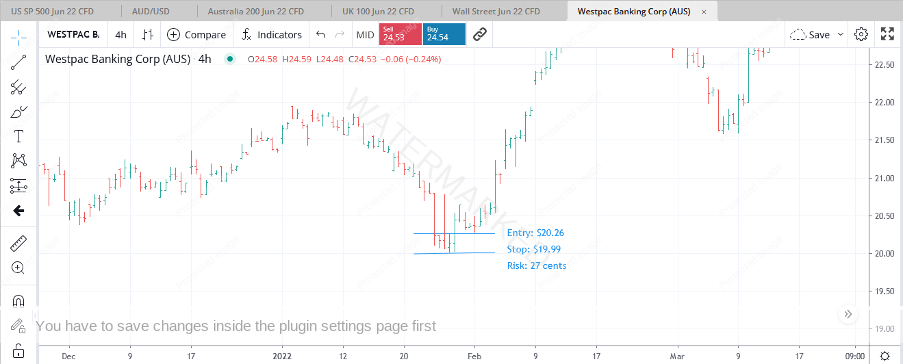
However we could drop down a time frame and look to enter on a 4 hour swing chart. In this case the 4 hour swing chart gave a contracting swing range into the low and the 4 hour bar produced a range of 27 cents.
Chart 5 – 4 Hour Entry
Immediately we have more than halved our risk which means our potential reward has more than doubled!
How would you then manage your stops according to your personality and trading goals? Are you someone that likes to hold a position for a long time or a short time?
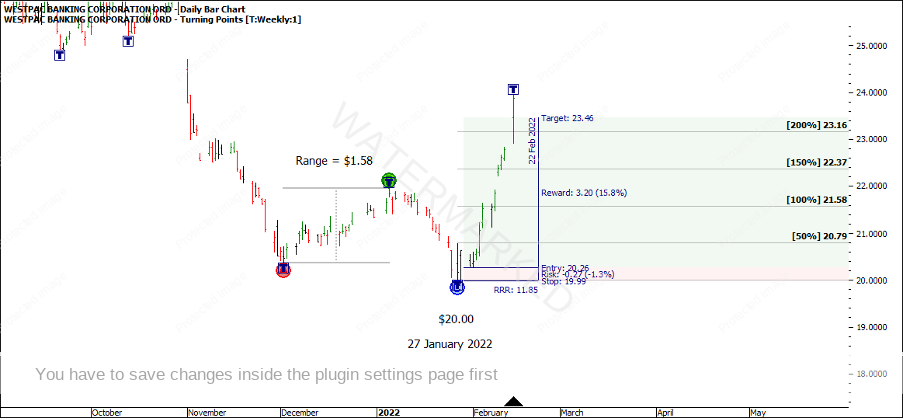
If you had decided to use the last weekly swing range of $1.58 as a reference range, the 200% exit target would have been $23.16. As it happened on 14 February, Westpac gapped up on open at $23.46 which would have triggered your exit stop and you would have banked a 11.85:1 after 18 days.
Chart 6 – Weekly Reference Range
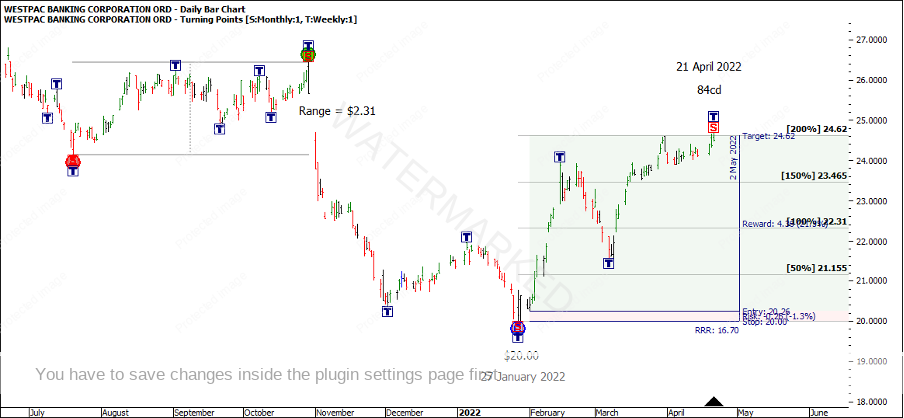
If you used the last monthly swing of $2.31 as the reference range, you would have been stopped out 84 days later out on 21 April for a 16.7:1 Reward to Risk Ratio.
Chart 7 – Monthly Reference Range
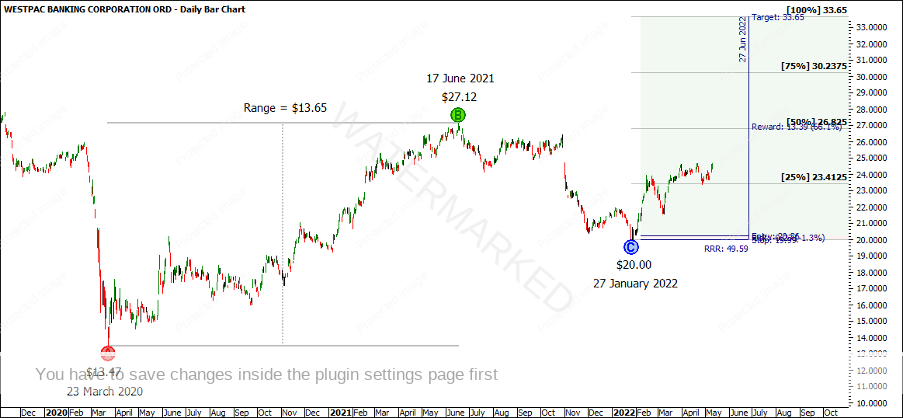
However, if your personality was to hold in for a longer time frame you could use the $13.65 reference range with the 100% target at $33.65. This would be close to a 50:1 Reward to Risk Ratio for one entry.
Chart 8 – Quarterly Reference Range
Below are the profit calculations for the above trading strategies.
Happy trading
Gus Hingeley
