Welcome to 2019! This year the Euro turns 20, Facebook turns 15, the UK is scheduled to leave the EU, and it’s 90 years from the great depression. Will it be a year to remember? It could be worthy of your time and attention.
I finished 2018 writing a Platinum Article about the famous mathematician Benoit Mandelbrot. I thought it was well received and felt entitled to share it with everyone at Safety in the Market. Mandelbrot said “My life seemed to be a series of events and accidents. Yet, when I look back, I see patterns.” Mandelbrot was known as the ‘father of fractal geometry’.
I want this to be a focus of 2019 so you can take a deeper look into the geometry of life and history. The chosen market we will explore is the S&P 500 (SP-SpotV in ProfitSource). As you can see from the chart below the S&P 500 has had three obvious sections up since 2009. Gann suggests generally after three sections up, there can potentially be a fourth. Any attempt for a fourth section can be
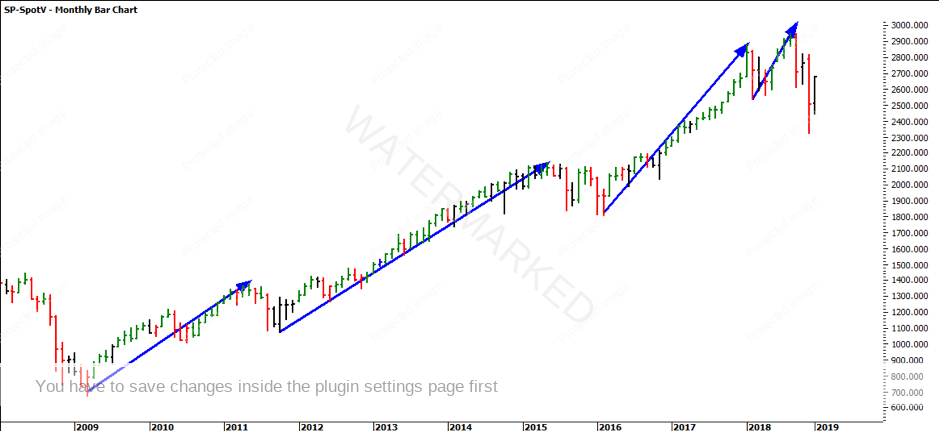
The First Section is referred to as the First Range Out (FRO) which in the S&P 500 was 703.79 points. If 703.79 points are projected from the start of the second section, you can see 1.5 multiples of 703.79 is 1,055.68. The top of the second section came out at 1,059.95 which is around 5 pts off. The FRO is in proportion to the second section.
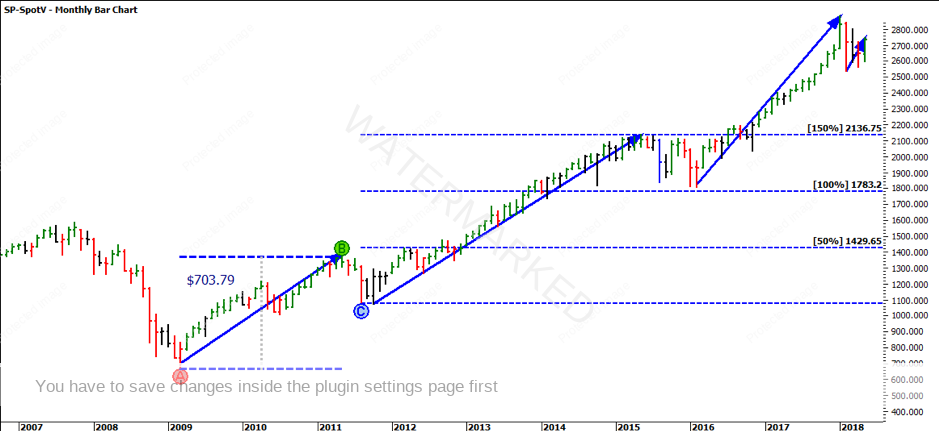
If you project the FRO from the bottom of the third section, the range again repeats 150% into the January 2018 top. Therefore, the range of the second section projected from the low of the third section repeats 100%.
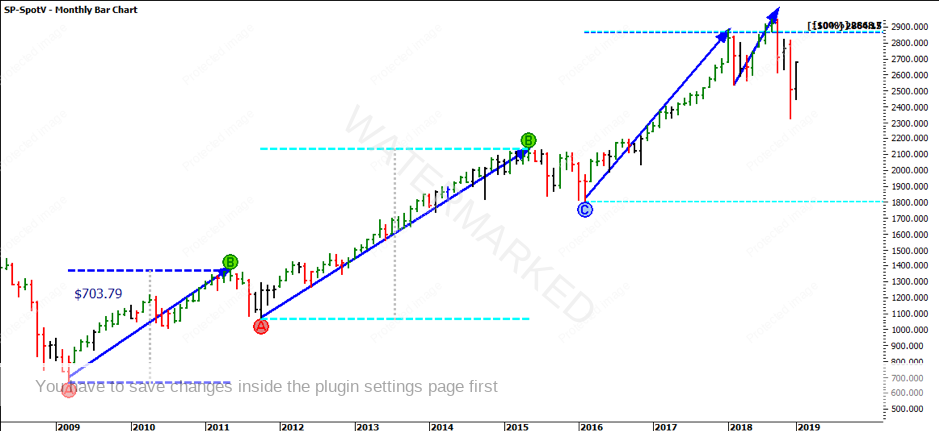
The final section produced a range of 408.22 points. If the FRO is projected from the start of the fourth section, you can see it essentially failed at 50% of the FRO. While it
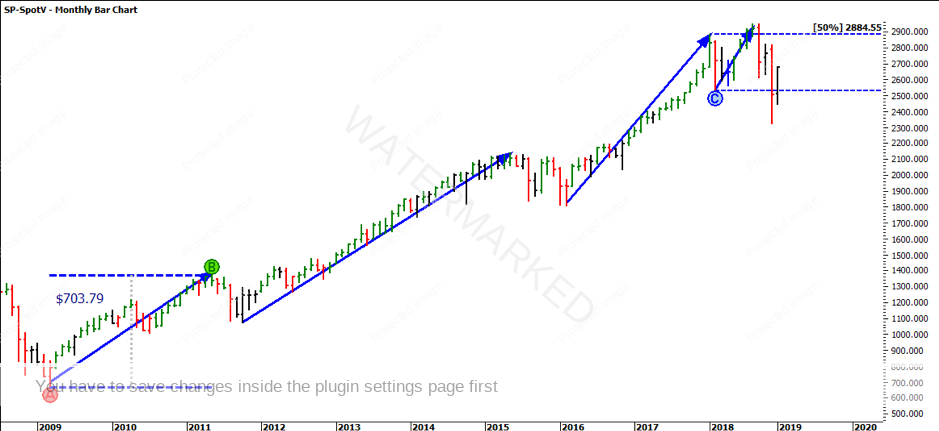
If we take it one step further and look at the bigger picture, the 1982 to 2000 range projected from the 2009 range has 150% coming in pretty much where our small ranges are lining up with. We can, therefore, confirm we have a price cluster. This does not mean the market is going to fall to zero, but it does allow us to understand that there is a pivotal price zone which we should take on board to see how the market interacts with this zone.
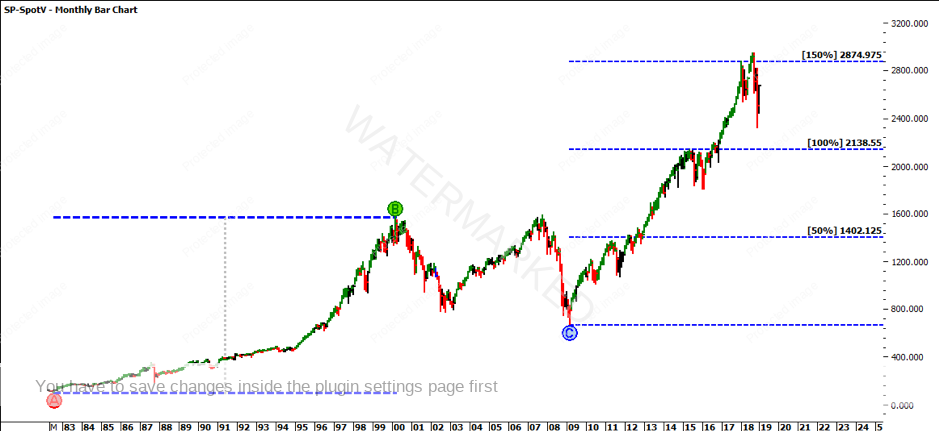
We have seen an aggressive fall in the
The 50% level of any major range is highly important. Half of anything is a psychological level. If there was
In terms of where we currently sit, we have recently found support on 50% of the third section. This is a natural level to watch for the initial support. Whether this is a dead cat bounce or a major low, it will definitely be a major price point to watch.
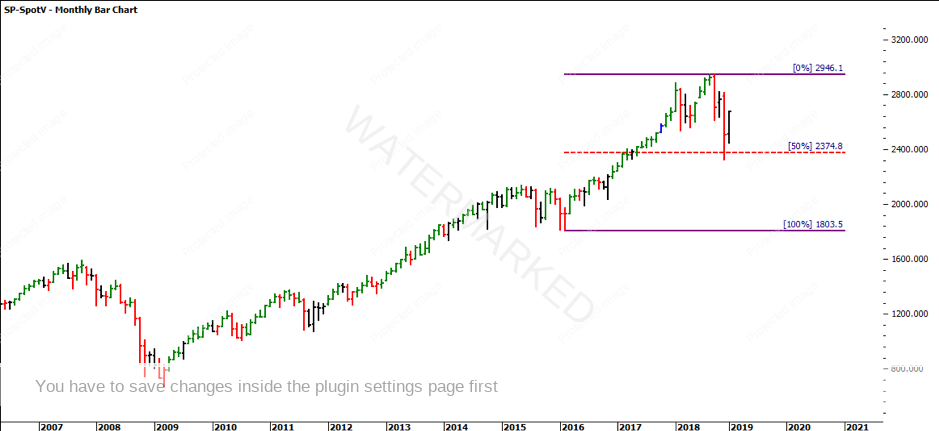
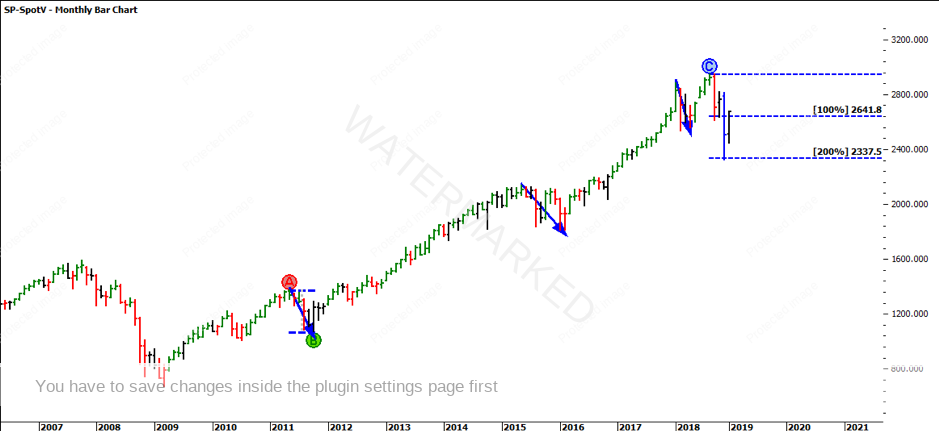
I am interested to see how the market reacts from this low. As you can see below, the most recent pullback is two multiples of every other pullback. A strong recovery and a retest of the highs might confirm Gann’s comment that the safest place to sell is the first lower swing top. If we see a strong push, a retest of previous bottoms at the current levels will be a place to watch as well.
Let’s make 2019 a year where we look back in time and see the future. As David Bowden suggests, let’s make hindsight our foresight or do as the infamous Mandelbrot suggested and look back at all the events and see patterns.
It’s Your Perception
Robert Steer