Accumulation
This article first discusses a price cluster and then considers how much strength has been added to it by accumulation.
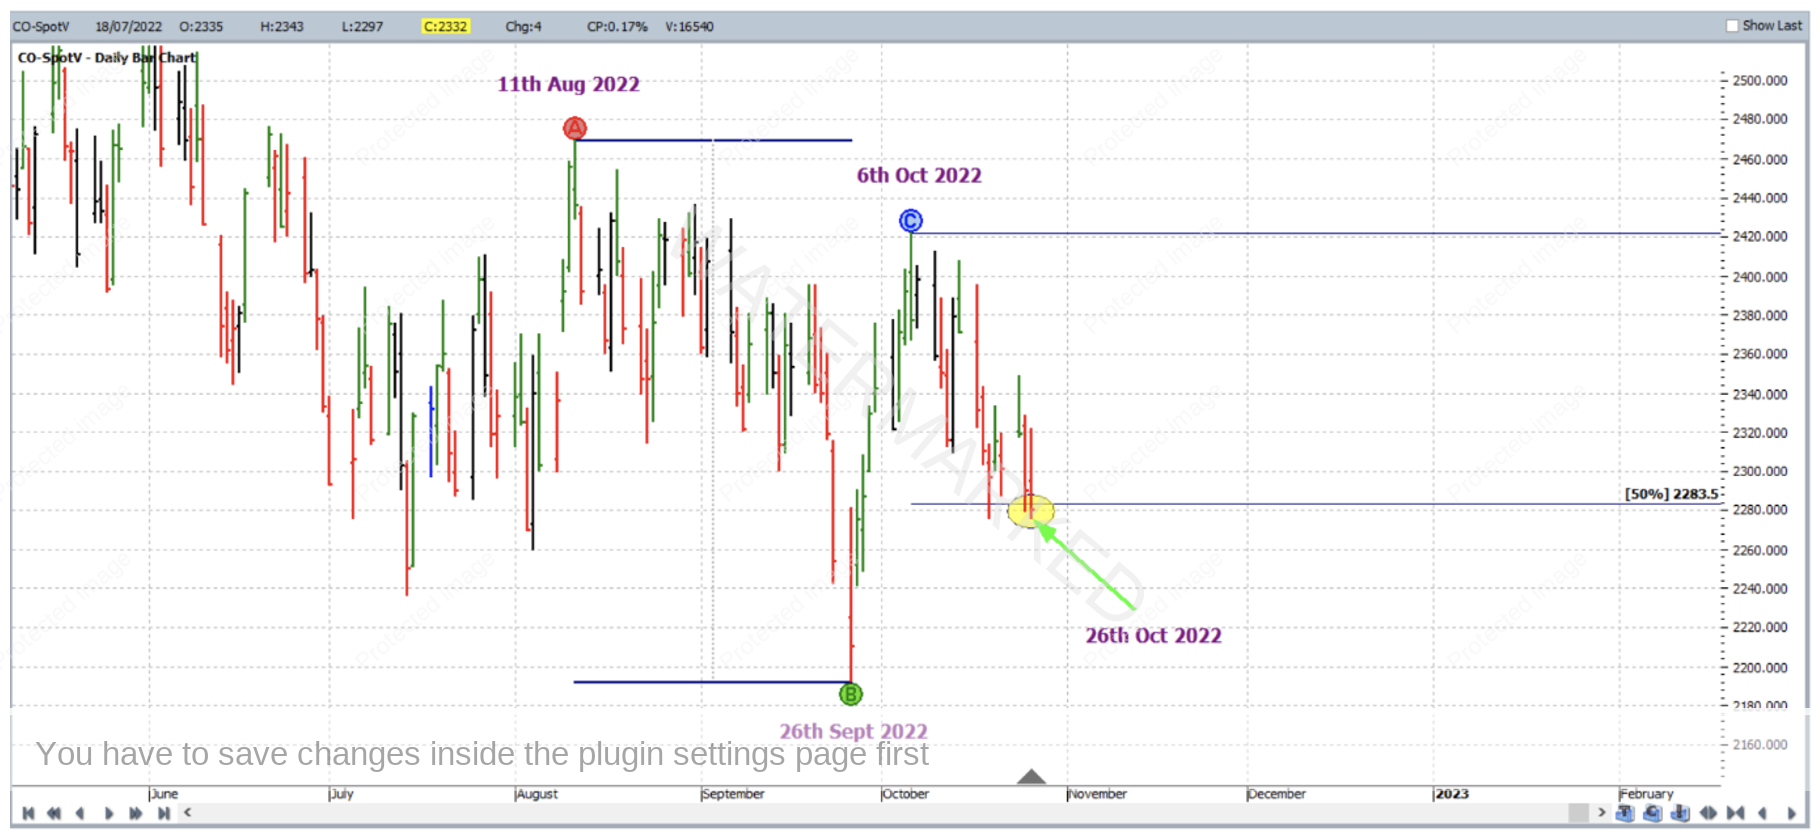
By 26 October 2022, the Cocoa futures market (chart symbol CO-SpotV in ProfitSource) had presented a price cluster with the case being for a long trade. There were three reasons:
1.Repeating Ranges. The ABC Pressure Points Tool with Point A on the high of 11 August 2022, Point B on the low of 26 September 2022, and Point C on the high of 6 October 2022. The 50% milestone was at a price of 2284 (units being USD per metric tonne). In other words, assuming we can tolerate a little error (and we certainly can) the market potentially had support very close to the 50% milestone. See the chart below in Walk Thru mode.
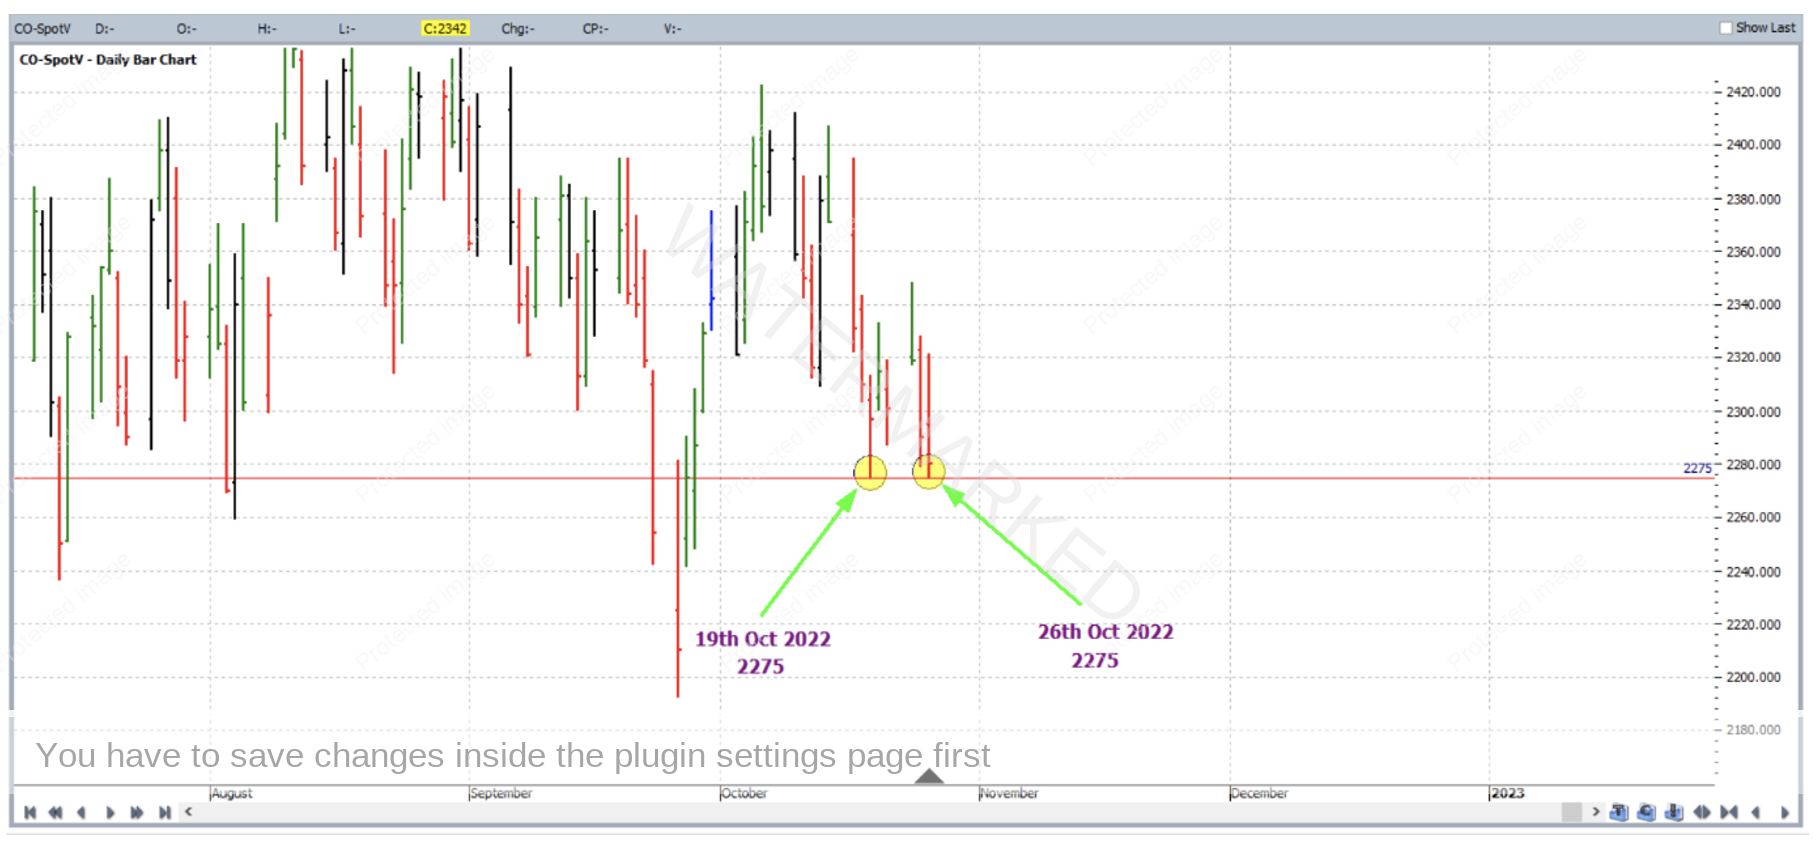
2. The lows of 19 October 2022 and 26 October 2022 were exact small picture double bottoms at 2275. Generally, the closer two potential double bottoms (or double tops for that matter) are in terms of time, the less tolerance for error.
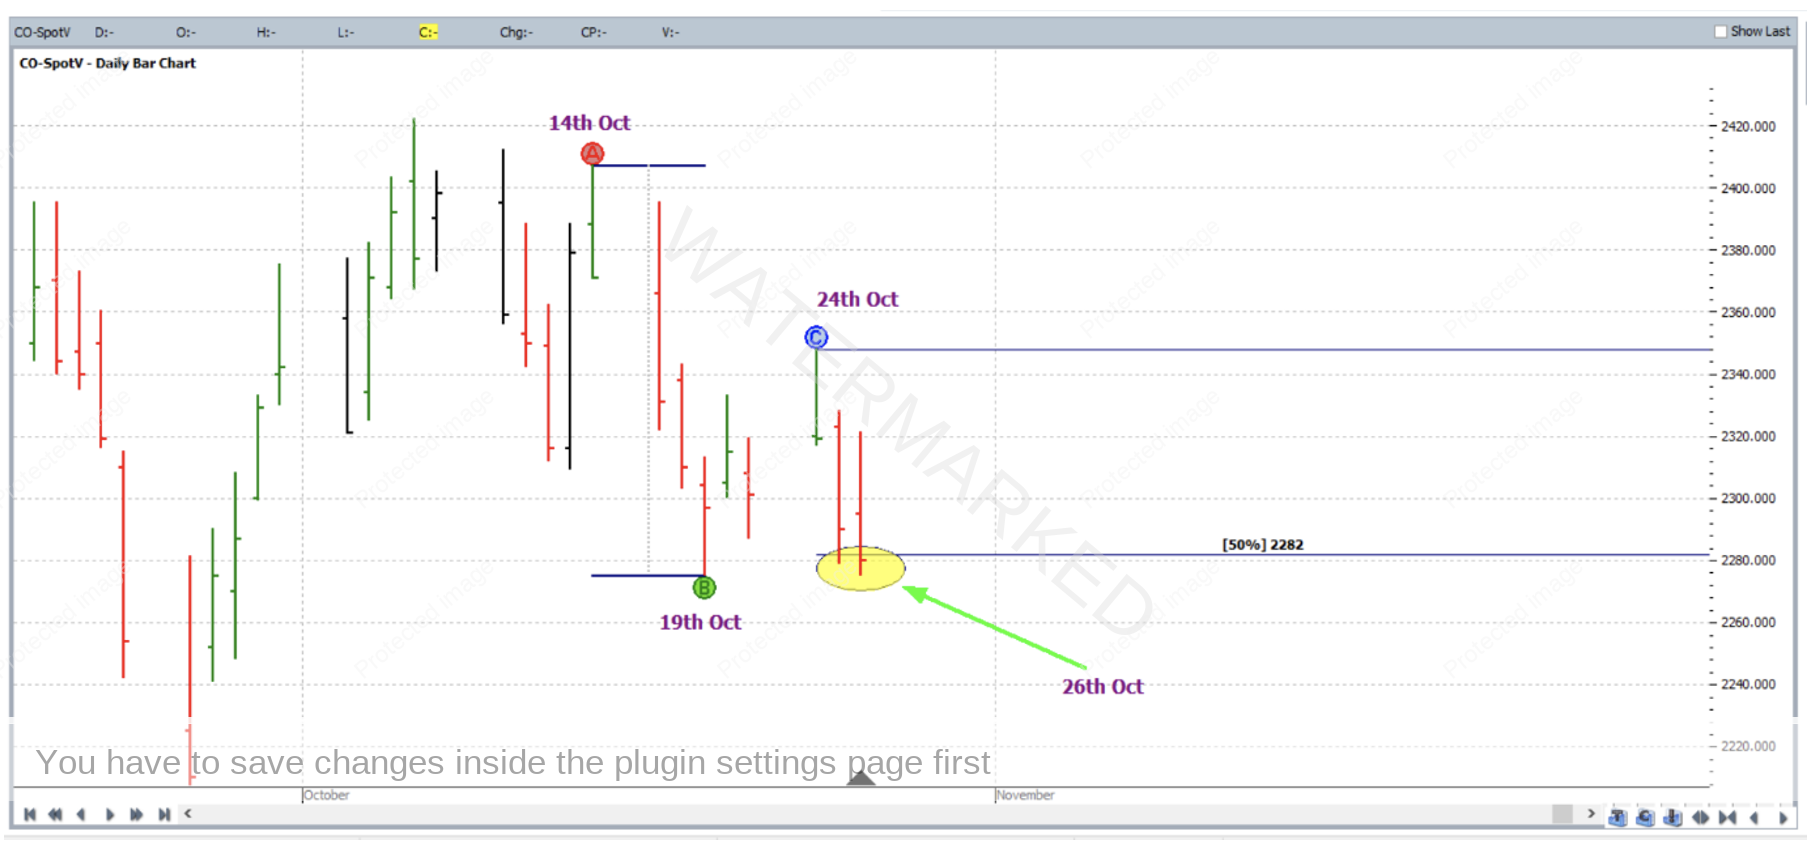
3. The Milestone Chart again. The ABC Pressure Points Tool with Point A on the high of 14 October 2022, Point B on the low of 19 October 2022, and Point C on the high 14 October 2022. The 50% milestone was at a 2282, which clustered very closely with the abovementioned 2284 price level. See below for a zoomed in view.
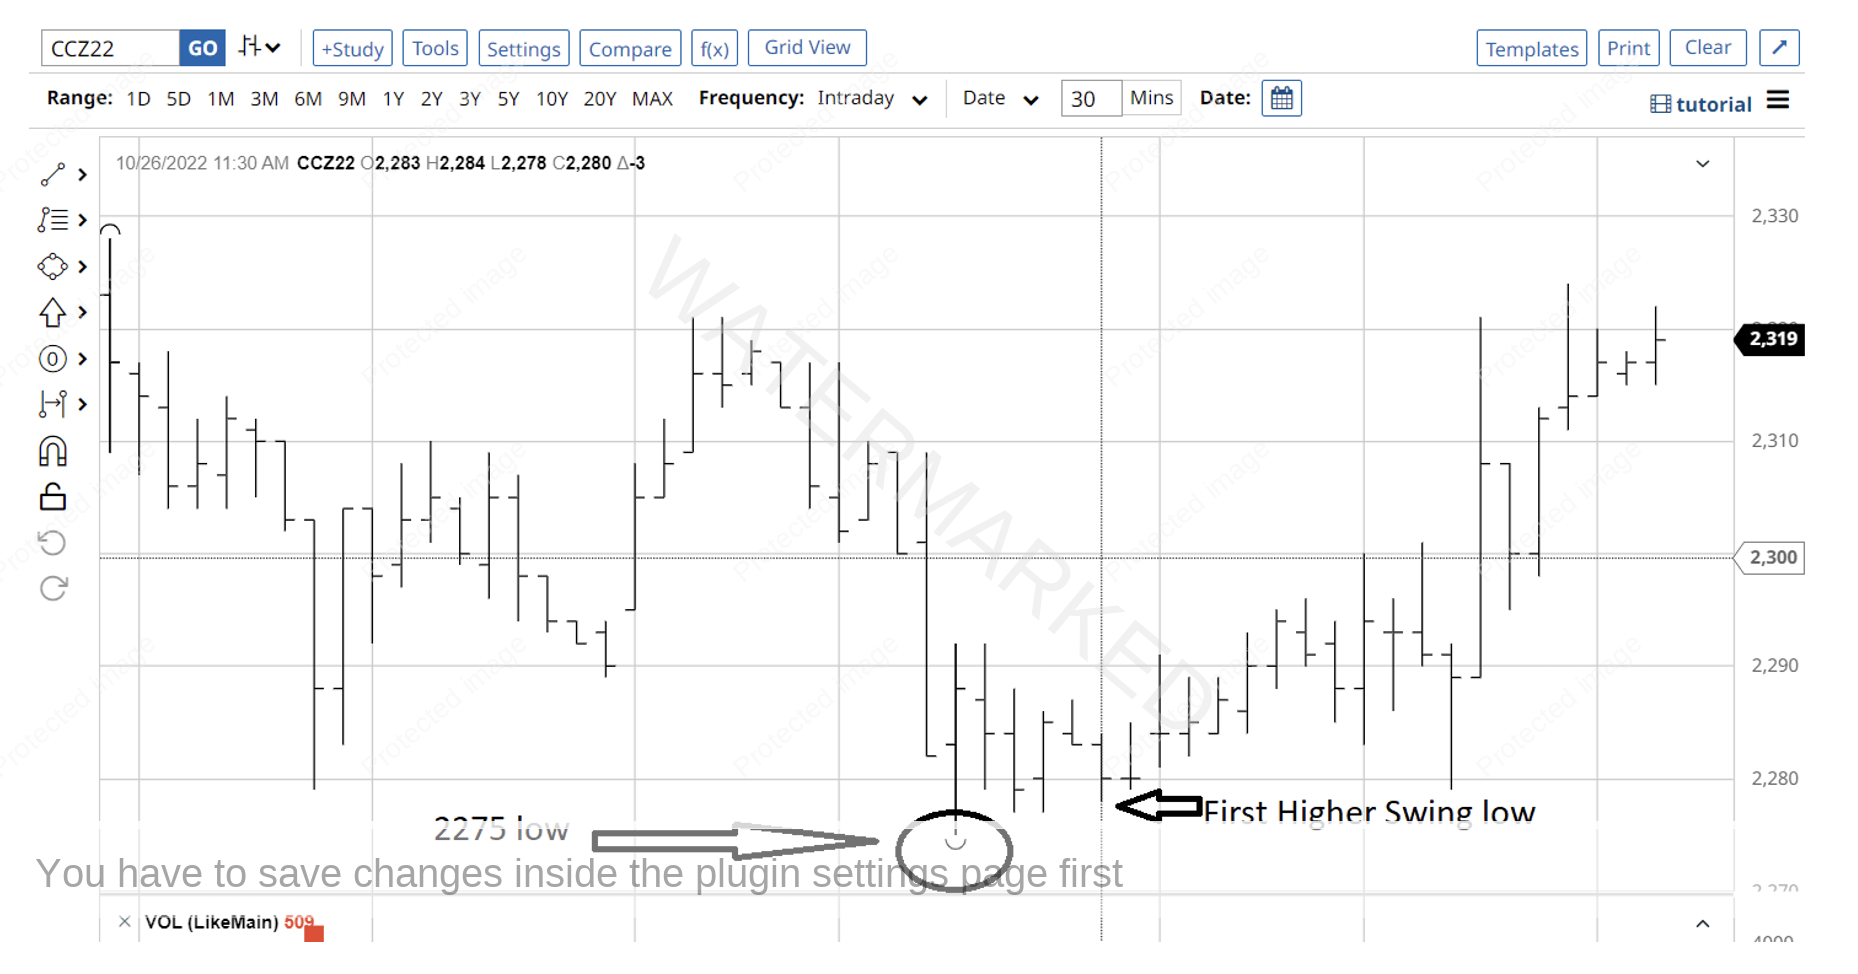
So, what about the trade? Below is a screenshot of the 30-minute intraday bar chart from barchart.com. It is for the December 2022 contract, and the second of the two double bottoms on 26 October 2022 at 2275 is shown. After this low, just before midday Central Standard Time in the US, there was a first higher swing bottom entry signal, which when triggered would have had you long Cocoa at 2285 with an initial exit stop at 2277.
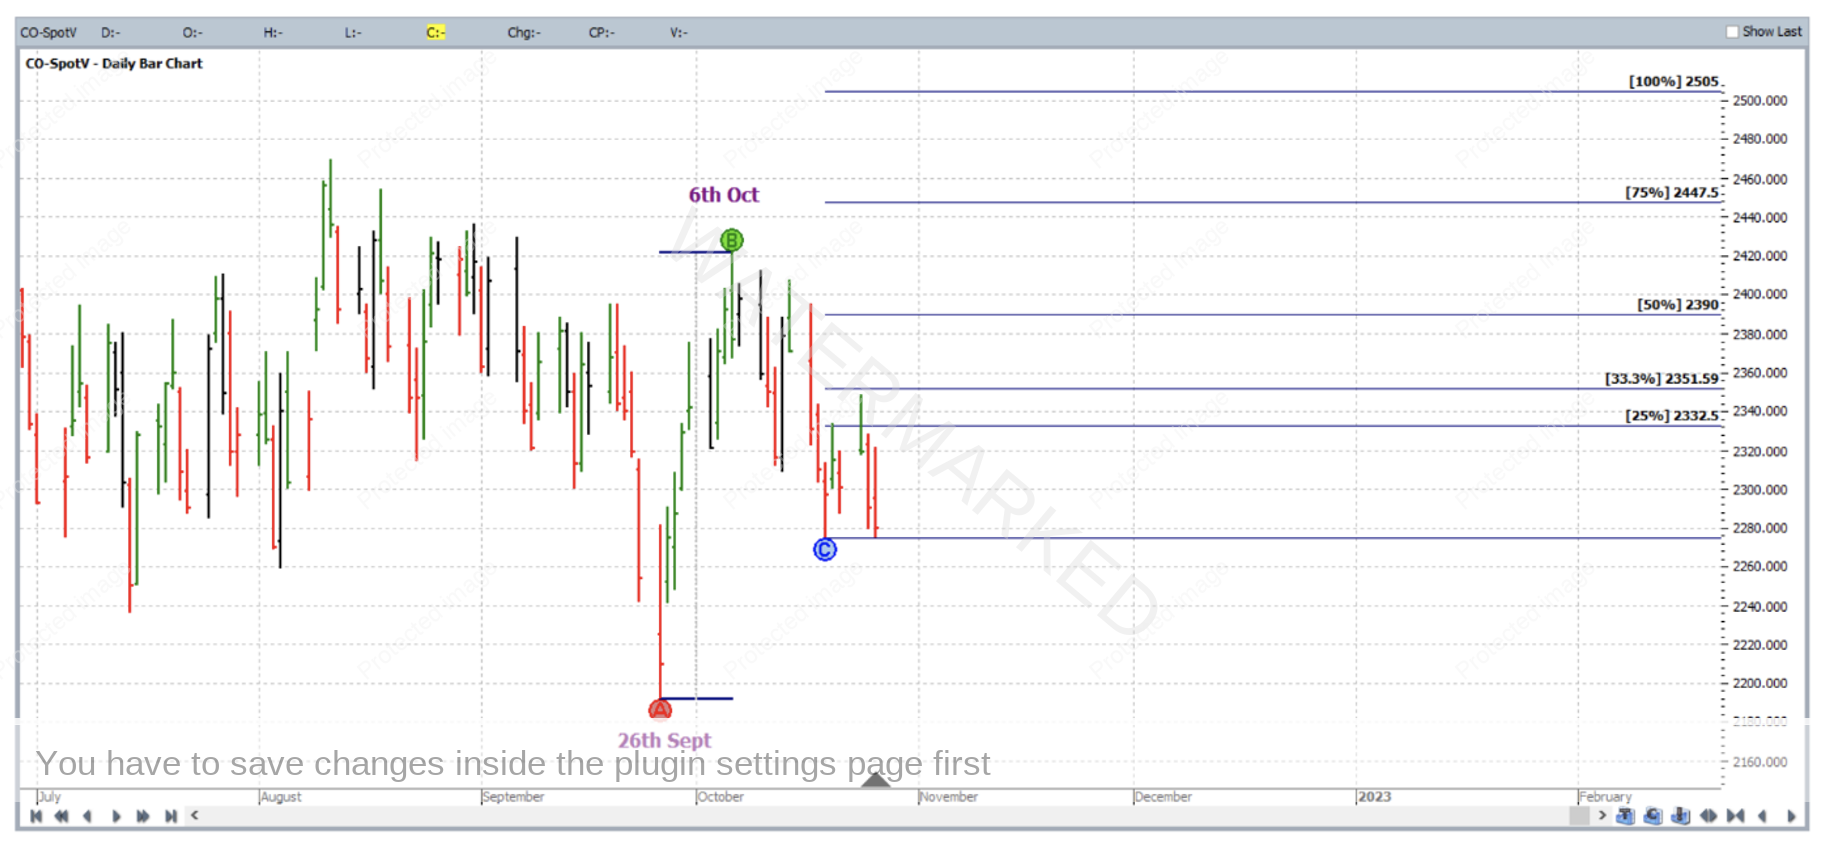
Zooming back out, the reference range chosen for the trade was the last weekly swing in the same direction as the trade. This is shown below, with Point A on the low of 26 September 2022, Point B on the high of 6 October 2022 and Point C at 2275 i.e. the level of the two double bottoms.
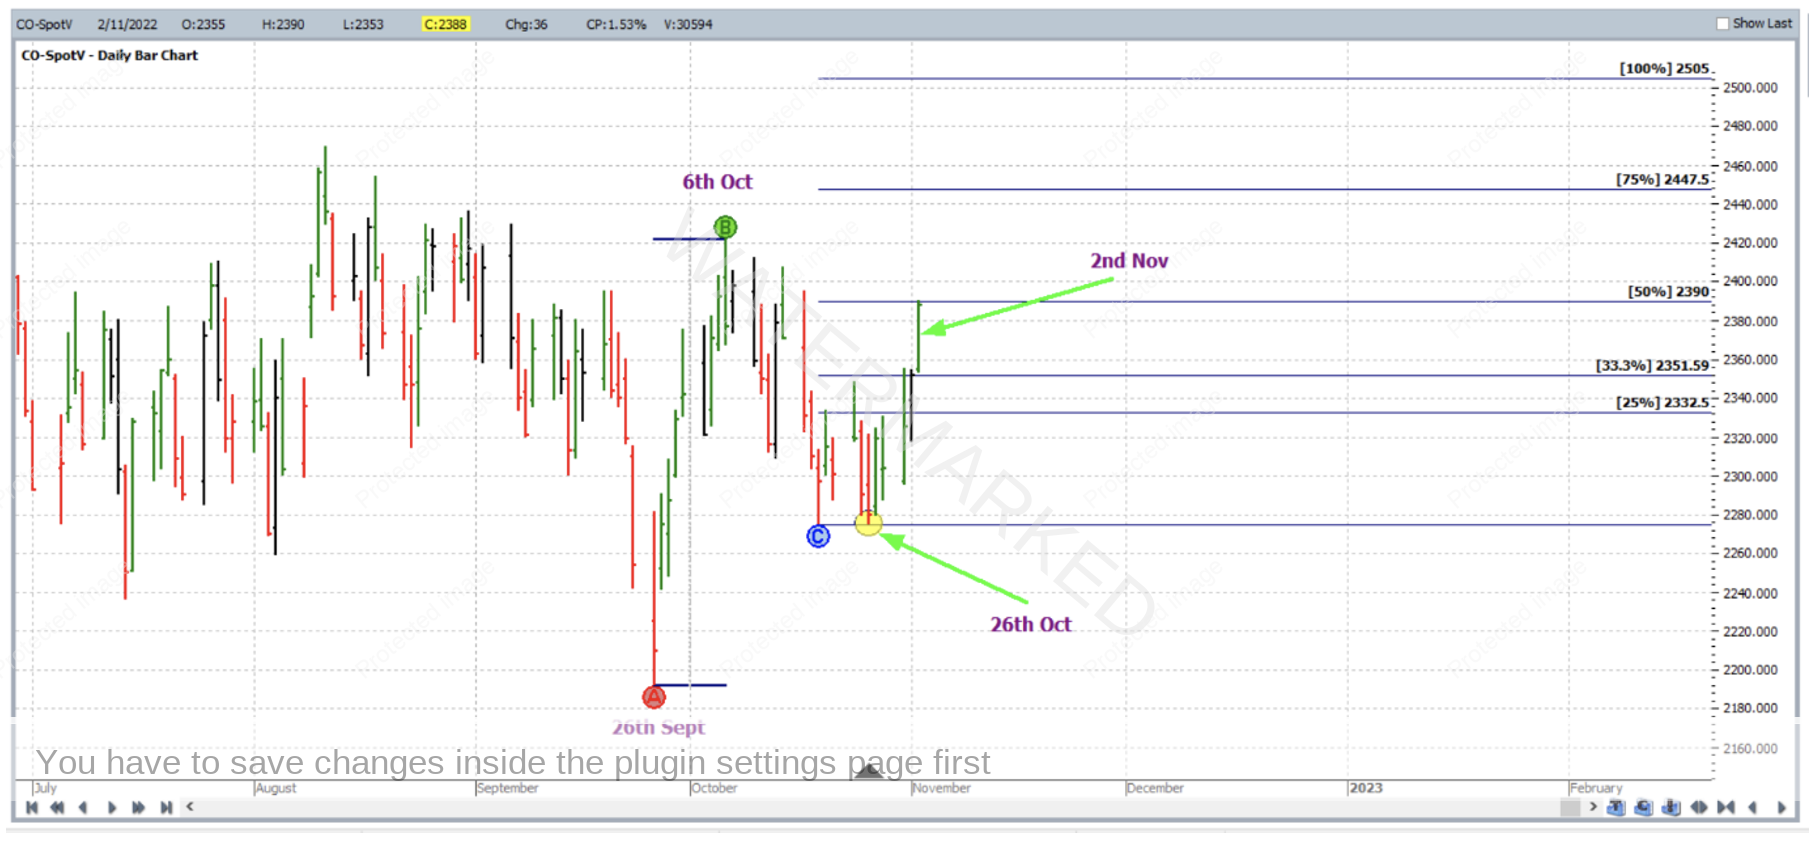
If stops were managed “Currency Style” while in the trade, when the market reached the 50% milestone on 2 November 2022, stops were moved to break even.
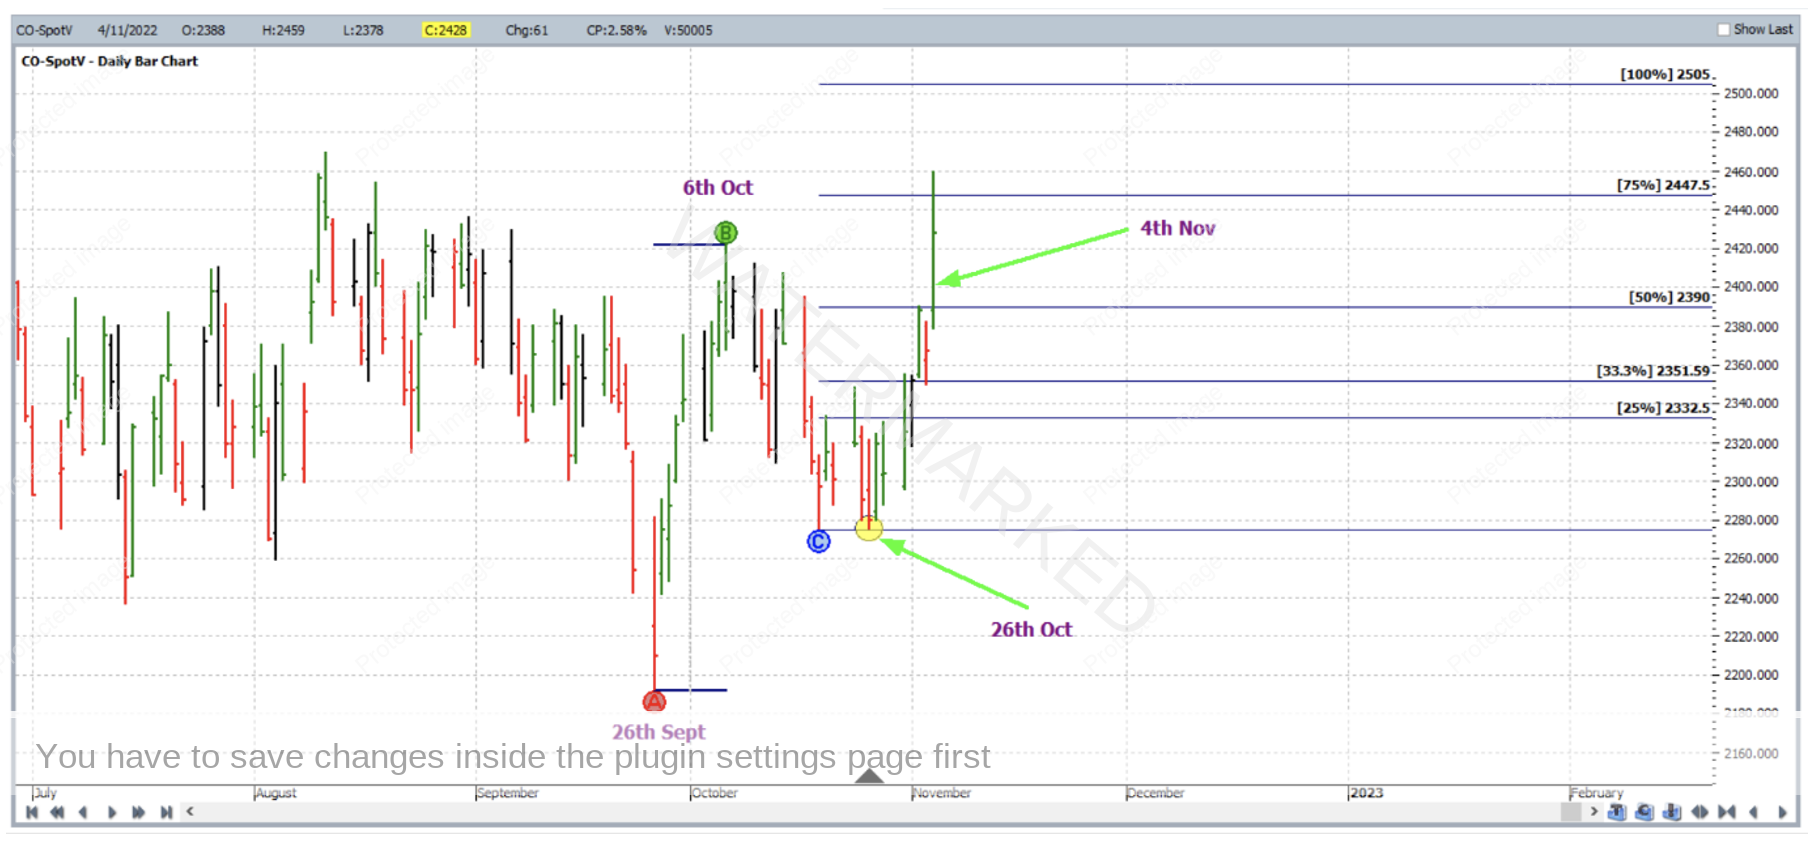
On 4 November 2022 when the market reached the 75% milestone, stops were moved to below the 50% milestone to lock in profit.
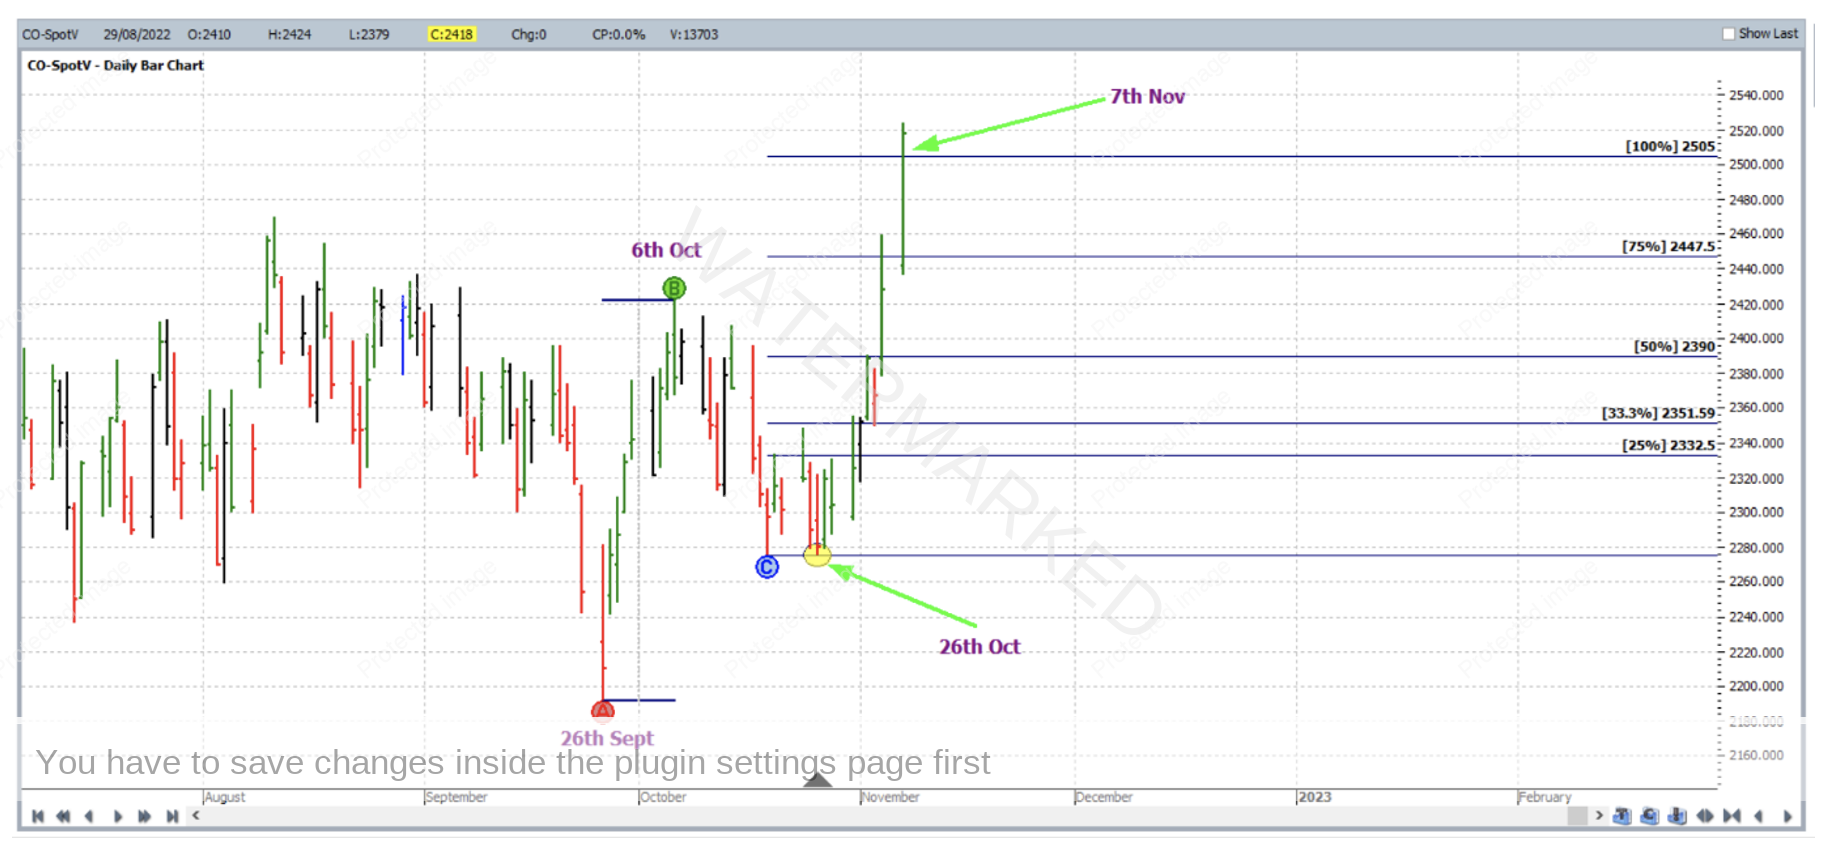
And on 7 November 2022, the market reached the 100% milestone and profits were taken at 2505.
Breaking down the rewards, in terms of the Reward to Risk Ratio:
Initial Risk: 2285 – 2277 = 8 = 8 points (point size is 1)
Reward: 2505 – 2285 = 220 points
Reward to Risk Ratio = 220/8 = approximately 28 to 1
Because of the very small distance between the entry price and initial stop loss, let’s assume that only 1% of the account size was risked at trade entry. In this case the gain in account size would be as follows:
28 x 1% = 28%
Each point of price movement changes the value of one Cocoa futures contract by $10USD. So in absolute USD terms the risk and reward for each trade of the contract is determined as:
Risk = $10 x 8 = $80
Reward = $10 x 220 = $2,200
At the time of taking profit, in AUD terms this reward was approximately $3,410 for trading each contract. But that’s not the end of this article….
Some readers might already be thinking, especially after reproducing the analysis themselves in ProfitSource, yes it was a price cluster, but was it a strong one? The answer – maybe not! Whilst there were two monthly turning points that gave input to the analysis (Points A and B of the first ABC Pressure Points Tool application), no other really significant turning points were invloved, not to mention two only very small picture double bottoms. In previous case studies of these articles, price clusters were derived by using more turns from the bigger picture.
So why was this month’s price cluster even worth mentioning and were there other factors in favour of the trade? Usually we would look to time analysis, but since that is beyond the scope of our general monthly newsletter articles, what else do we have? What else could have added some bullish sentiment and our case to enter a long trade for Cocoa at the time and aim to trade a weekly swing? Is there any other general form reading of this market which could have been done?
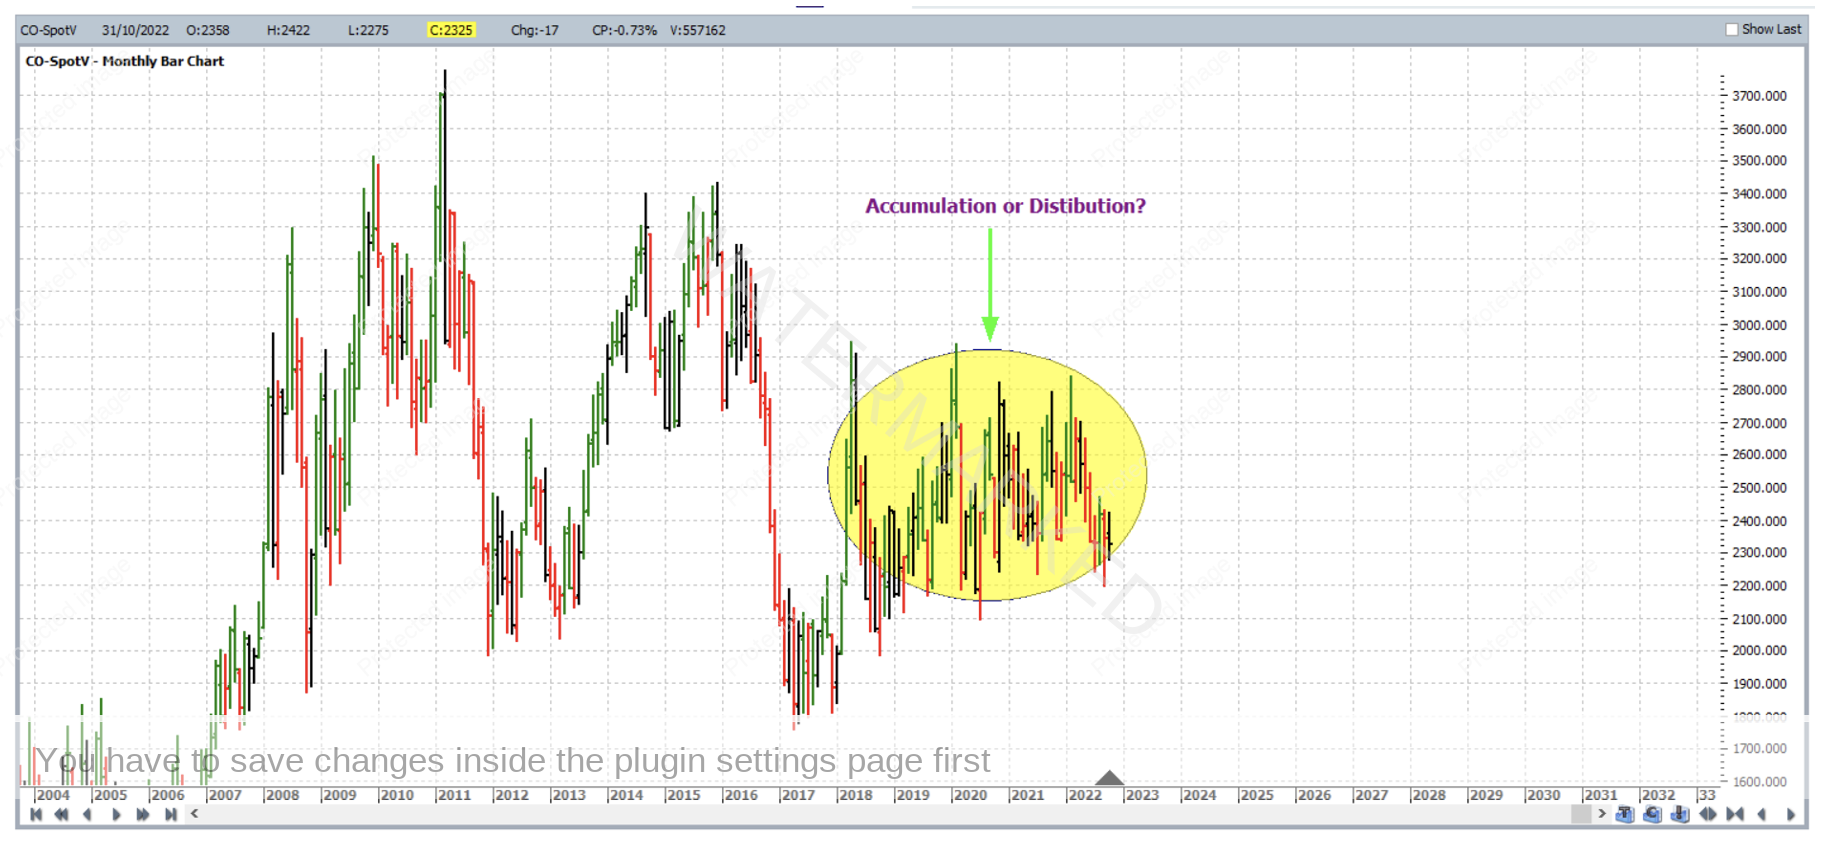
First of all – let’s zoom out. Opening a daily bar chart, and pressing the plus key a few times, we get to the monthly bar chart. This is shown below, with the chart in Walk Thru mode up until October of last year. One thing you might notice is that this market has been largely stuck in a sideways pattern since the middle of 2018, i.e. roughly for four years before the time of the trade. One thing this can mean for a commodity is that the market is or was in a phase of accumulation or distribution. The former pre-empting a big breakout to the upside, the later a breakout to the downside.
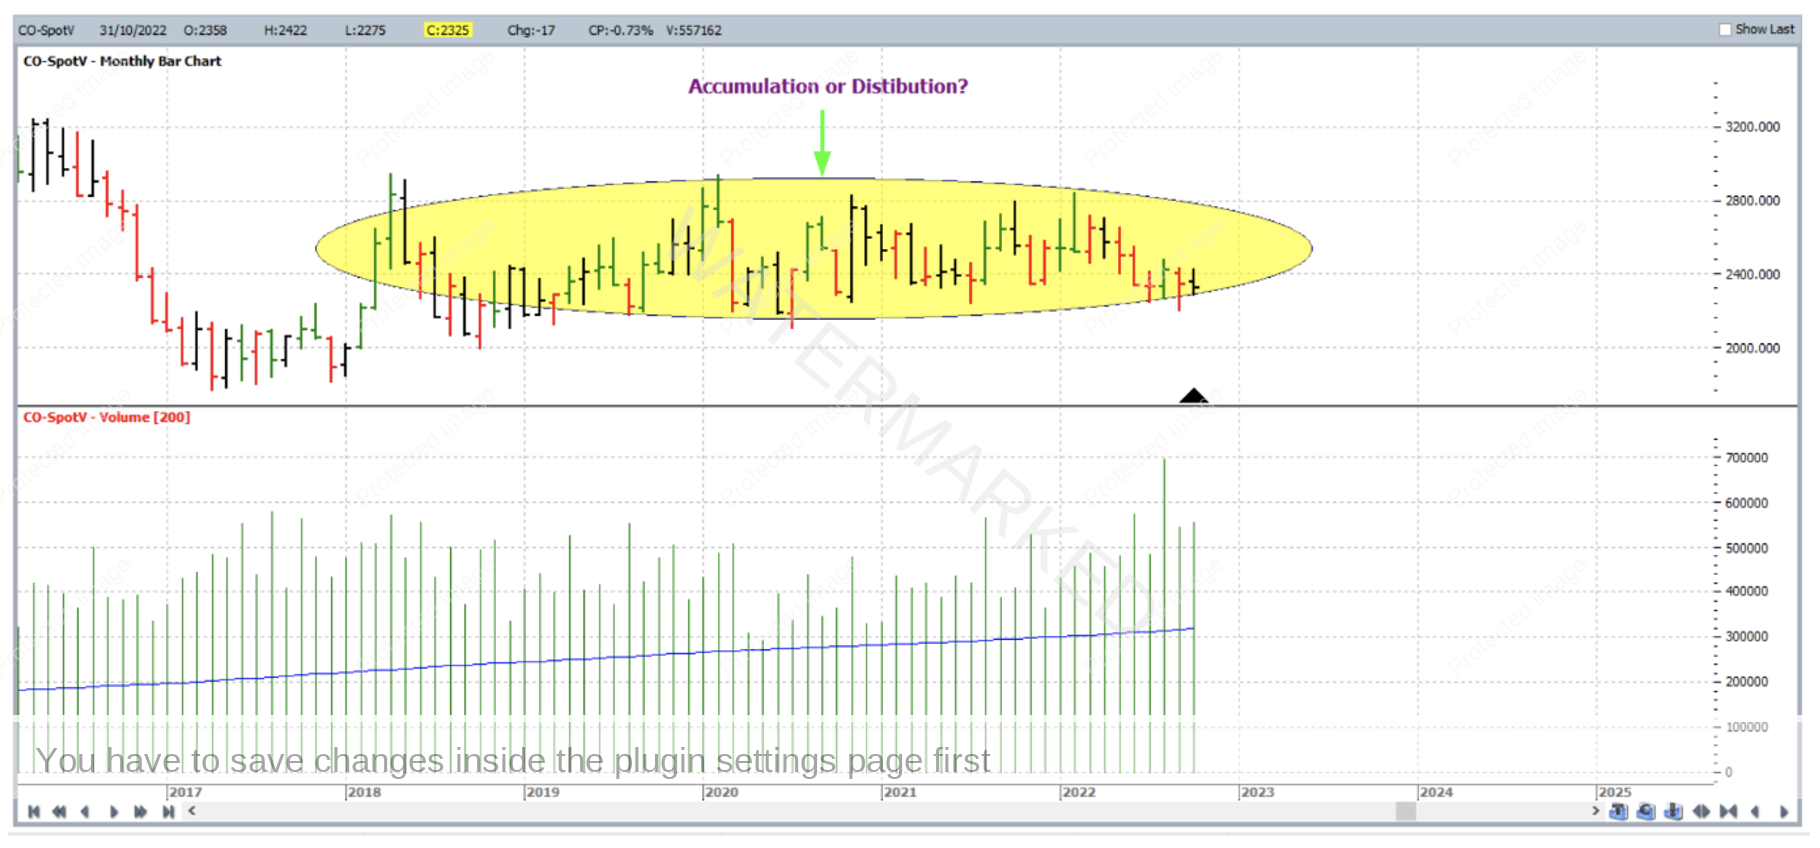
While trading a breakout is good, firstly it would be more useful if we knew when the breakout would be more likely to occur. But in the absence of time analysis, were there any other signs? What about volume? If we switch on the volume indicator, what you’ll notice is that there was a steady rise in volume in this market during 2022. Perhaps a sign that more interest was coming back into this market, in anticipation of a breakout?
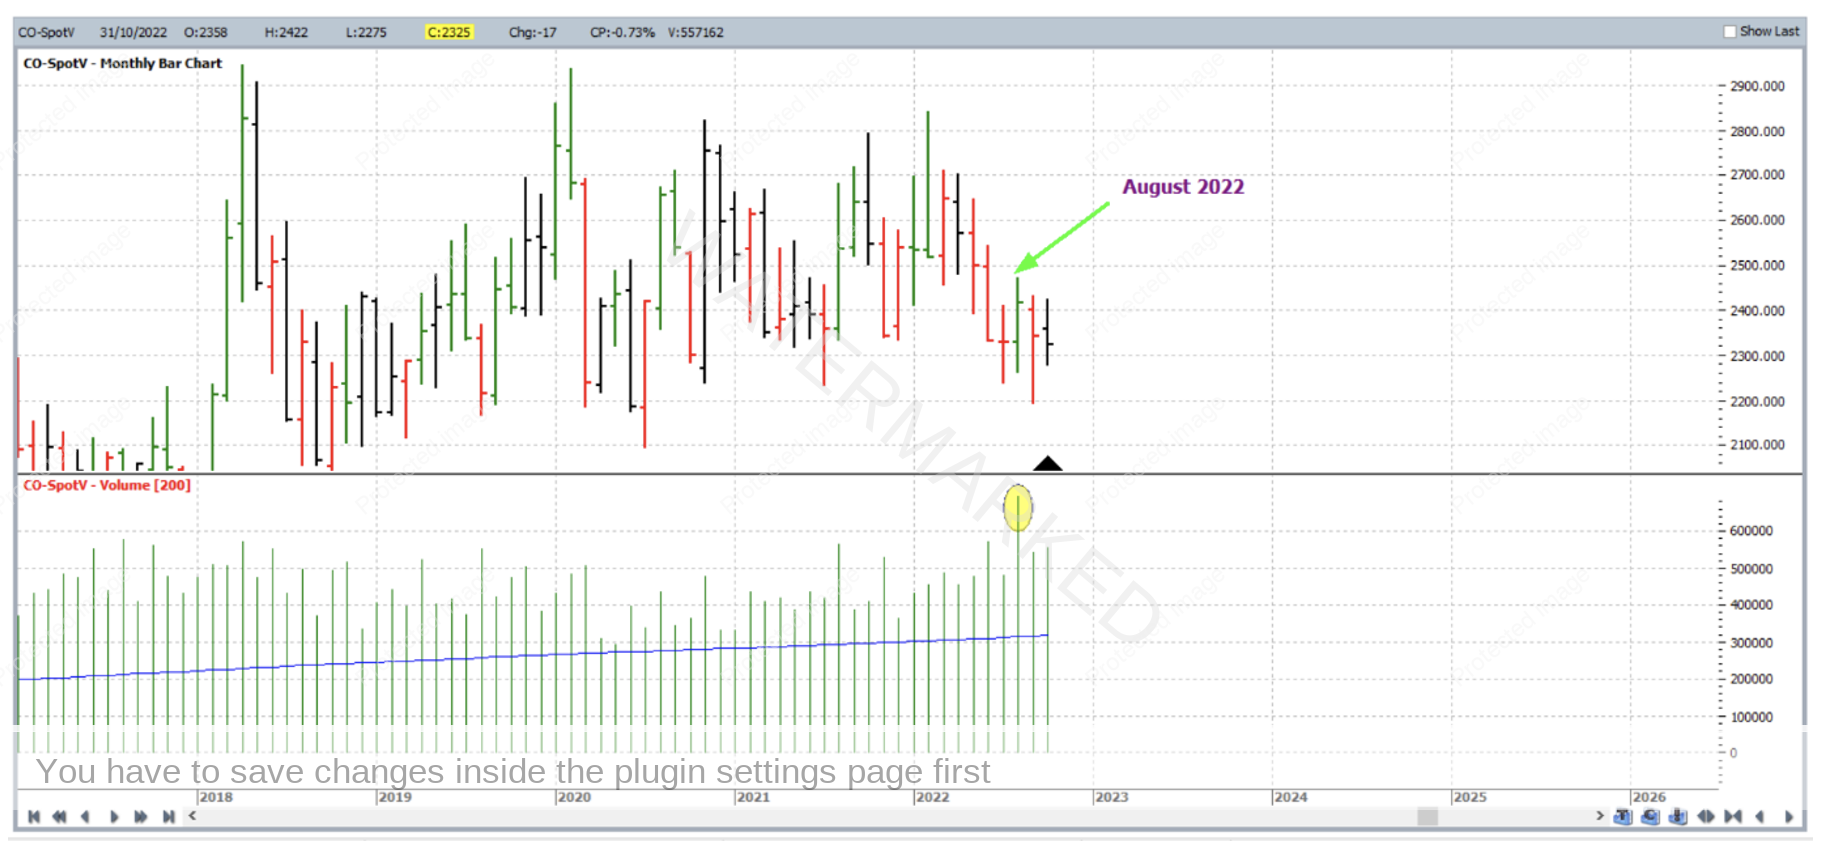
And with the market in that way dropping a hint that a breakout might be near, in which way? Up or down? There are a couple of things we can look at here. Firstly, doing some more detailed volume analysis, the big spike in volume during 2022 came with a positive temperature UP bar, that of August 2022. This adds bullish sentiment, as opposed to a market rising on low volume.
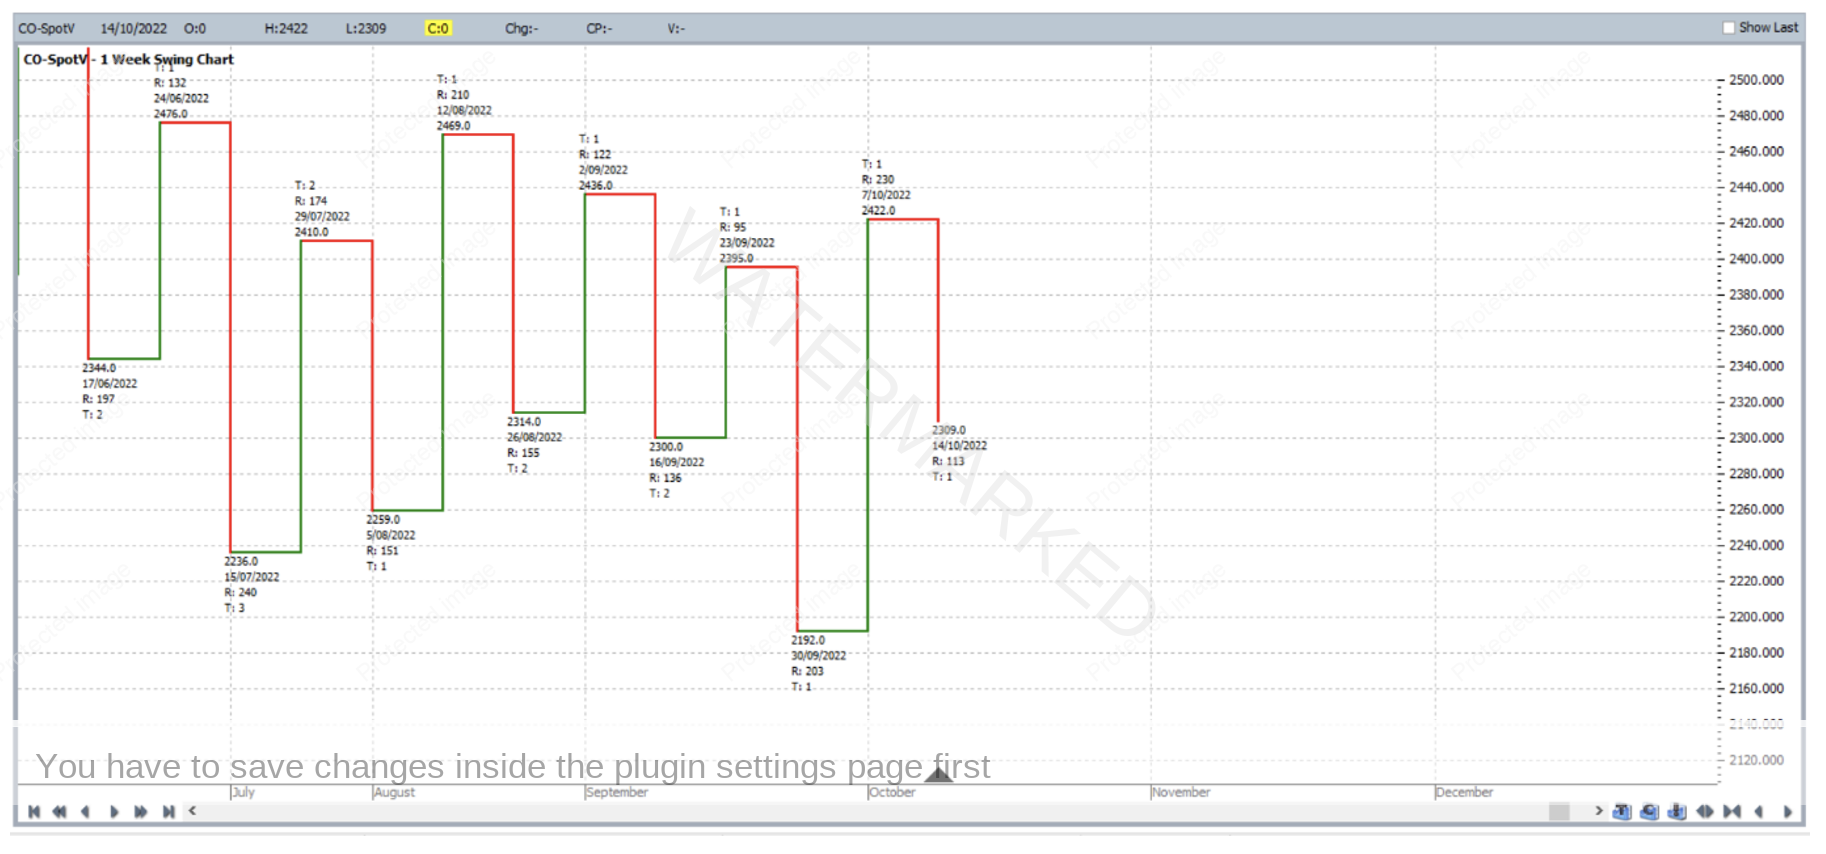
Finally, we go back to the simple weekly swing chart. This is shown below in Walk Thru mode right up until how it looked at trade entry. Note the last expanding weekly upswing (a range of 230 which was greater than 95, the last up range before it). The last swing top was a higher swing top compared to the one just before it, and the last weekly downswing, yet to be confirmed, still had a chance to end up contracting compared to the downswing before it. While a weekly up trend was yet to be confirmed at the time of taking the trade, the evidence from this swing chart was still enough to add to any bullish sentiment we may have already had at the time of taking the trade.
The case of accumulation versus distribution, and volume analysis for that matter can be a bit less definitive and therefore a bit more open to discussion. Nonetheless it’s a discussion worth having because an awareness of these factors and forces can add strength to the analysis.
Work hard, work smart.
Andrew Baraniak
