An Unusual Setup
Research lately has me deep into the world of probabilities, something that Mark Douglas talks about in his trading psychology book Trading in the Zone.
He also talks about three types of trading systems, starting with a mechanical system designed to turn you into a profitable trader. This in turn raises your vibration so you can graduate to a more subjective approach because you are in vibration with taking winning trades and you start to see more and more winning opportunities.
The work I’ve been doing recently is on weekly swing behaviour. The SPI200 made a weekly swing low on 9 September which was a 33% retracement. Over the past 20 years I wanted to know what to expect after a 33% retracement. I had questions like:
- How far is the next weekly swing likely to run?
- How big is the next weekly swing retracement likely to be?
- How many weekly swings to expect before a decent monthly swing top?
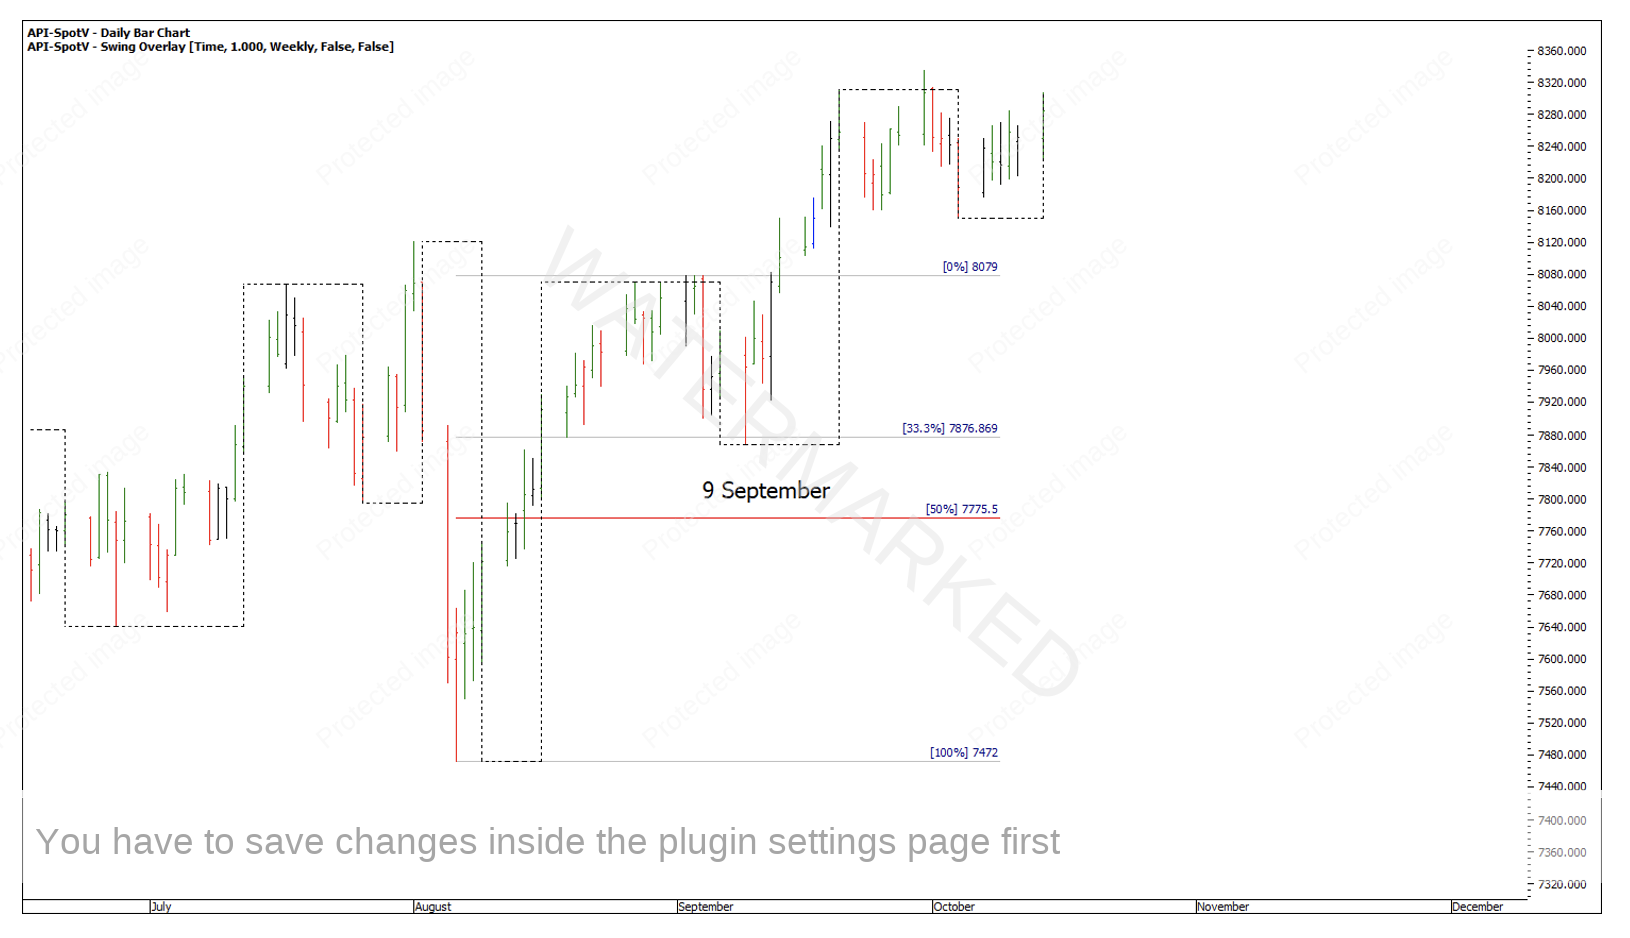
Chart 1 – 33% Weekly Swing Retracement
I found if the SPI does a 37.5% weekly swing retracement or less, the next weekly swing up will nearly always be a contracting weekly swing. When I say nearly always, the probability is around the 95% area. That alone is an extremely handy piece of information.
This is exactly what we saw leading into the 30 September weekly swing high.
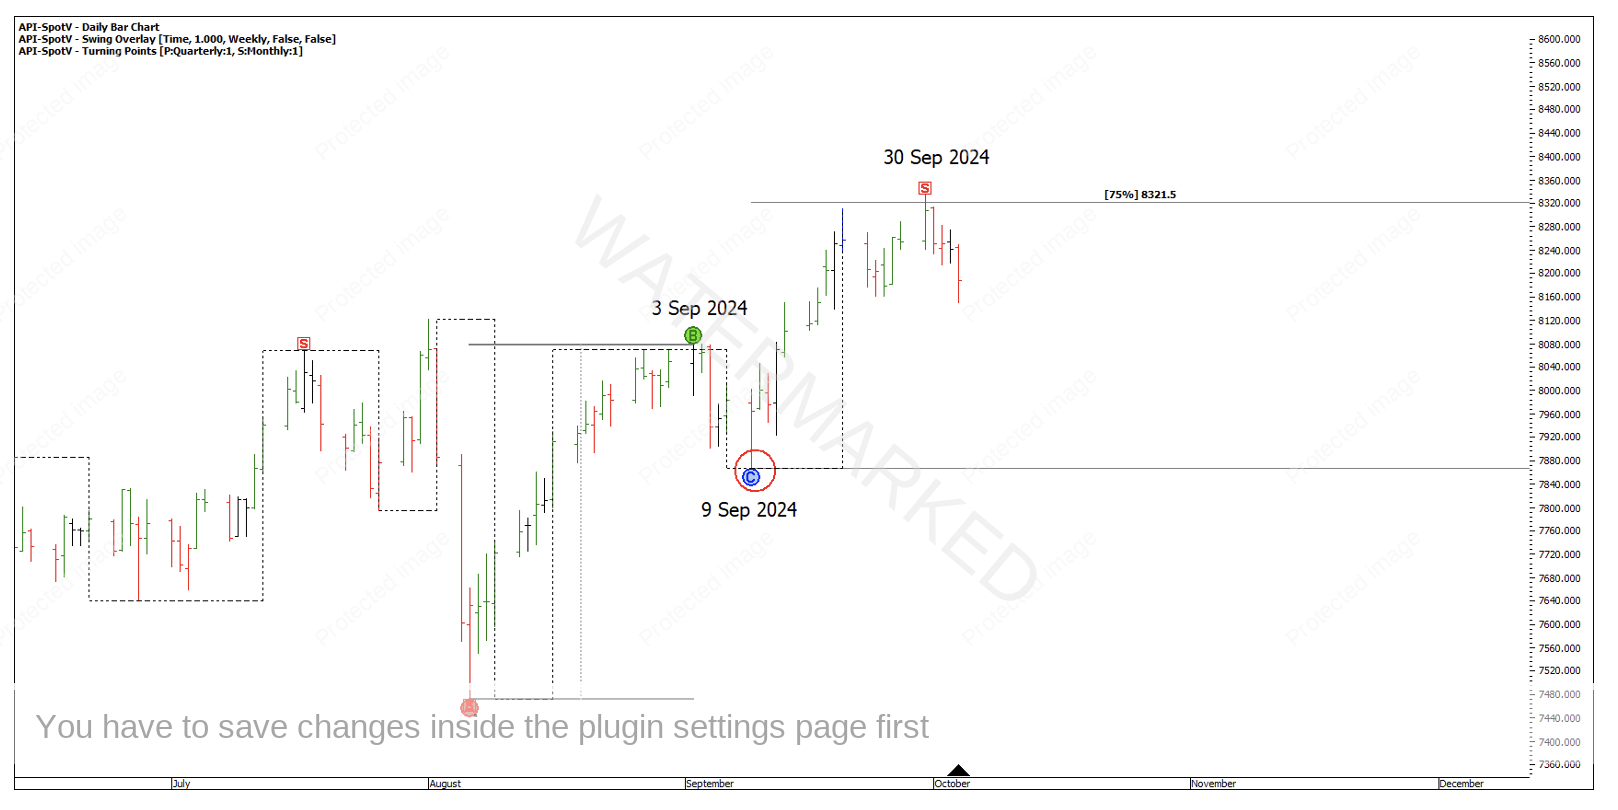
Chart 2 – Contracting Weekly Swing
In terms of First Range Out’s within a weekly swing, only about 20% of trades go past 225% of the First Range Out (FRO) before the weekly swing turns. With four daily sections up into 225% of the FRO, with a repeating daily swing range into 30 September at 75% of the previous weekly swing, there was good evidence to take profits or even be short with probability on your side.
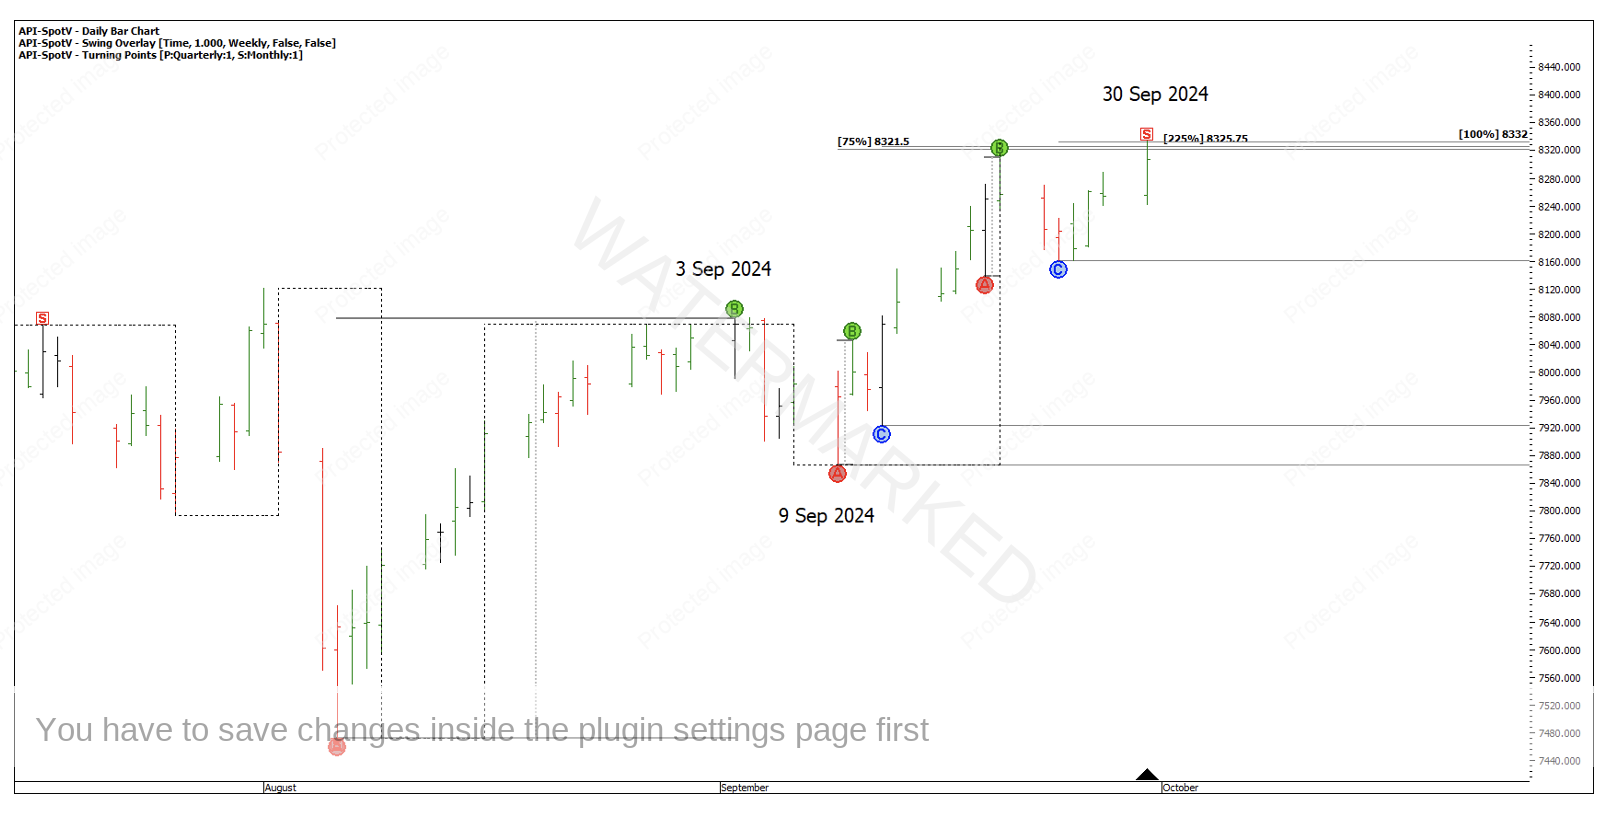
Chart 3 – 30 September Weekly Swing High
Following a contracting weekly swing up, I found the next weekly swing retracement has about a 70% chance of being an expanding swing down, with a weekly higher swing bottom often sitting on the previous weekly swing top or, pushing a bit further showing a bigger retracement.
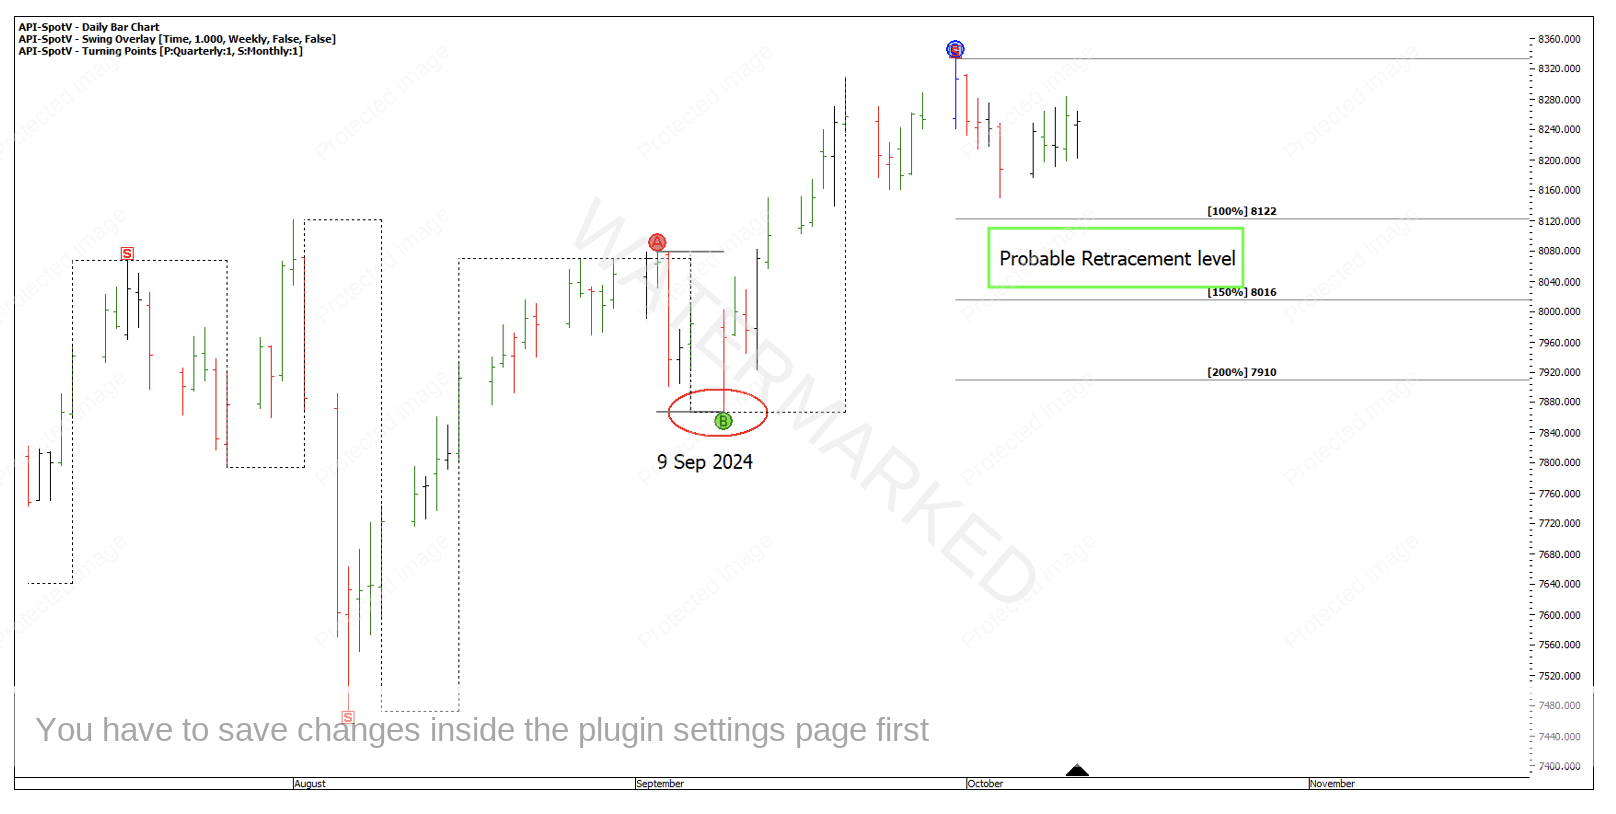
Chart 4 – Probable Retracement Level
However, that’s not what happened post 30 September. Not only was there a contracting weekly swing down, the 4 October weekly swing low was also at a 37.5% retracement and a little false break 2-day double bottom.
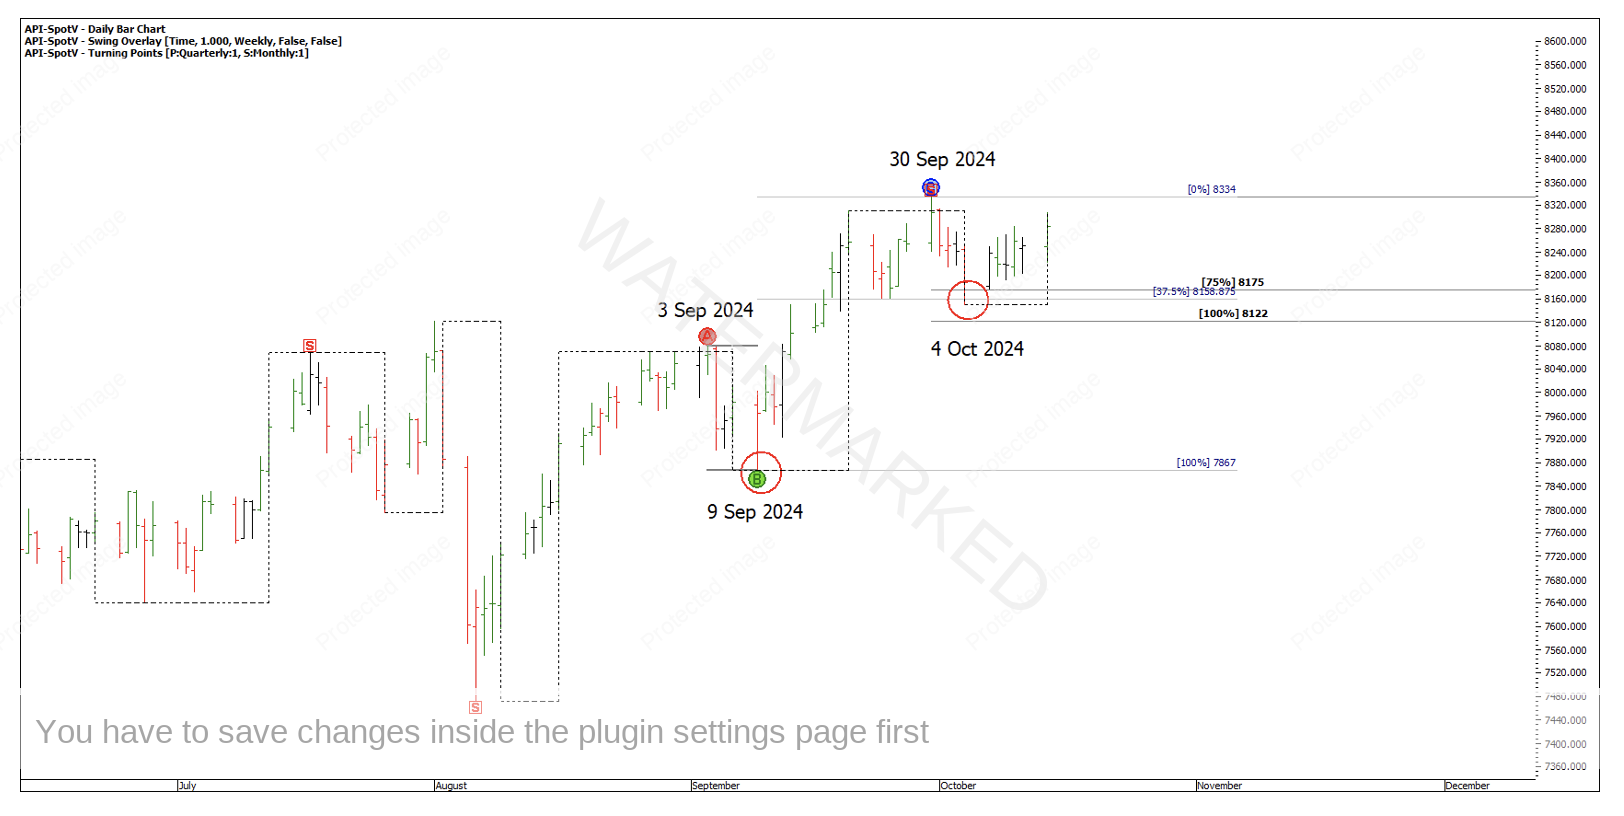
Chart 5 – 37.5% Weekly Swing Retracement
This pattern of 33% retracement – Contracting weekly swing – 37.5% retracement is somewhat rare and has only happened 3 times previously in the past 20 years.
So, what’s next? Due to a current weekly swing retracement of 37.5%, the chances of now seeing another contracting weekly swing up followed by an expanding weekly swing down is quite high, which could be an indication that a market was making a monthly swing top.
Of course there is always the potential for this, but there’s also a high possibility after the next weekly high of an expanding weekly swing down followed by a fourth weekly swing up.
Chart 6 below shows three previous times where similar situation has occurred.
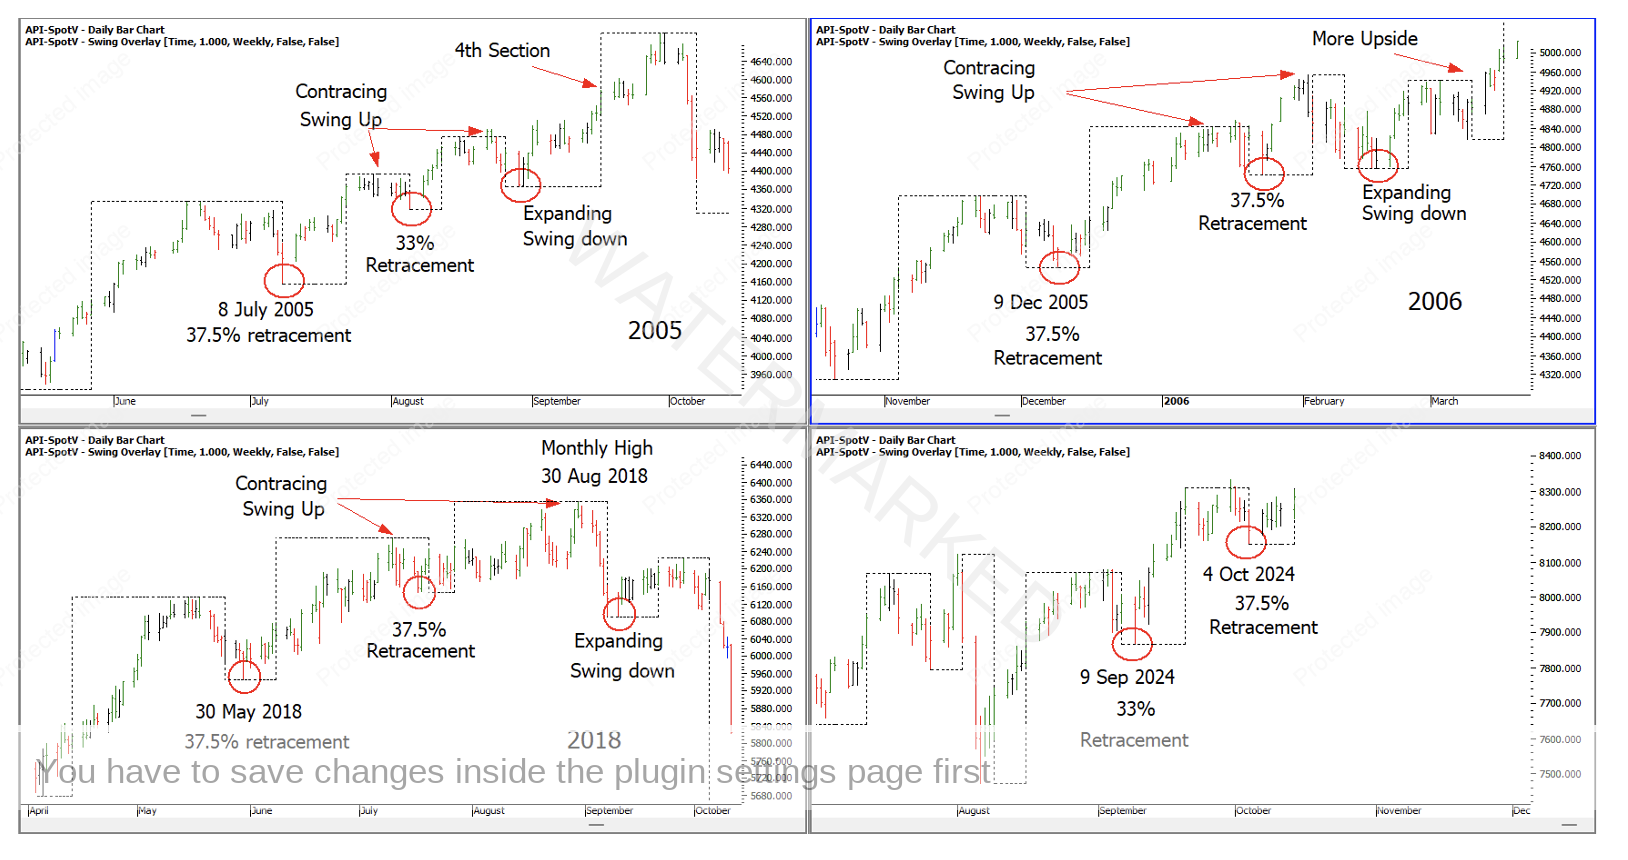
Chart 6 – Previous Examples
My long-term outlook hasn’t changed for some time, with so many markets breaking into All-Time Highs, it looks like the bulls are well in control with the monthly swing chart showing an expanding range to the upside and a less than 50% retracement.
I have shared this before, the comparison between now and exactly 20 years ago is very interesting.
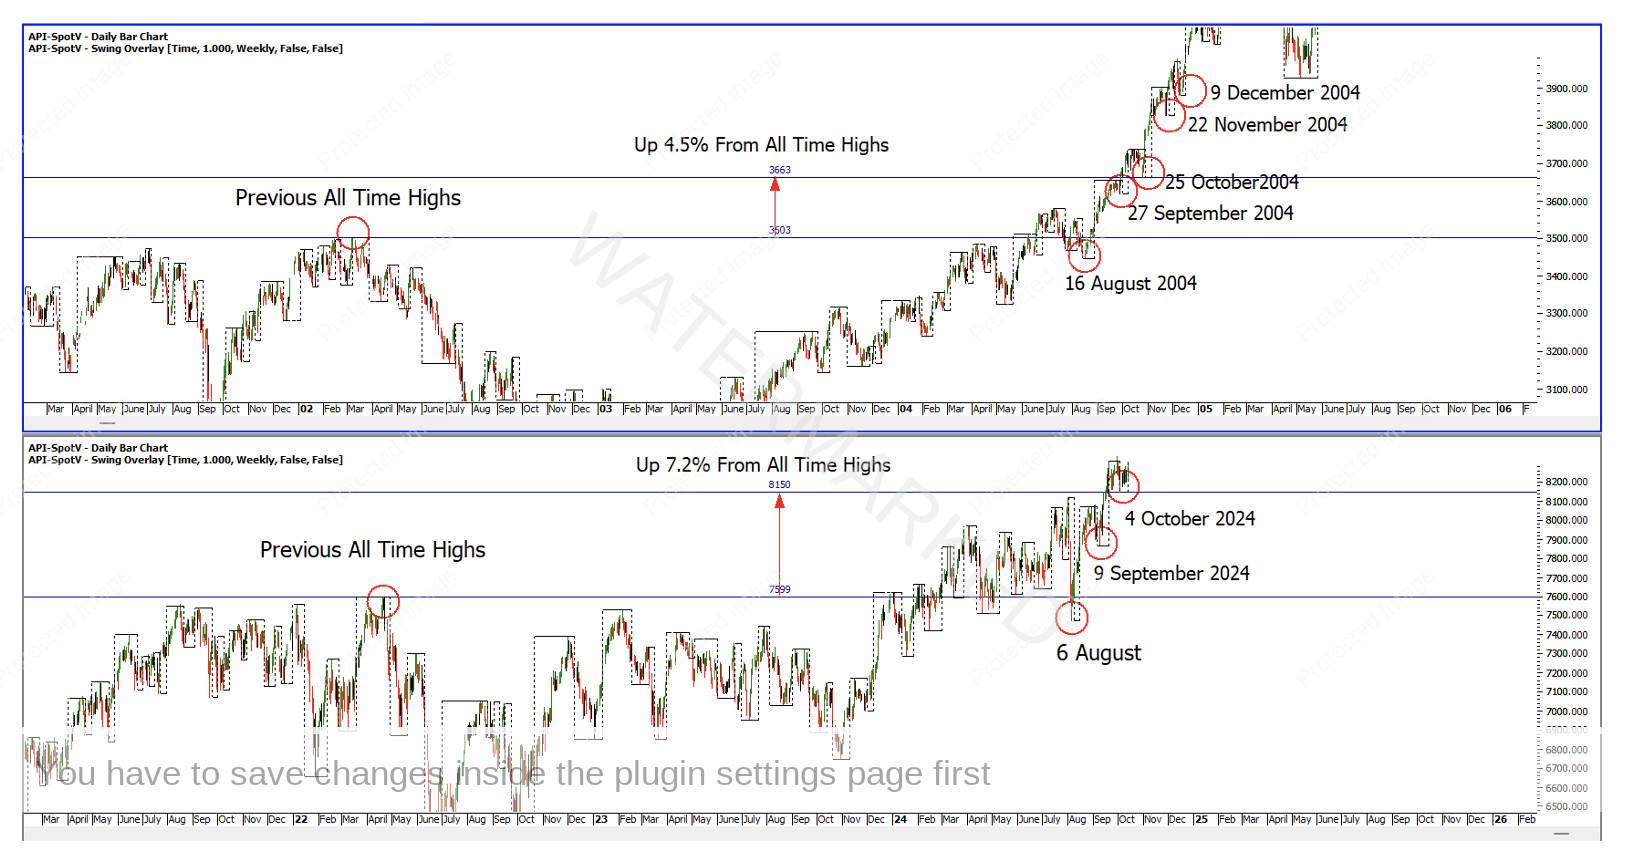
Chart 7 – 20 Year Time Cycle
Happy Trading,
Gus