Another Chart Type
This month’s article includes most of the usual items, like Price Clusters and Reward to Risk Ratio, but also considers the use of yet another type of chart. The case study is from the E-Mini Nasdaq Index futures market, and the long trade which occurred in this market out of the March 2023 low.
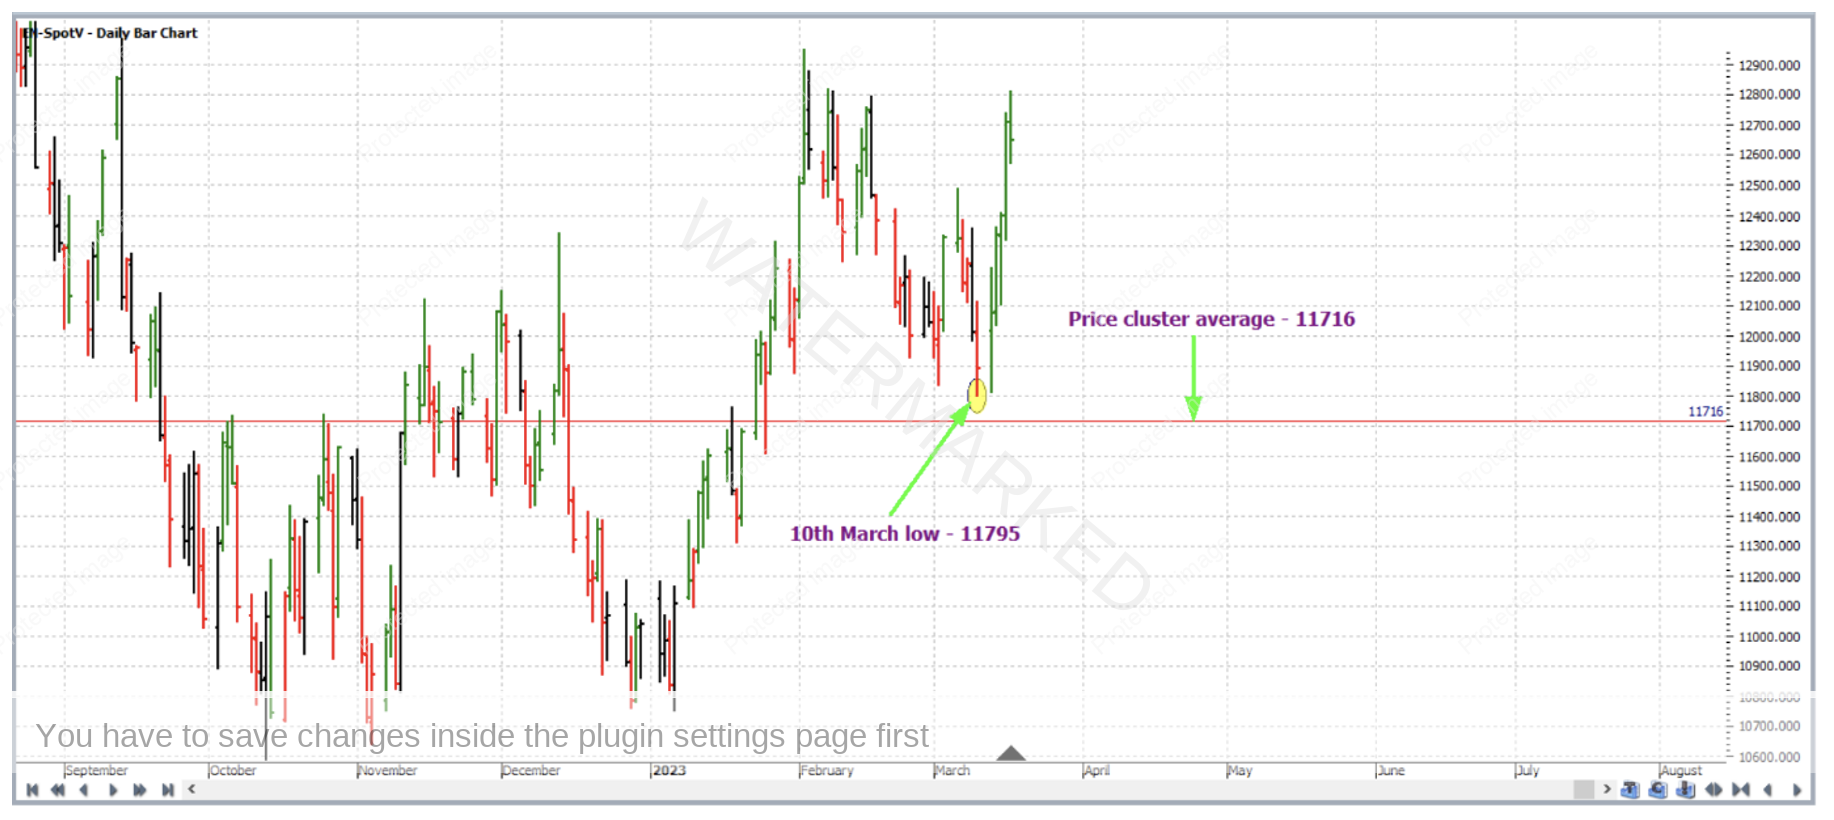
As of early March, three strong Price Forecasting elements pointed towards 11,716.00 as being a price level to watch for a reversal in the market. A strong reversal unfolded, and this is shown in two different charts below in Walk Thru mode in ProfitSource (the exact same turning points were used in the analysis on both charts to determine the cluster).
The first of these is our general default analysis chart type – the SpotV – in this case ProfitSource’s EN-SpotV chart symbol. This chart shows that the low occurred on 10 March 2023 at 11,795.00. Note that the market did not quite reach the price cluster average on this chart before reversing strongly to the upside. This would have you much less likely to enter a trade.
But was there really no trade? If you think about some markets (and currency futures are a classic example), there is extremely little difference between the SpotV chart and any other charts available for the given market. So, in those cases, it’s a matter of no, too bad, no trade no matter which chart of that market you look at if there is no trade on the SpotV. In other markets however (like certain commodities with considerable seasonal factors), you might still find a reason to trade from one of the other chart types which can and will often be quite different to the SpotV. So what about the stock index charts – does this ever happen?
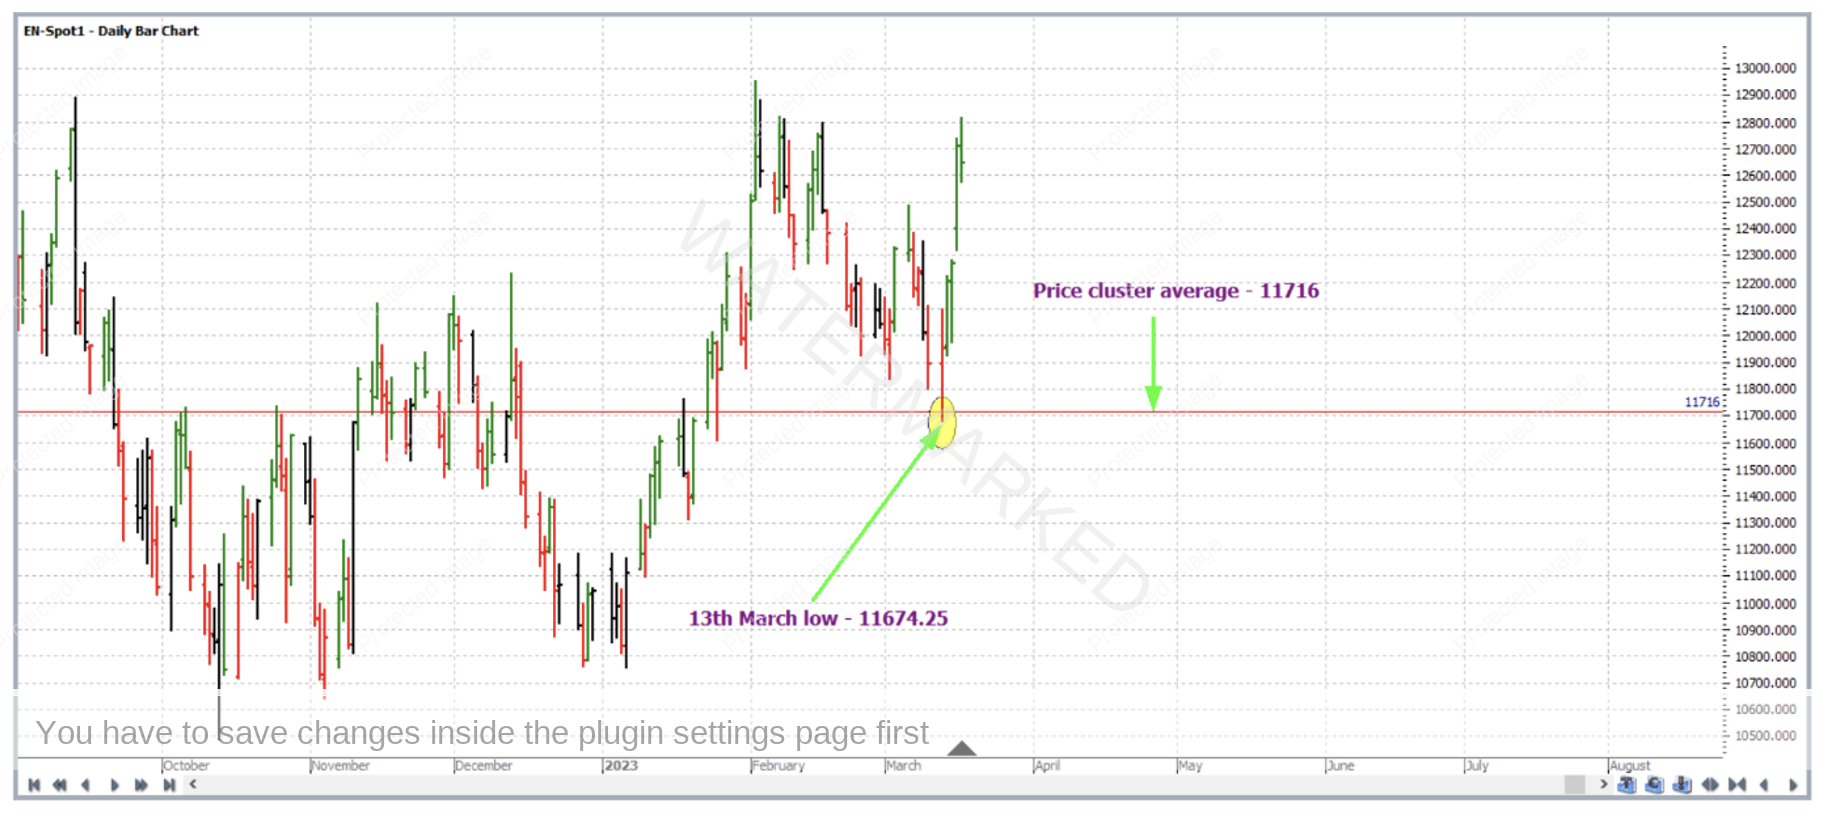
Below the same price cluster is shown on the E-Mini Nasdaq’s Spot1 chart – EN-Spot1. Spot1 charts draw data from a contract all the way until its expiry, which means that even after a contract no longer trades with the highest volume, for a little while it still contributes data to the continuous chart before expiring and allowing the next contract in line to contribute to the chart’s data. And enough testing on this type of chart in some markets can prove very useful. The one below shows that the low occurred on 13 March 2023 at 11,674.25; Note that the market in this chart did reach the price cluster average before reversing strongly to the upside, false breaking it by only a small amount hence presenting us with a reason to trade after all.
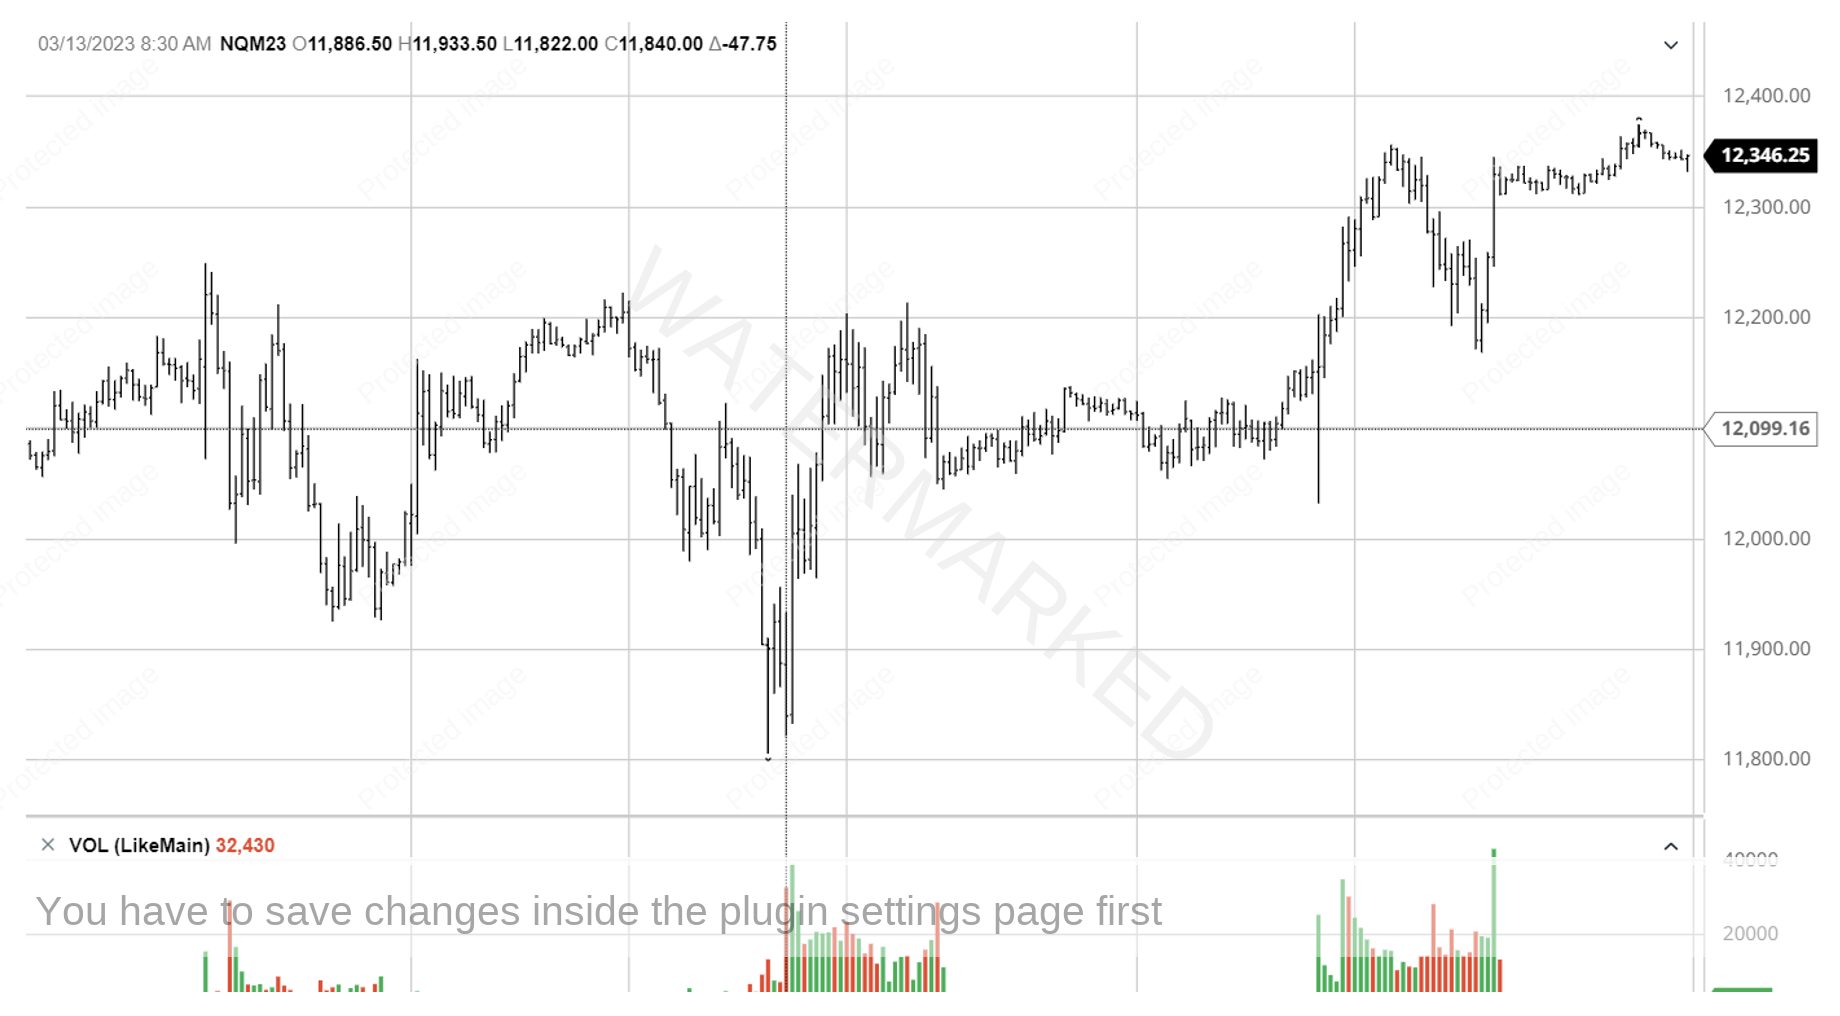
The actual low on the Spot1 chart came from the March contract data. But with the March contract losing volume and close to expiry, the entry signal taken was in the June contract. Shown below is the 15-minute intraday bar chart from barchart.com for the June 2023 contract. Taking a first higher swing bottom entry on this chart would have you long the Nasdaq Mini at 11933.75 with an initial exit stop loss at 11,821.75; note in the chart below that due to the high level of intraday volatility around the time of the low, the 15 minute bars were a lot larger than usual – making the entry signal that much stronger than your usual intraday entry signal on that chart, which was better if opting for large or maximum risk on the trade.
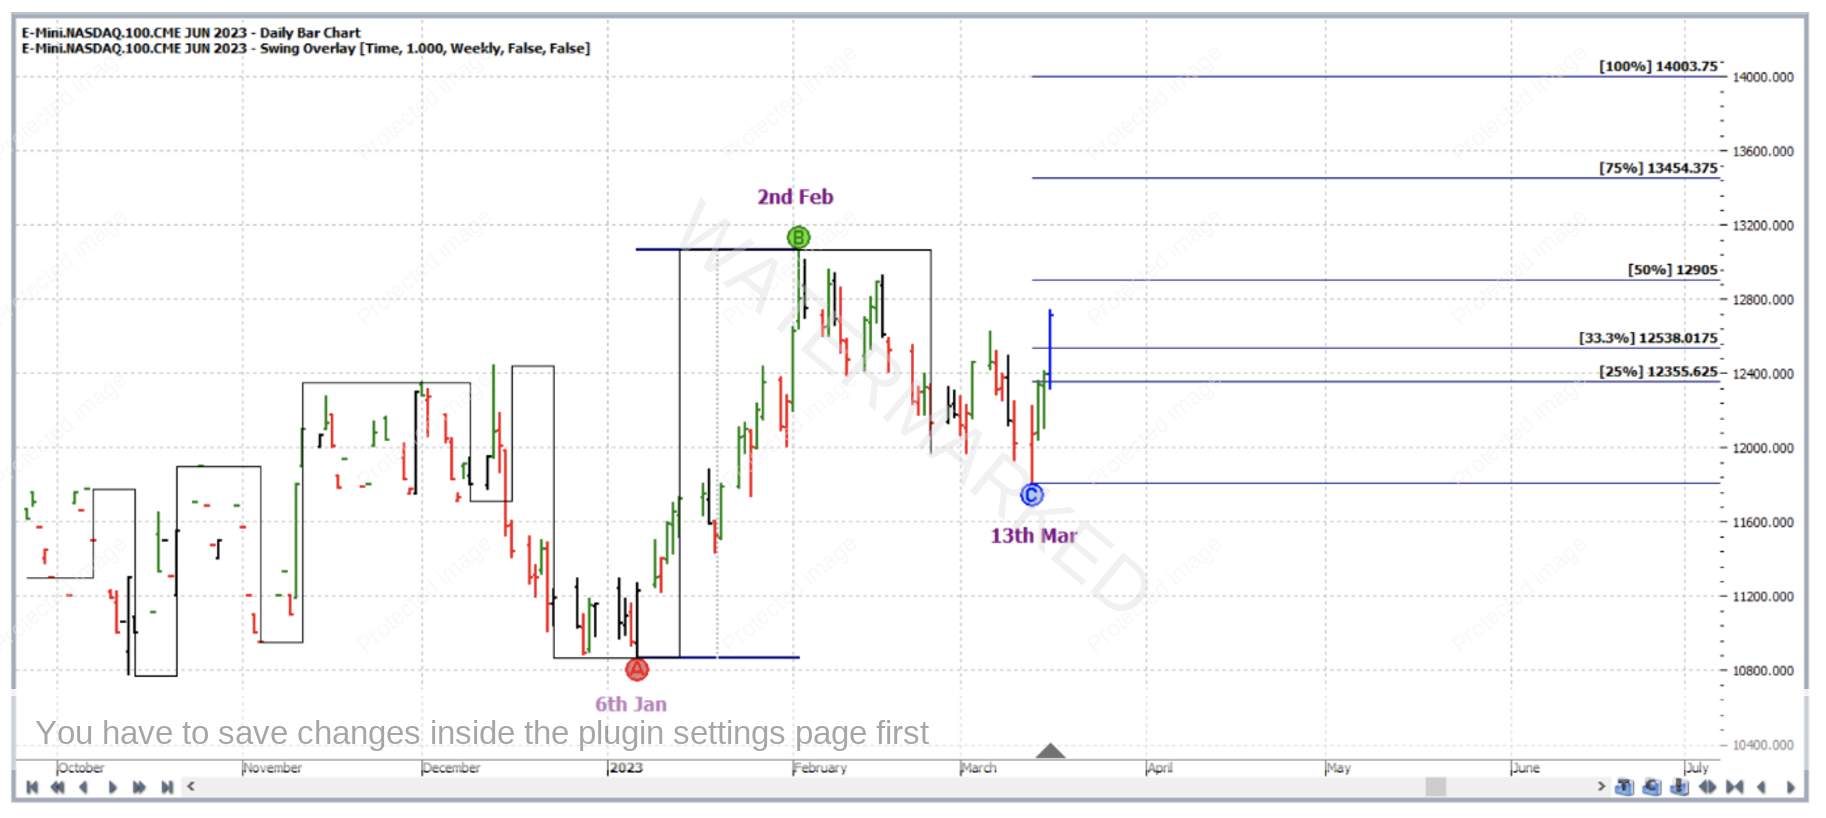
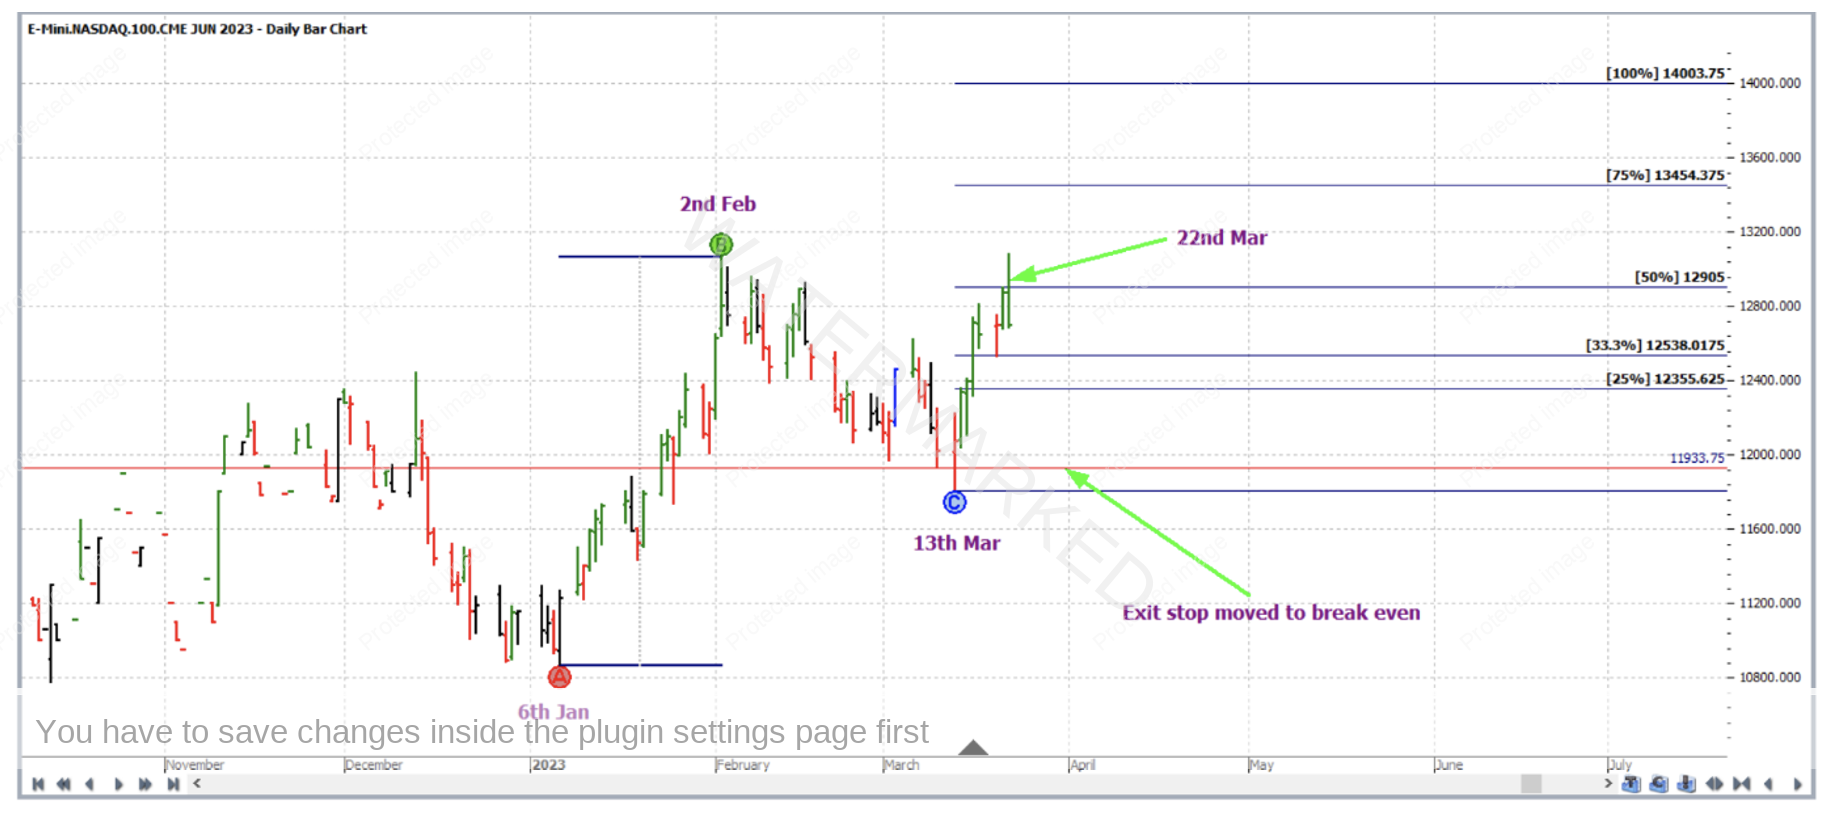
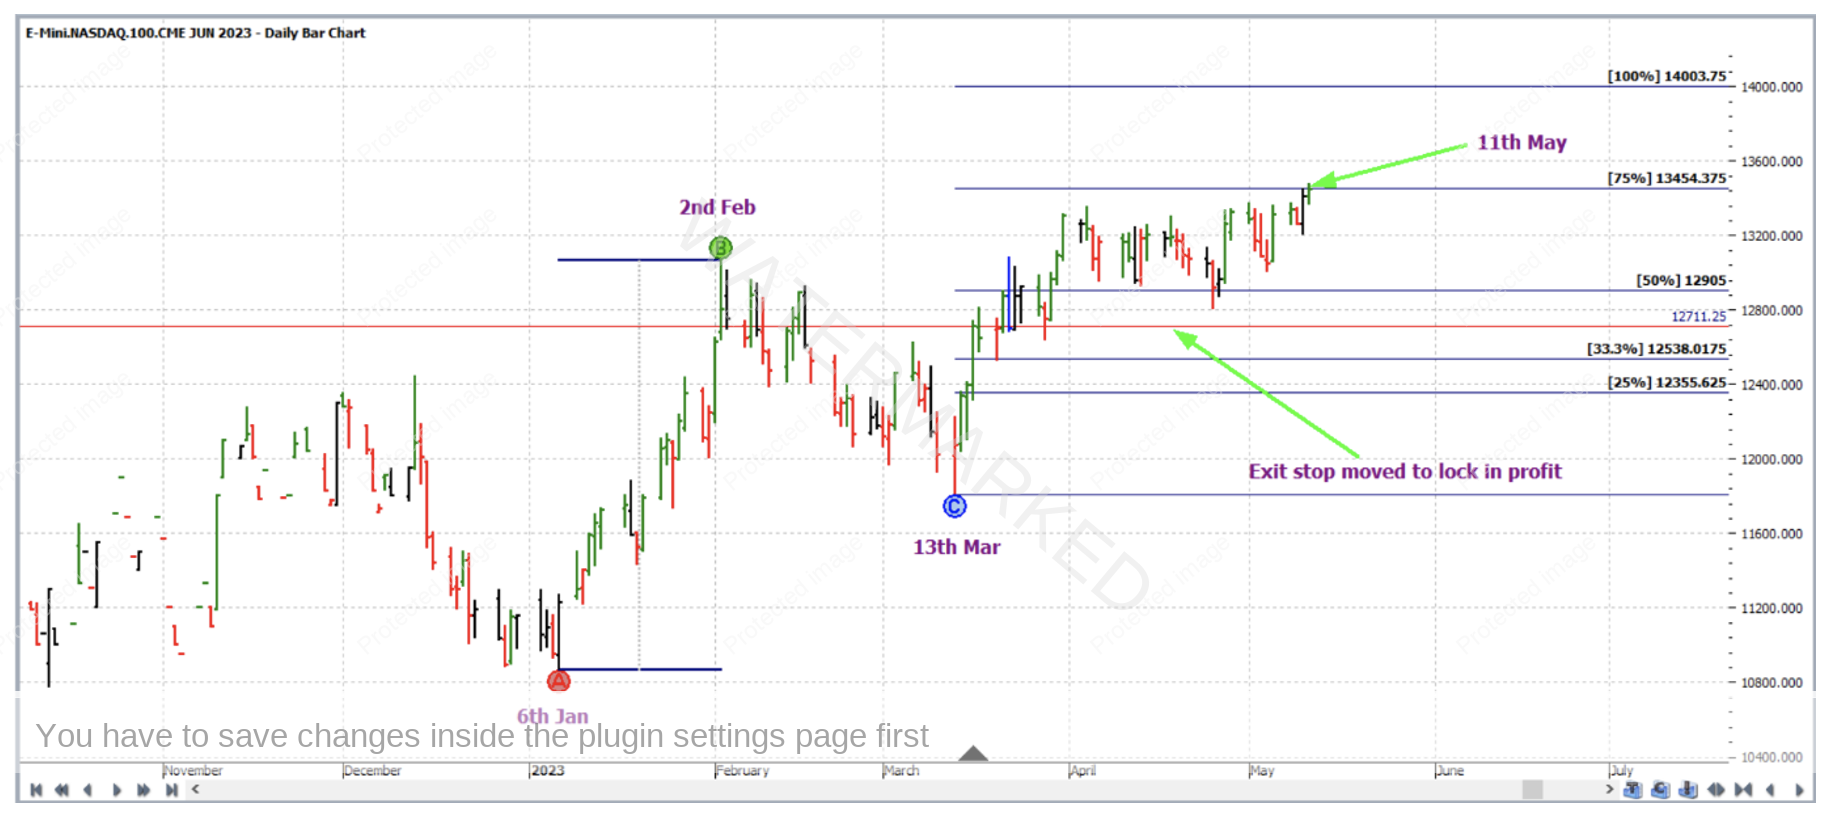
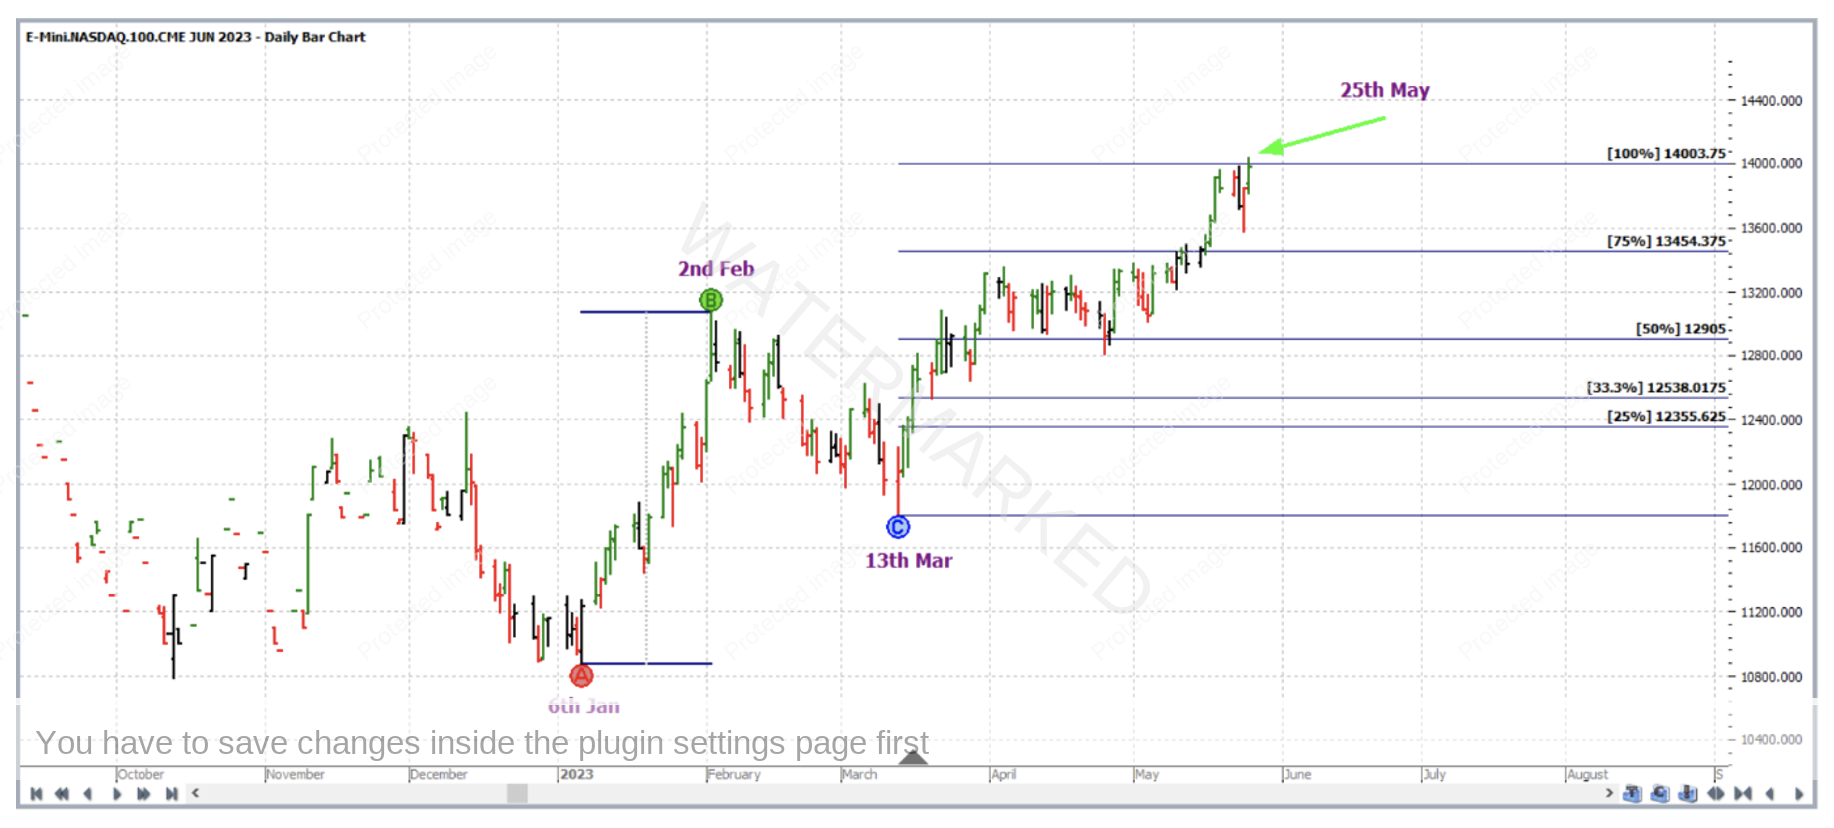
As for trade management, the last weekly swing in the same direction from the individual contract chart (EN-2023.M) was used as a reference range. Point A was the 6 January 2023 low, Point B the 2 February 2023 high and Point C the 13 March 2023 low. The trade was managed “Currency” style as though a large ABC.
On 22 March 2023, the 50% milestone was reached and exit stops were moved to break even.
On 11 May 2023, the 75% milestone was reached and exit stops were moved to one third of the average weekly bar range (based on the last 60 weekly bars) behind the 50% milestone to lock in some profit.
Then on 25 May 2023, the 100% milestone was reached and profits were taken at 14,003.75.
Now for a breakdown of the rewards. In terms of the Reward to Risk Ratio:
Initial Risk: 11933.75 – 11821.75 = 112.00 = 448 points (point size is 0.25)
Reward: 14003.75 – 11933.75 = 2070 = 8280 points
Reward to Risk Ratio = 2070/112 = approximately 18.5:1
Each point of price movement changes the value of one E-Mini Nasdaq futures contract by $5USD. Therefore in absolute USD terms the risk and reward for each contract of the trade is determined as:
Risk = $5 x 448 = $2,240
Reward = $5 x 8280 = $41,400
At the time of taking profit, in AUD terms this reward was approximately $63,500.
If 5% of the trading account was risked at entry the gain in account size would be as follows:
18.5 x 5% = approx. 93%
For much smaller minimum position sizes this market is accessible via CFDs.
Work Hard, work smart.
Andrew Baraniak
