Another Golden Opportunity
A quick recap on last month’s article, I had two price clusters I was watching on the SPI200 and I was keeping an eye out for a second contracting daily swing down into a higher bottom. See Chart 1 below.
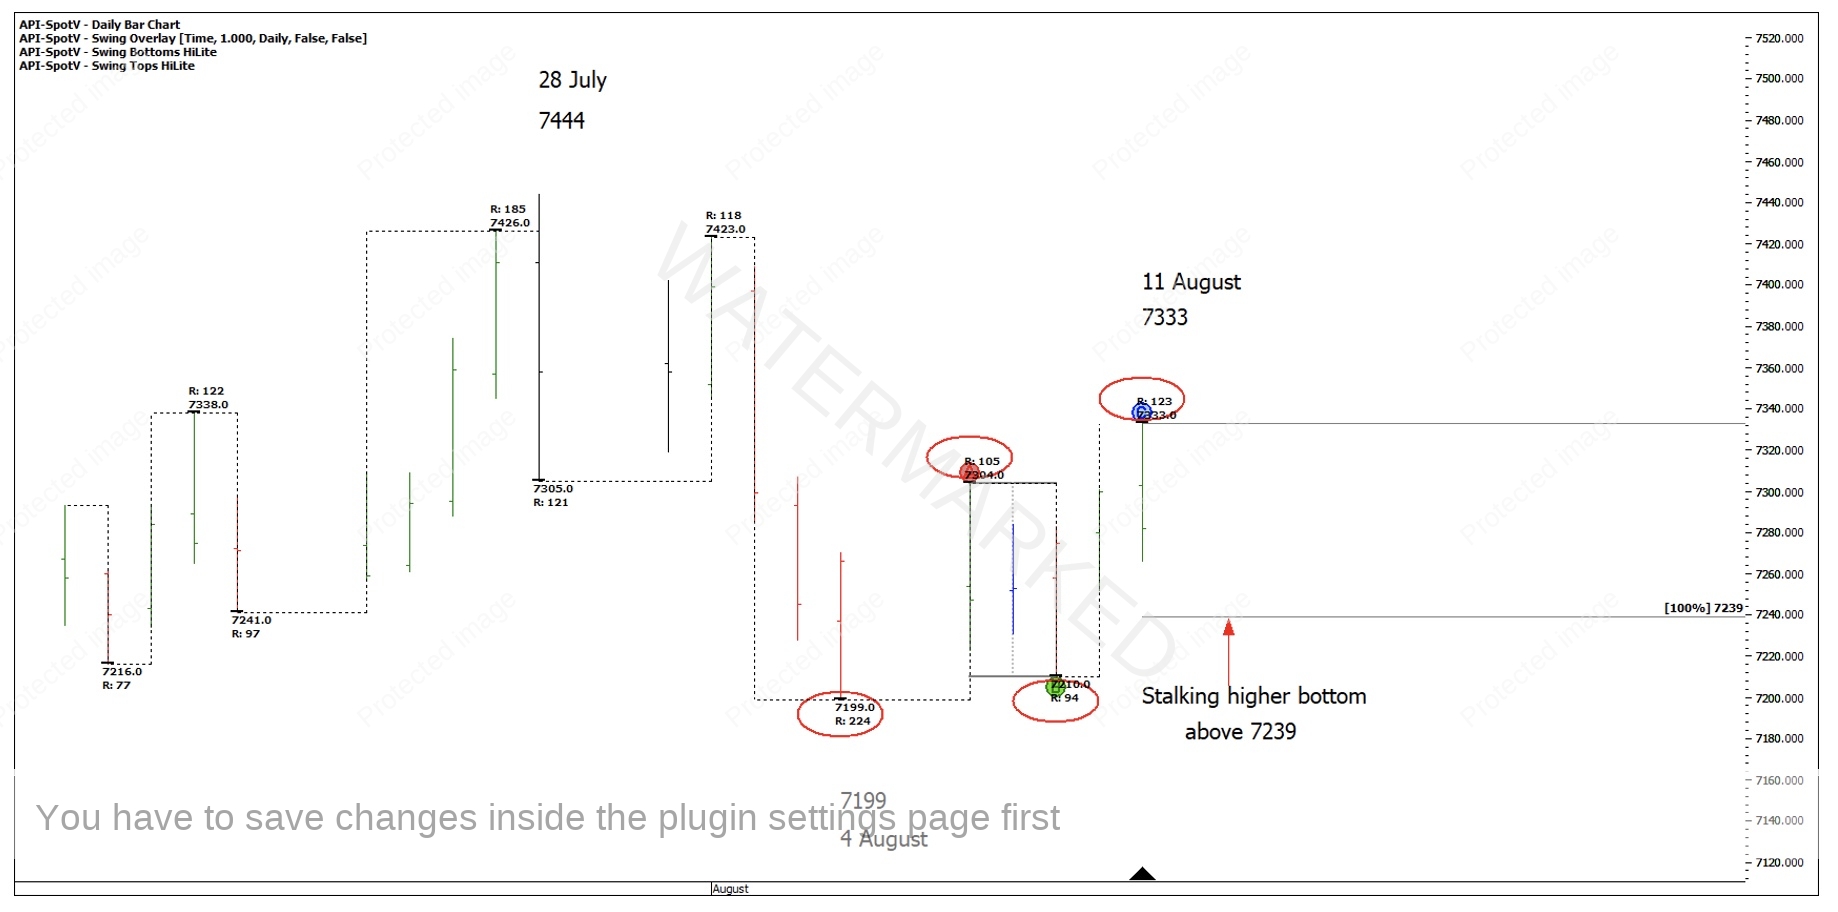
Chart 1 – August Trade Stalk
I was looking at the 4-hour swing for an entry above 7242 as that would have been a contracting 4-hour swing down in price and a contracting daily swing down in price.

Chart 2 – Contracting 4 Hour Price Swing
The SPI continued down to 7228 confirming an expanding 4-hour price and time swing down and an expanding daily swing down.

Chart 3 – Expanding Time and Price Swing
Sometimes you need to give the market a little bit of wiggle room when it comes to price if you have a contracting time frame, but if you have an expanding time and price swing or section, more often than not, it means there is more to come. So now, I move on to the next setup.
There is always another setup approaching. David Bowden said he considered the start of the year as Zero degrees Aries, in other words, the March seasonal date. 180 degrees from then gives us 23 September which just happens to be a weekend. So either the 22 or 25 September would be the Friday or Monday.
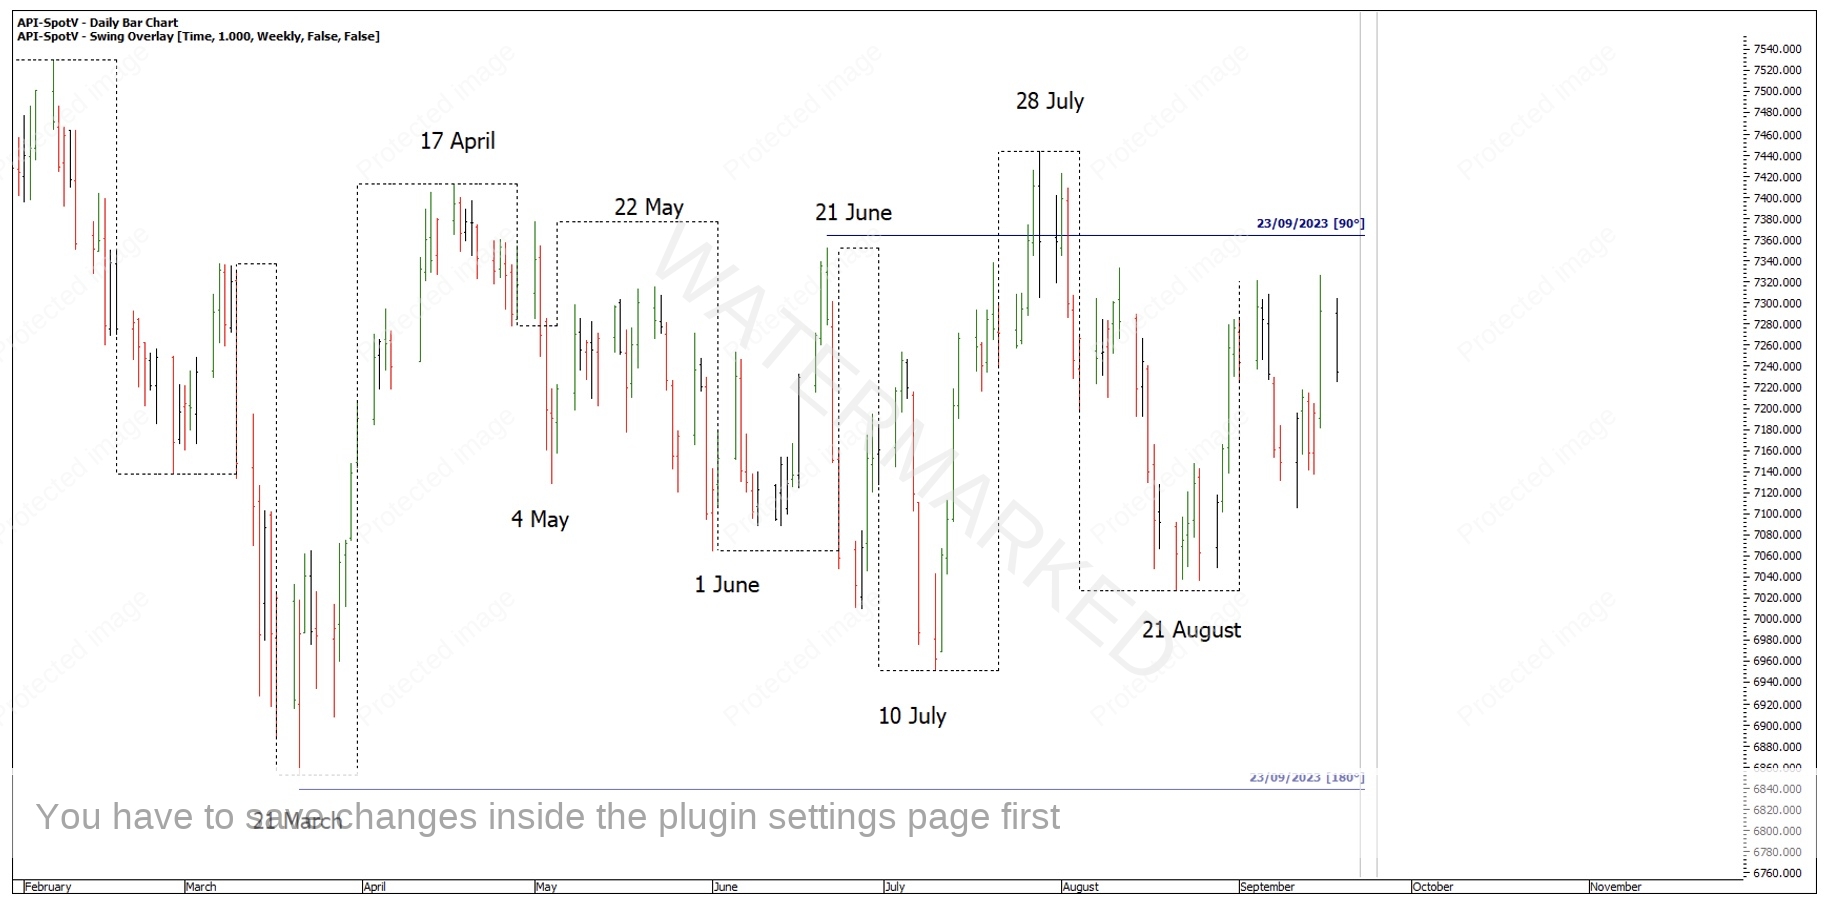
Chart 4 – Next Time by Degrees Pressure Dates
Weekly balancing of time shows the previous week was 14 days up then 7 days down. Another 14 days up would also be 25 September.
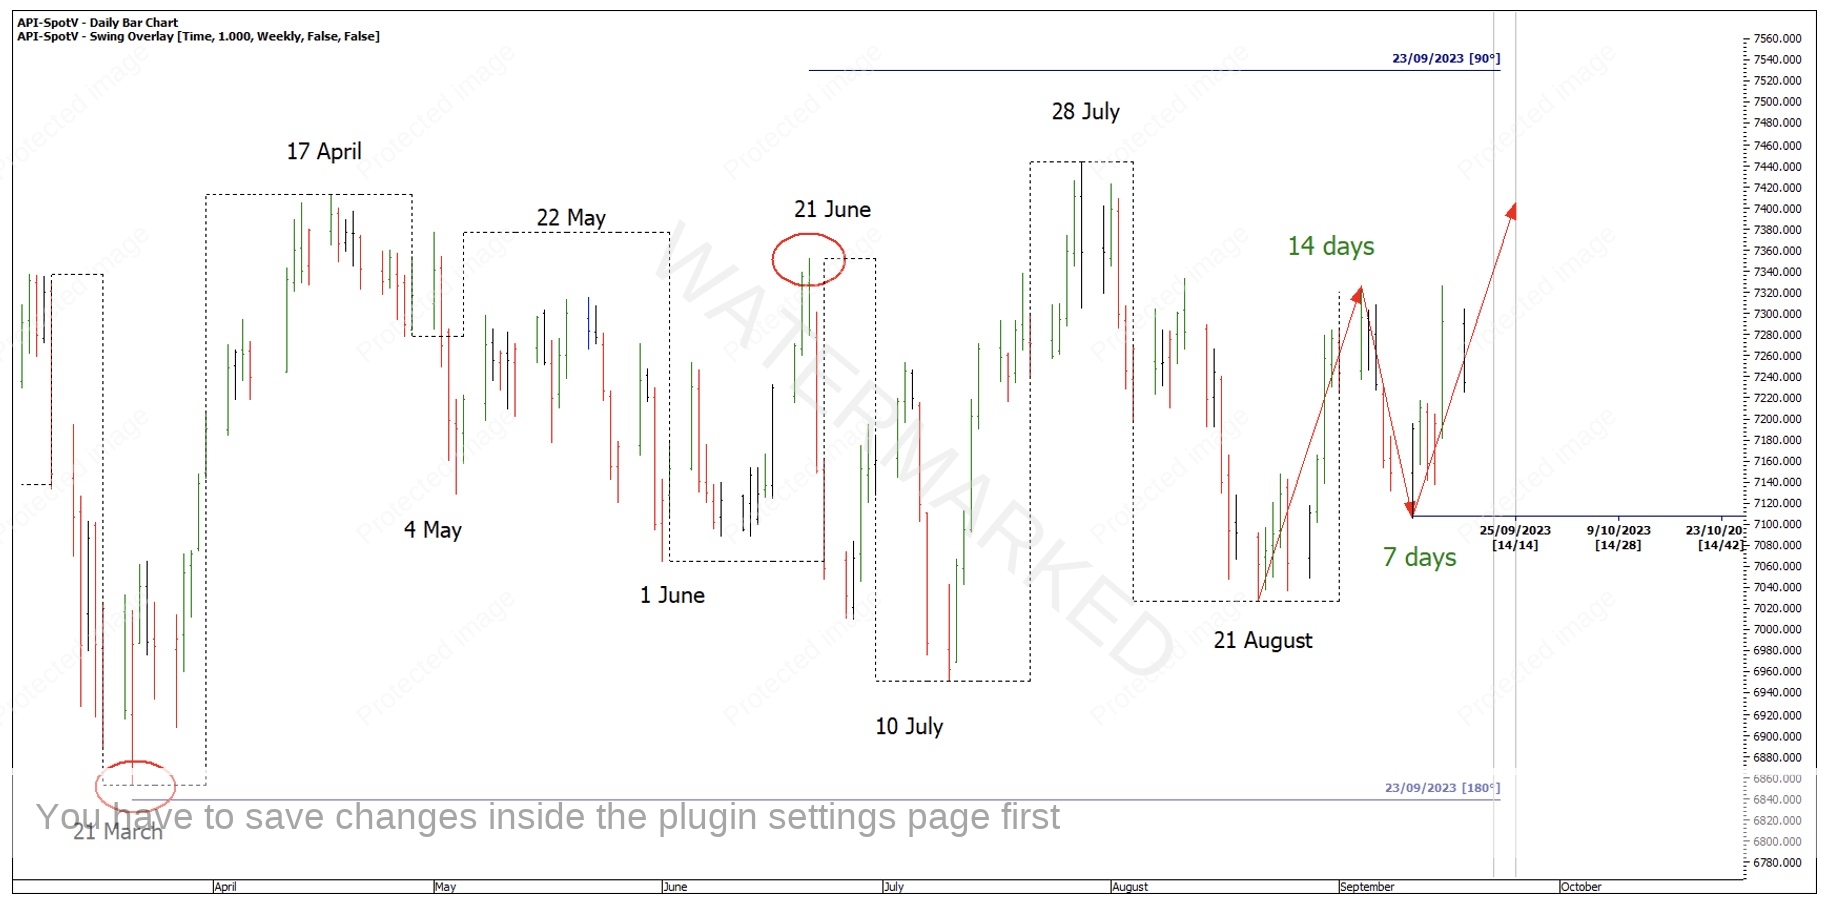
Chart 5 – Time Balance
Another bottom you can run Time by Degrees from is the 27 March higher bottom as you can argue this is where price really moved away from. 180 degrees later gives Friday 29 September as another place to watch. Although, 27 March is 6 degrees 34 in Aries, whereas the 27 February and 1 June lows are a bit later at 8 degrees and 10 degrees, which could push the date out to early October.
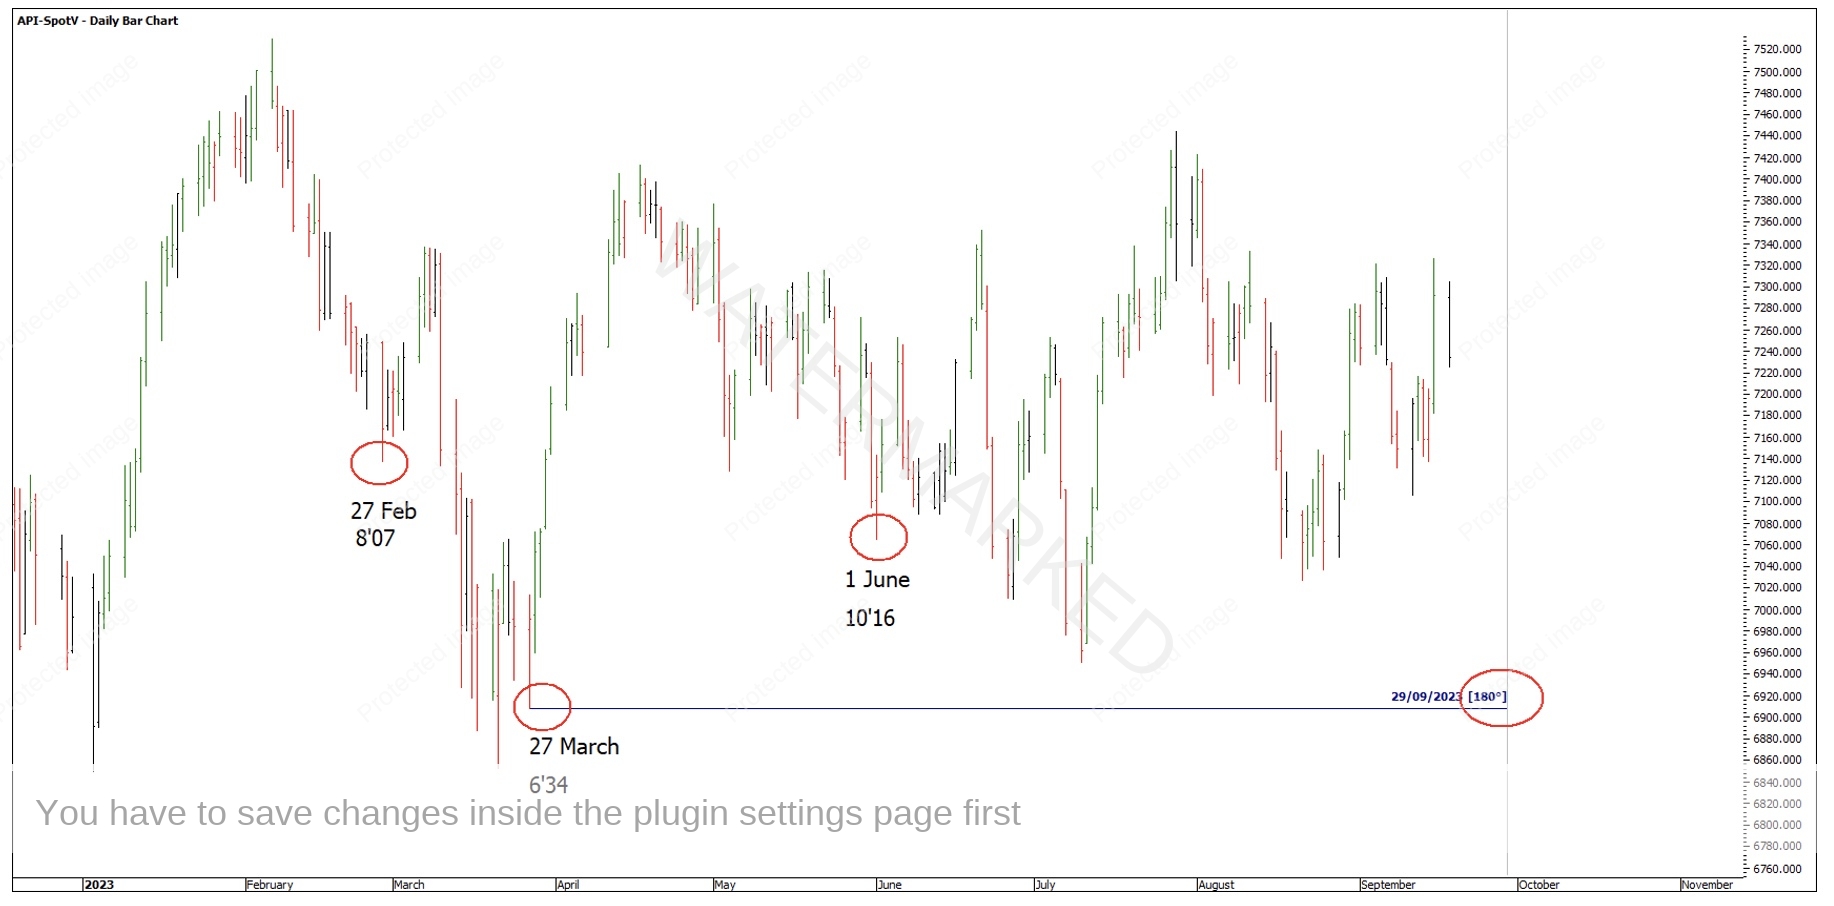
Chart 6 – Alternative Time by Degrees Date
As I can’t see one overwhelming clear price cluster, I’ll be marking up all the ranges on my hand charts and narrowing down to the smaller time frames as the market approaches and be gauging the markets strength or weakness at the time. I believe the market may run up into this pressure date, but I also keep my mind open that if a low is made around this time, then perhaps it’s a long trade rather than a short trade.
Moving on, I want to look at a recent trade on Gold, and in particular, the short trade out of the 1 September top. On the big picture analysis, there was a false break double top that occurred in May 2023. The quarterly swing range up in price was expanding however, the quarterly time swing was an exact 50% of 182 days compared with 365 days.

Chart 7 – Gold Double Tops
Breaking down the last quarterly range into its monthly swings, there was a contracting monthly swing up in time and price. In this case, time was more obvious than price was, but I shall leave you to contemplate the chart below.
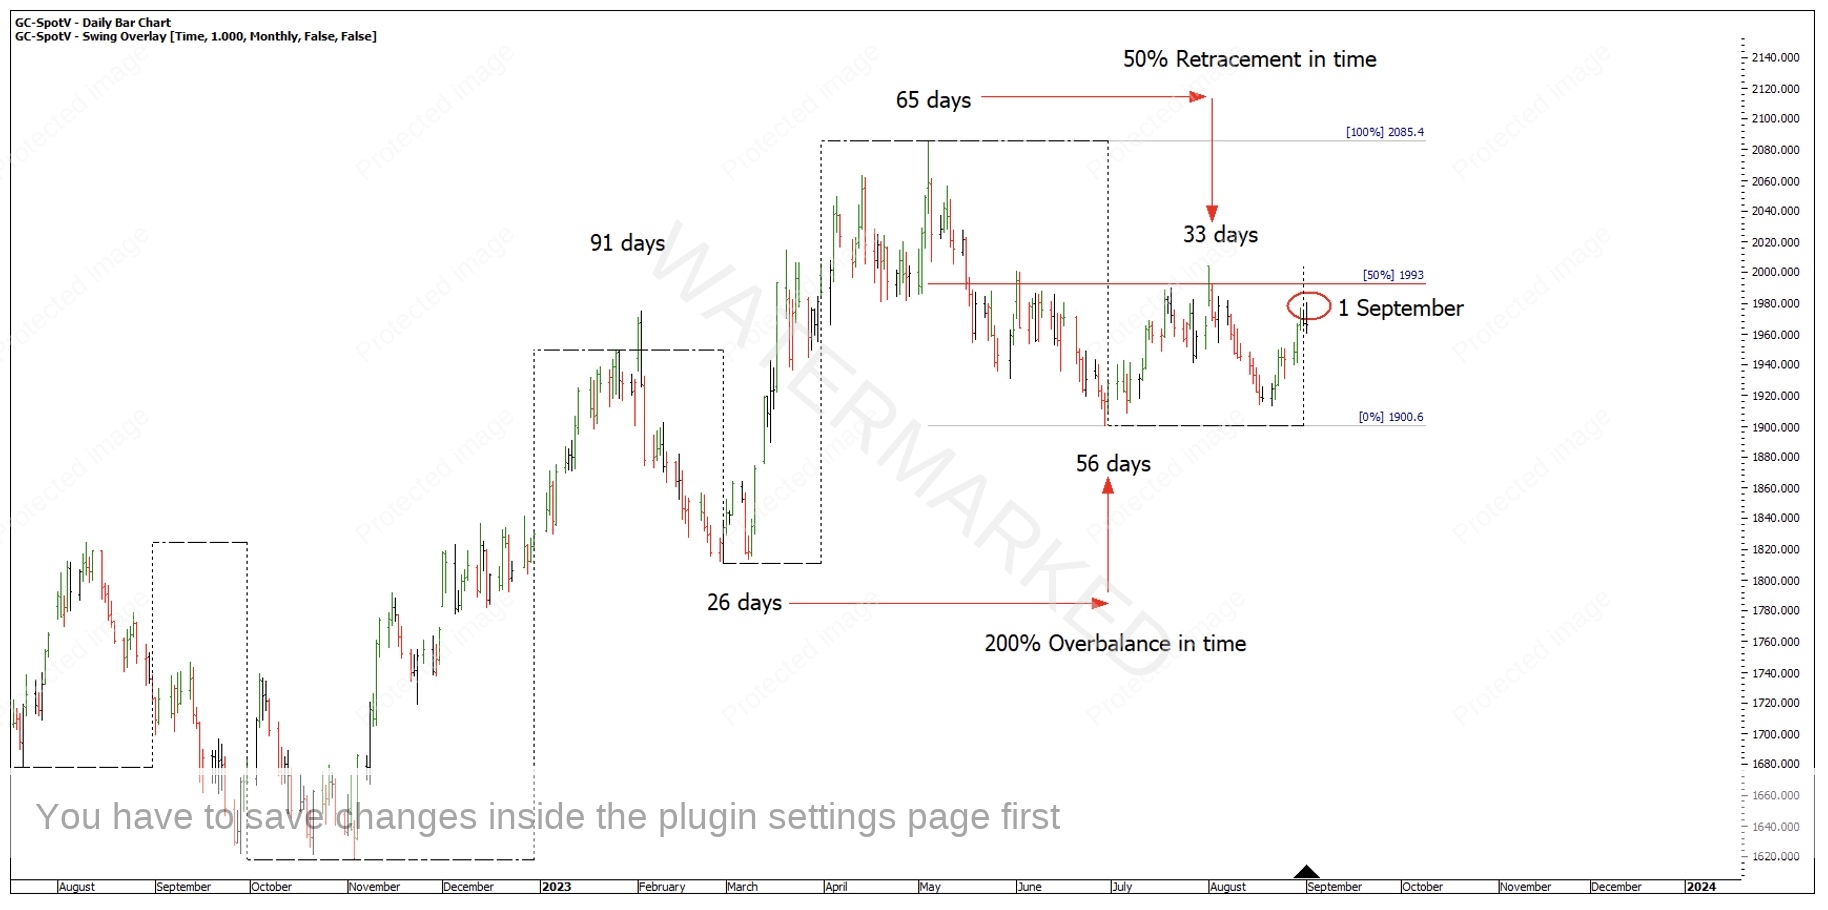
Chart 8 – Time Swing Ranges
After the monthly swing high on 1 August, Gold put in a weekly Overbalance in Time and Price to the downside followed by a 50% time retracement into 1 September, and not only that, it was three daily swings up. (You need to look at the intraday charts to see how that unfolded).
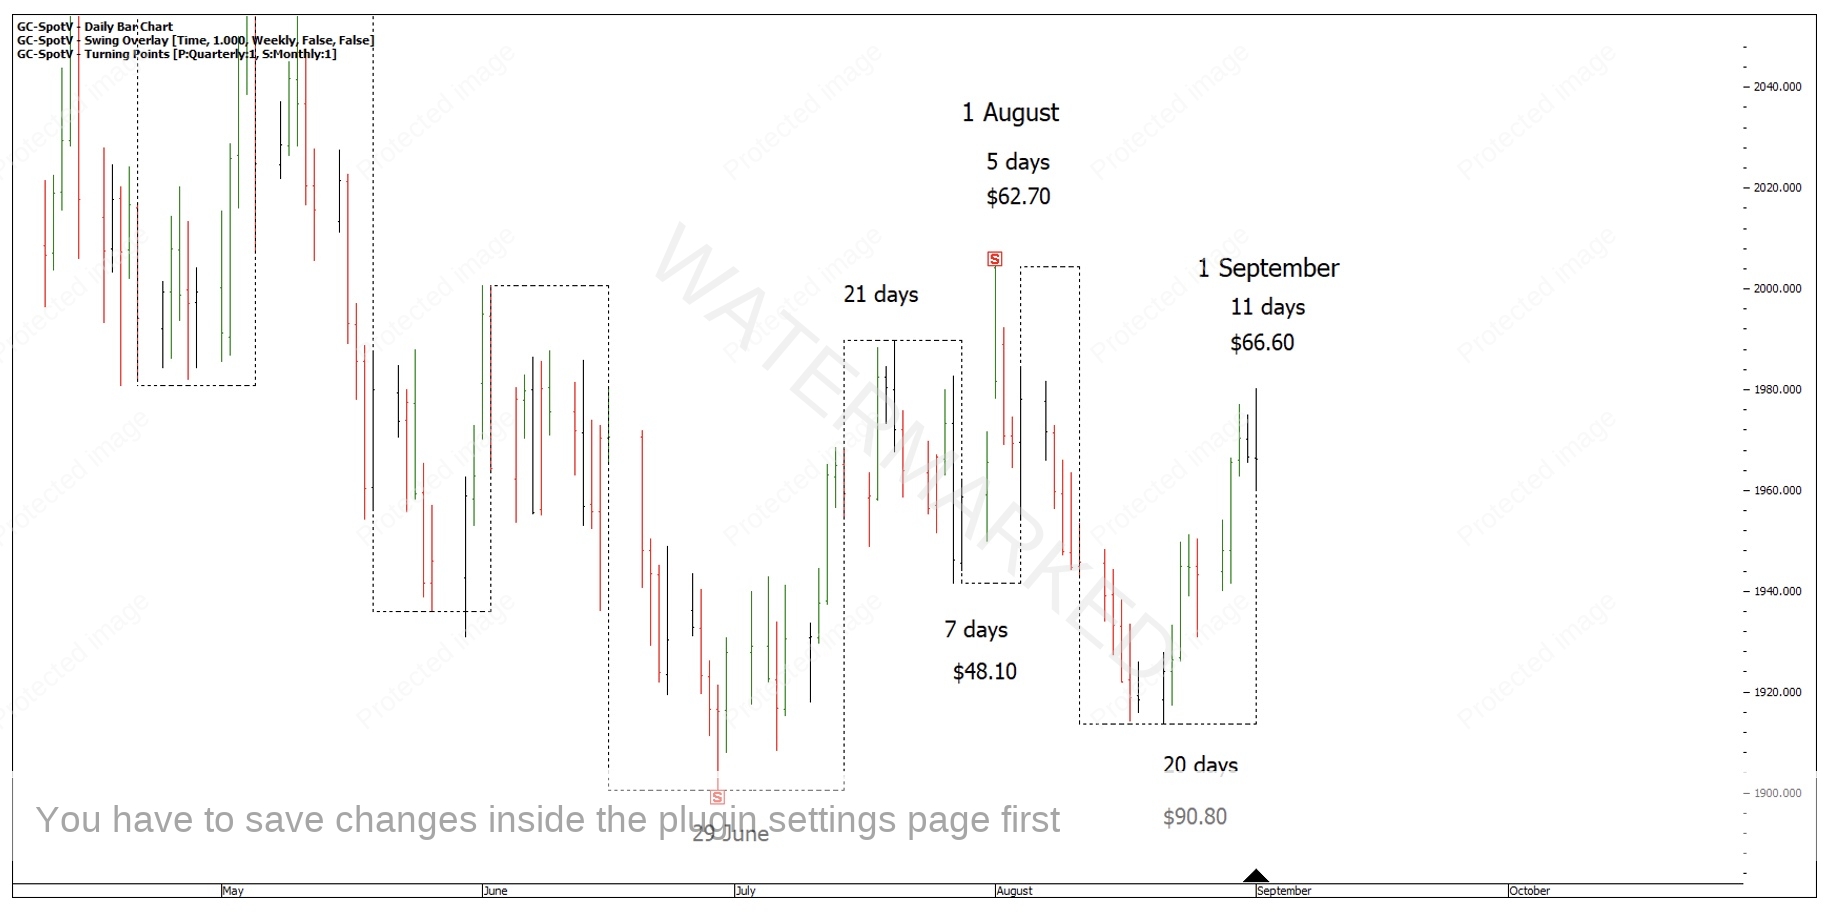
Chart 9 – Gold Weekly Swing Chart
The extreme top on 1 September was a large range 4-hour bar, however it was after the 4-hour Overbalance in Price and then the Re-test that gave you a small 4-hour bar risk on entry of only $4.00.
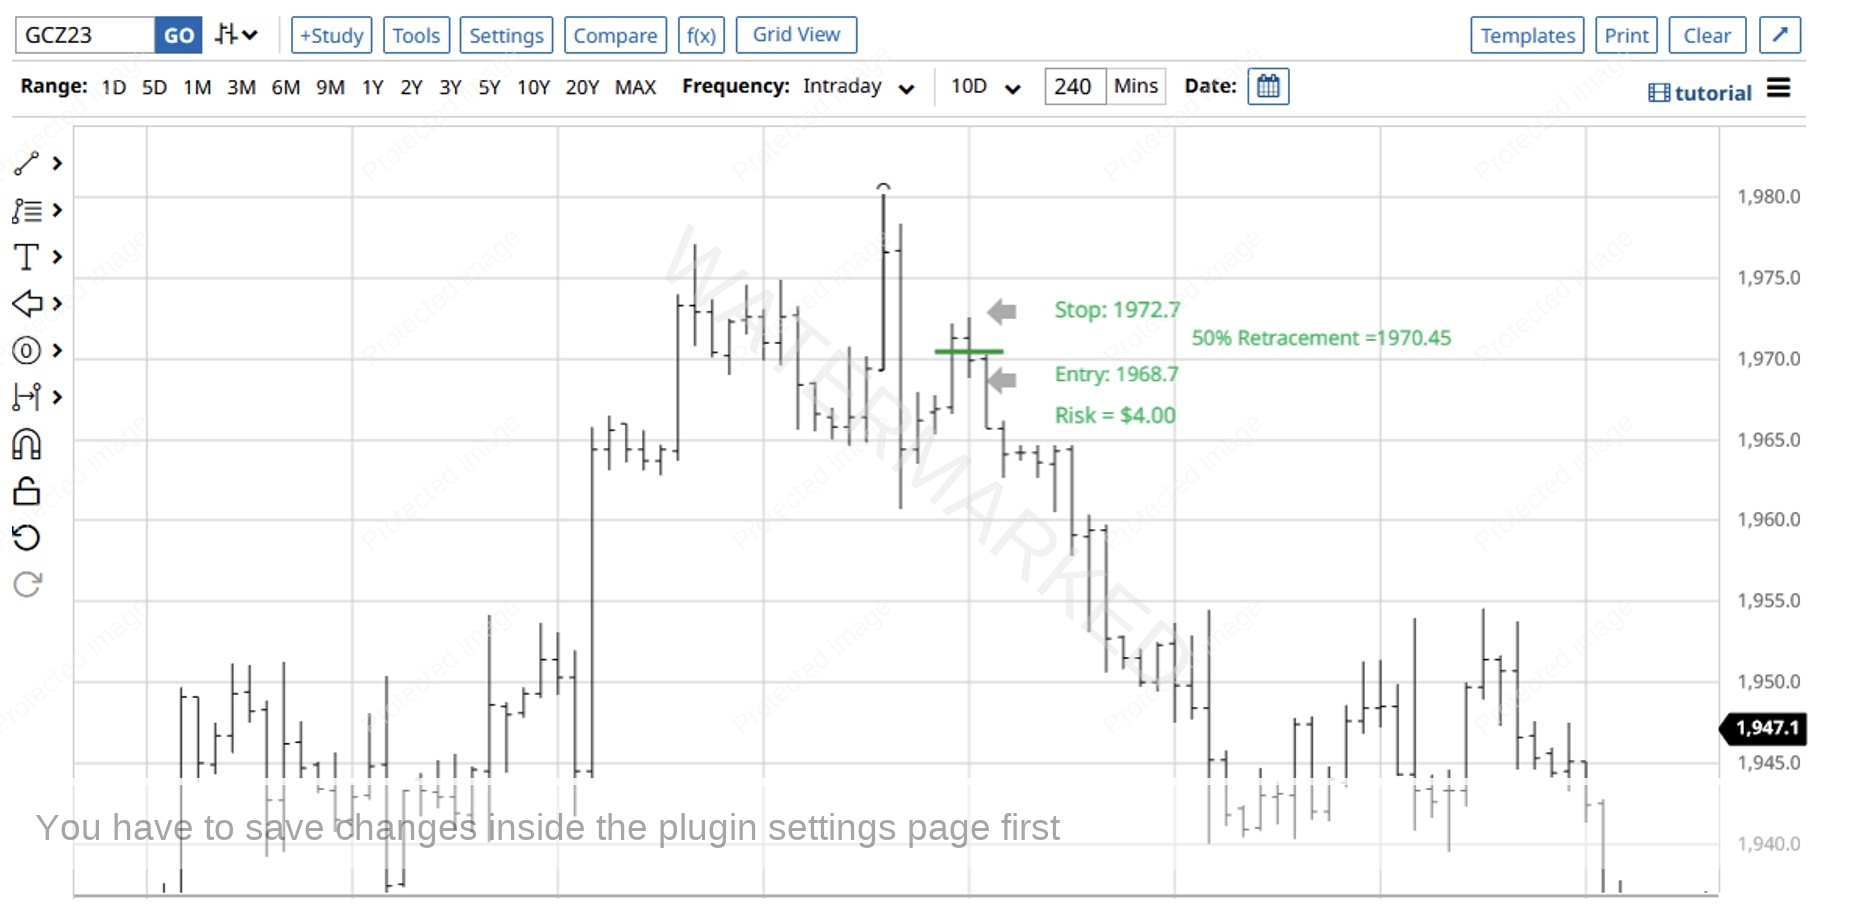
Chart 10 – 4 Hour Retest
At the point of writing on 18 September, by this stage you could have easily banked a 10:1 Reward to Risk Ratio trade, but it’s also worth looking at the 1-hour bar chart for a potential smaller risk entry. This 1-hour swing chart shows three clear sections up. I liked the entry as the previous 1-hour swing low was broken at 1970.2 because that confirms a failed up swing and also confirms the market is overbalancing in price to the down side.
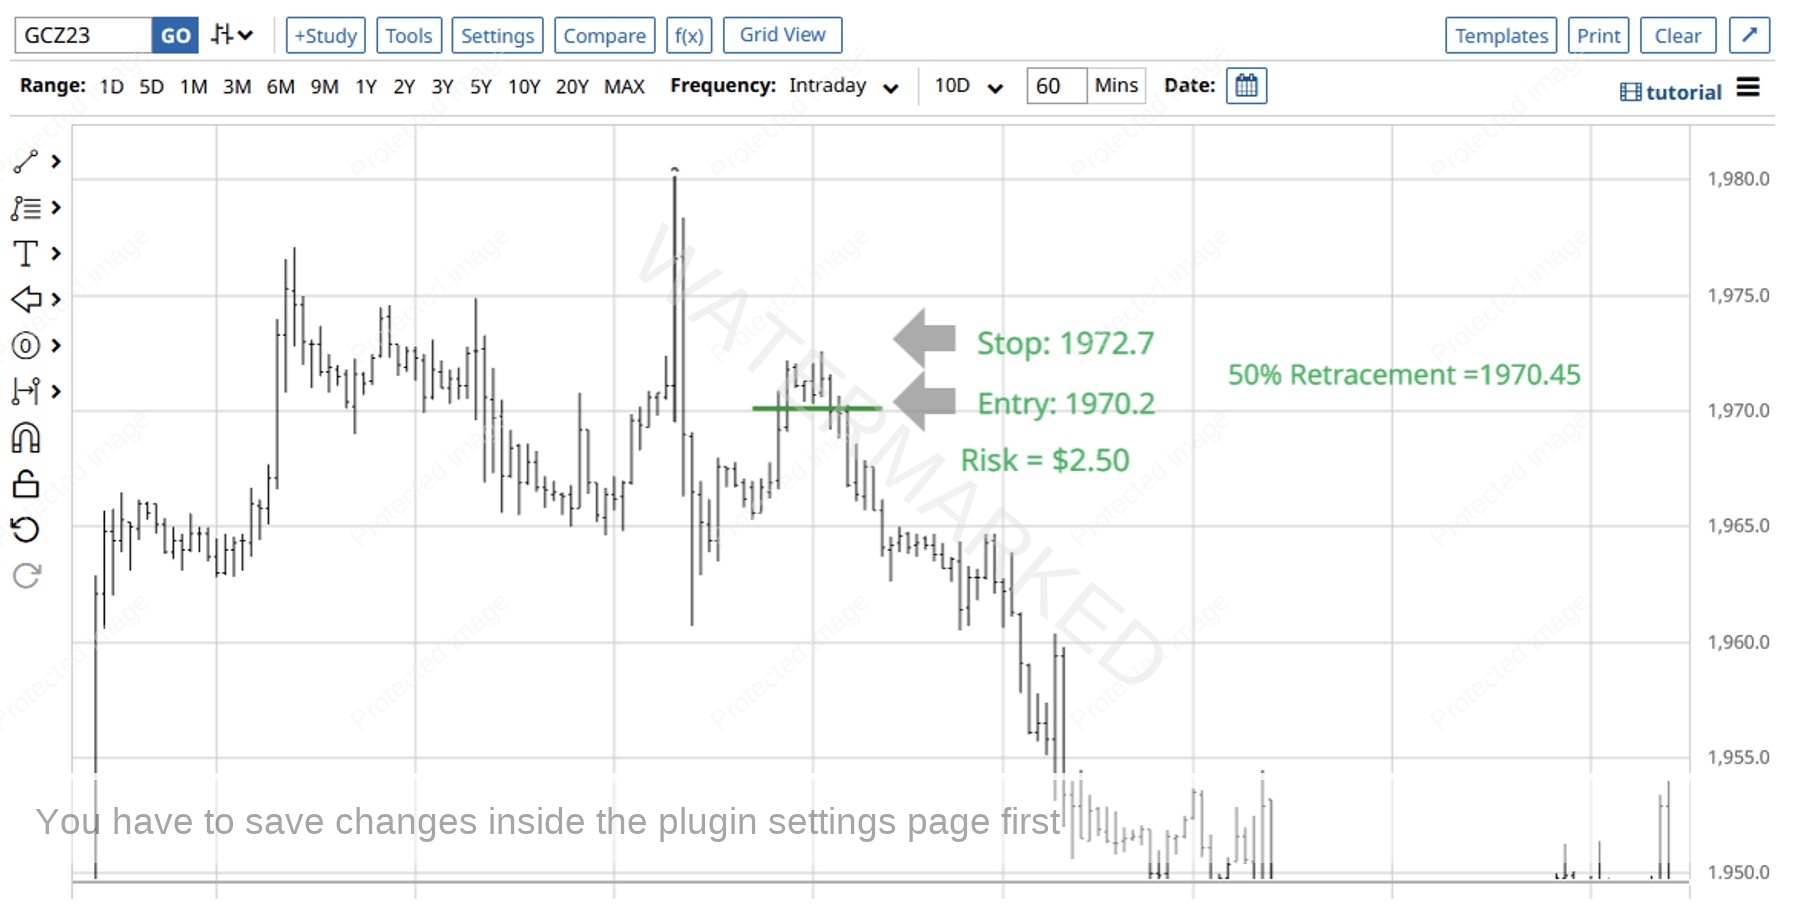
Chart 11 – 1 Hour Swing Entry
There are no rules saying you must stay in a trade for a long time, sometimes staying in the market for 7-14 days is long enough and allows you to bank a good profit before waiting for the next clear trading opportunity.
Happy Trading,
Gus Hingeley