Another Trading Plan
This month’s article will combine two concepts from the Number One Trading Plan manual. The first is an example of a trade entry technique known as the First Lower Swing Top. This entry technique is taught on page 109. The second concept is about trade management after entry, by use of Trailing Swing Stops. This idea is taught on page 72. Together these two techniques can help us devise a definitive trading plan which advances beyond a standard ABC trade. The main prerequisite for understanding this article is the Swing Chart Construction rules as detailed from page 77 onwards in the latest version of the Smarter Starter Pack.
The case study here is from the Soybean Oil futures market (continuous chart symbol NBO-SpotV in ProfitSource). The 25 February 2019 top in this market came in at 31.16 US cents per pound. Let’s examine the entry parameters for a short trade out of this top. I will use ProfitSource in Walk Thru mode in this article.
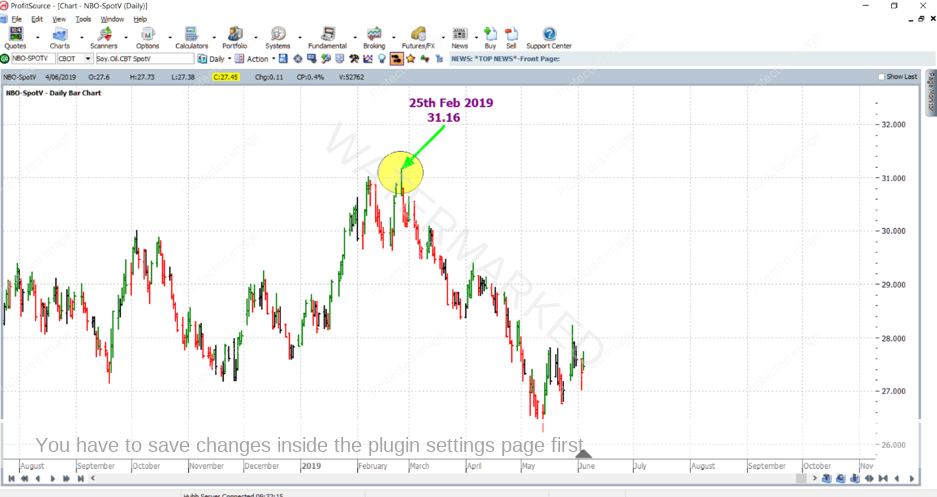
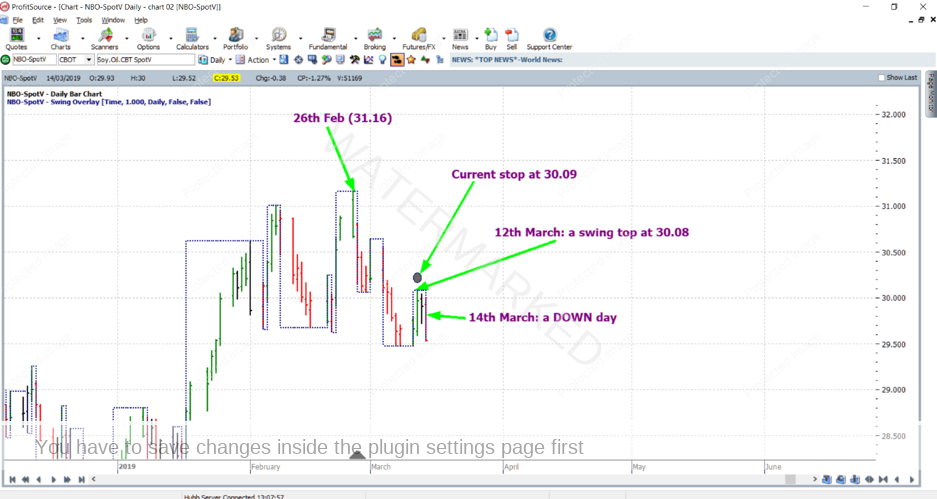
Zooming in, and with the use of the Swing Overlay Hi-lite, we see that on 25 February, at 31.16, there is a swing top in the swing chart. This swing top had been confirmed when on the following day, the 26th, the market gave a down day. All very basic swing chart theory so far.
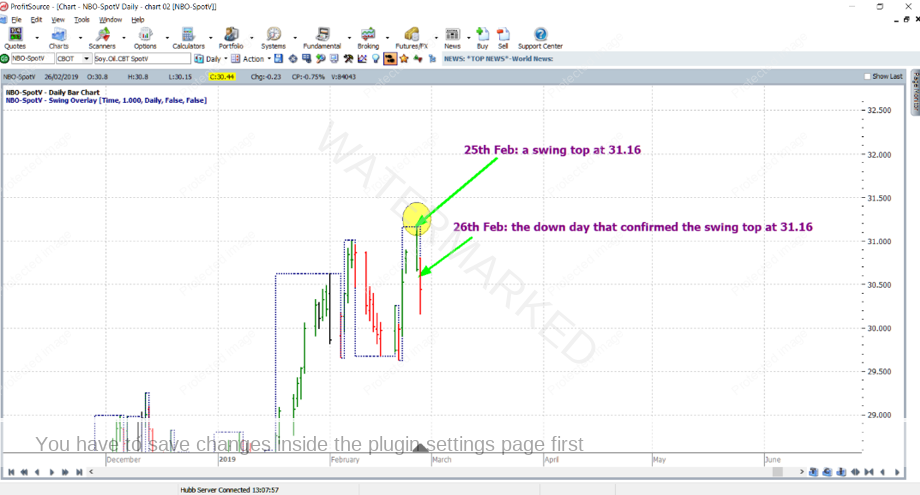
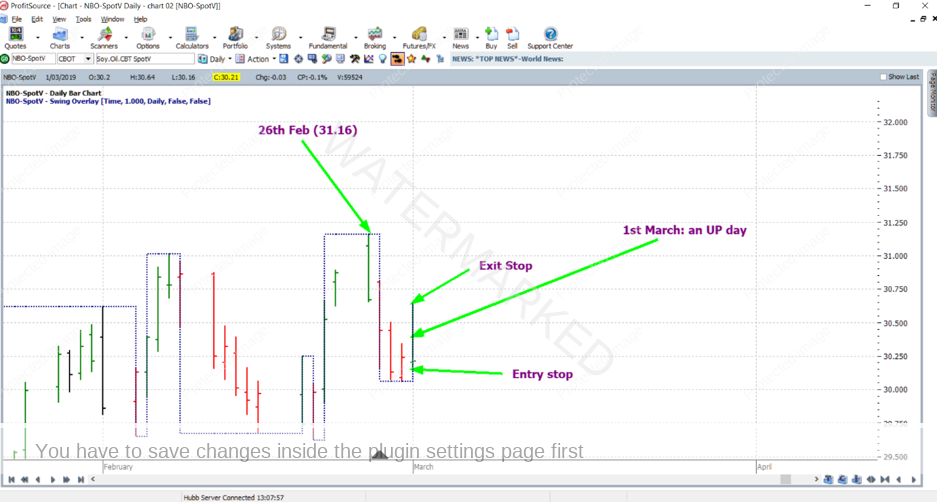
But in this example, we are not looking to trade as this first swing top is confirmed. We will be more conservative and wait for the moment that the next (and lower) swing top is confirmed. The opportunity to trade in this way presented itself a few days later after the first up day on 1 March. After this up day, we would then, in anticipation of a down day, prepare our orders:
Entry: Sell at 30.15 (1 point below the low of 1 March)
Initial Exit Stop: Buy at 30.65 (1 point above the high of 1 March)
Risk: 30.65 – 30.15 = 0.50 = 50 points
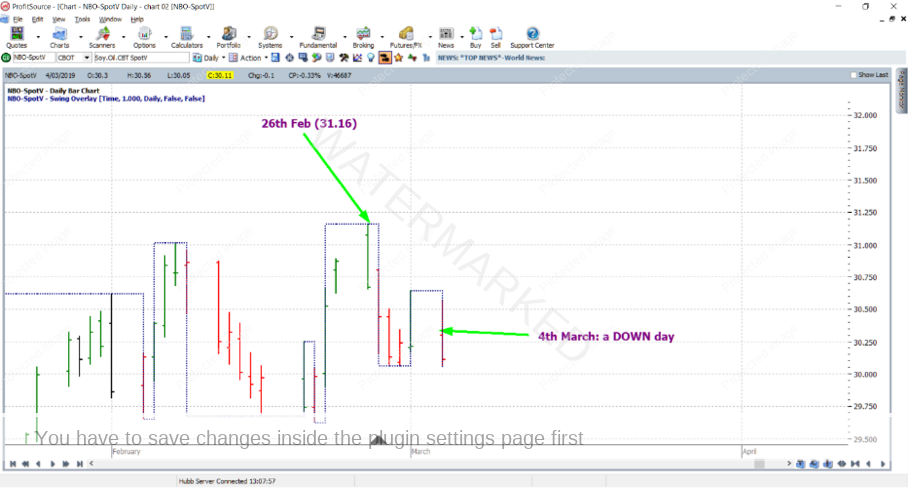
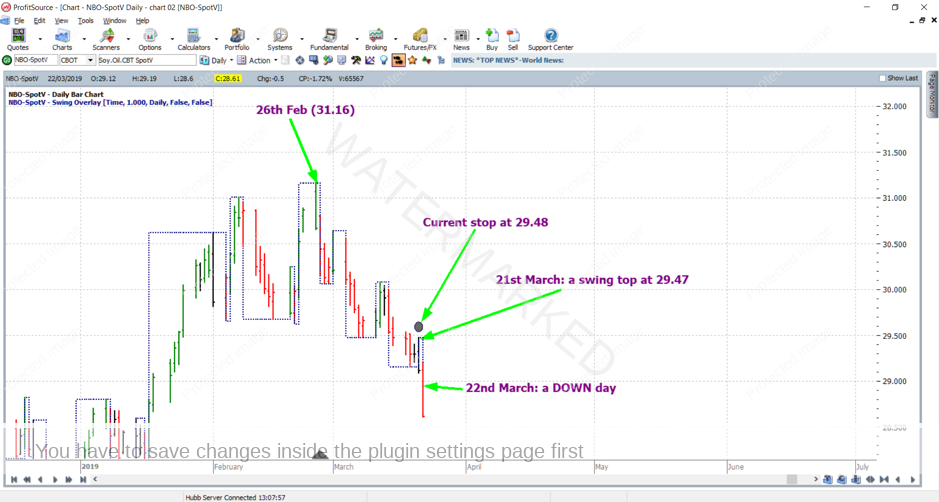
…and then, during the down day of 4 March, our order is triggered just as the market trades 1 point below the low of 1 March. The Swing Overlay Hi-Lite illustrates the lower swing top which was confirmed at the same instant that our order was filled. In other words, we have “traded the First Lower Swing Top.”
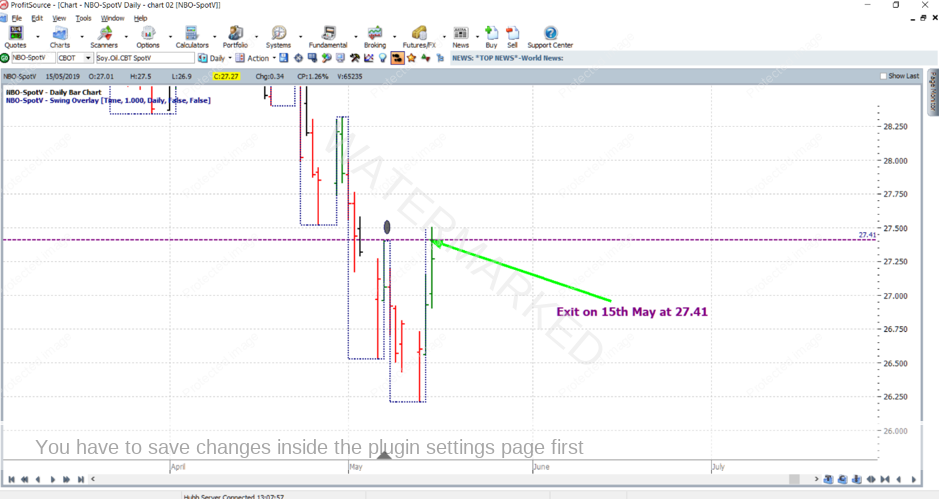
Entry = 30.15
Exit = 27.41
Profit = 2.74 (274 points x $6USD = $1644USD)
And the Reward to Risk Ratio achieved:
274 / 50 = approximately 5.5 to 1
Here are a few specs for Soybean Oil futures:
- Traded through the CME Group in Chicago
- Trading hours are 8.30am to 1.20pm, Chicago time, then 7pm to 7.45am Chicago time.
- Each point (0.01) of price movement changes the value of one contract by $6 USD.
- The current initial margin requirement is $621.50 USD/maintenance margin $565 USD
Currently the December 2019 contract is trading at the highest volume. For those still wishing to access this market with much lower margin, it can be traded using CFDs.
Work Hard, Work Smart!
Andrew Baraniak