Are We Close Yet?
Looking at the SPI200, the further the market goes up, the closer I’d assume we are getting to a monthly swing high. I think this will be a monthly Point B, which I find is often the harder point to pick of the A, B, C model.
When markets are showing strength, trying to anticipate and trade a Point B can be a good way to chew up capital. When you do your trade review, you can look back and see you’ve been trying to short a market as it kept going up. Rather, looking for long opportunities out of higher weekly or monthly swing bottoms can have you trading with the main trend.
Still, it doesn’t hurt to be marking up your ranges and working out where these Point B’s may come in.
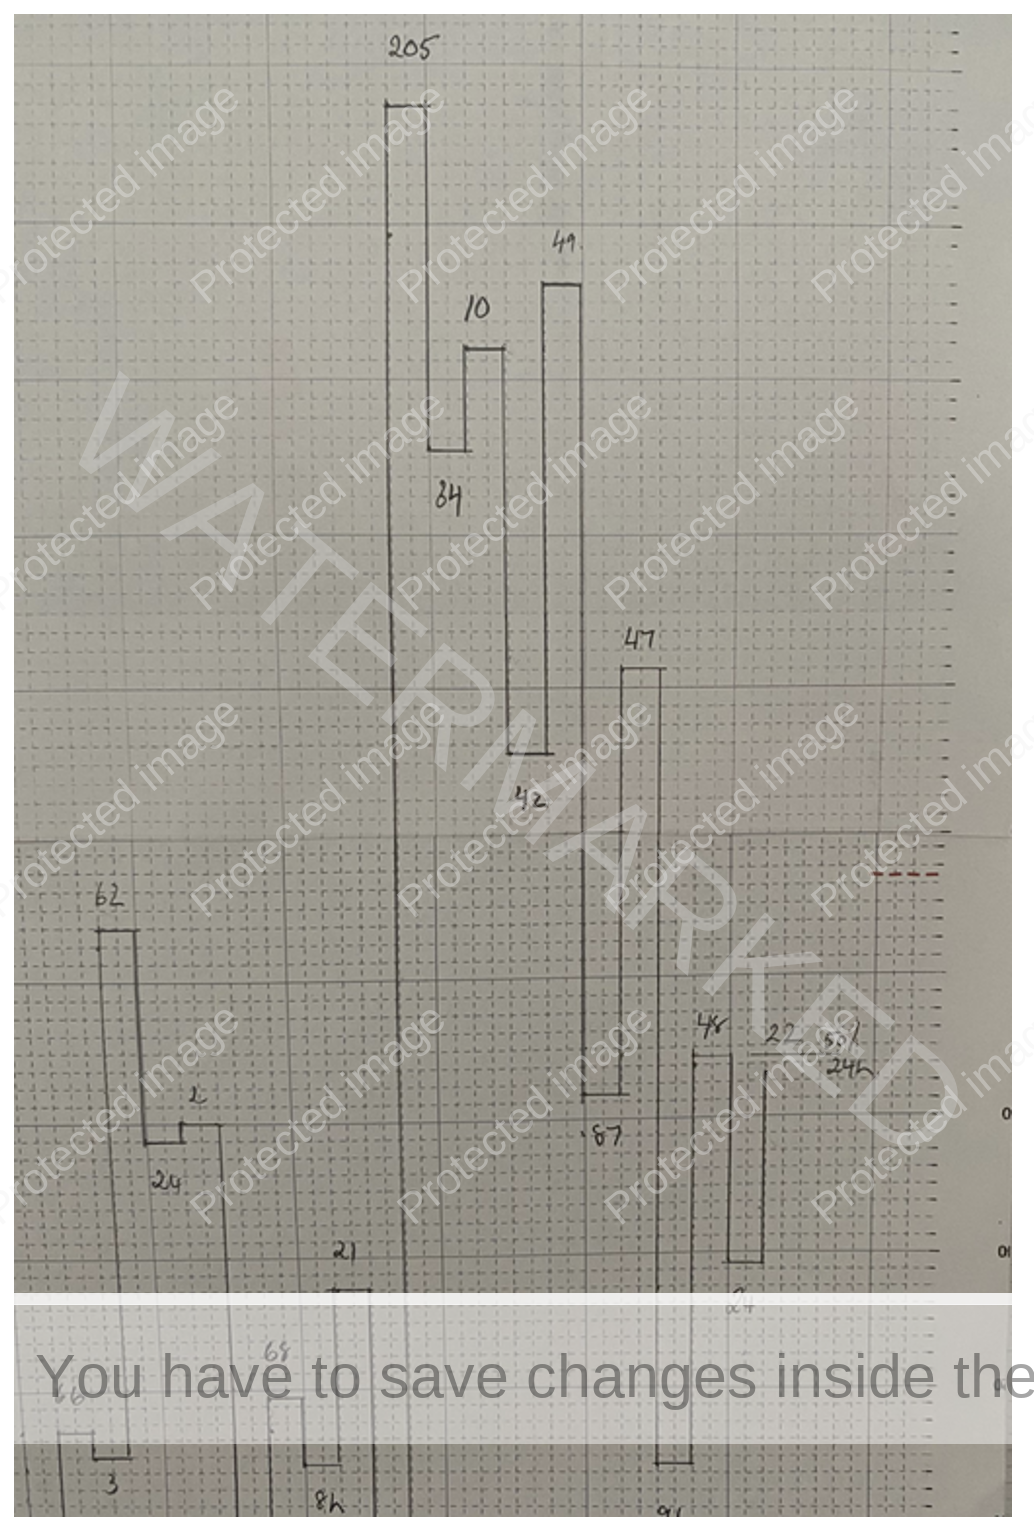
I’ll share some of my hand charts, at least the ones that aren’t too messy and hard to read!
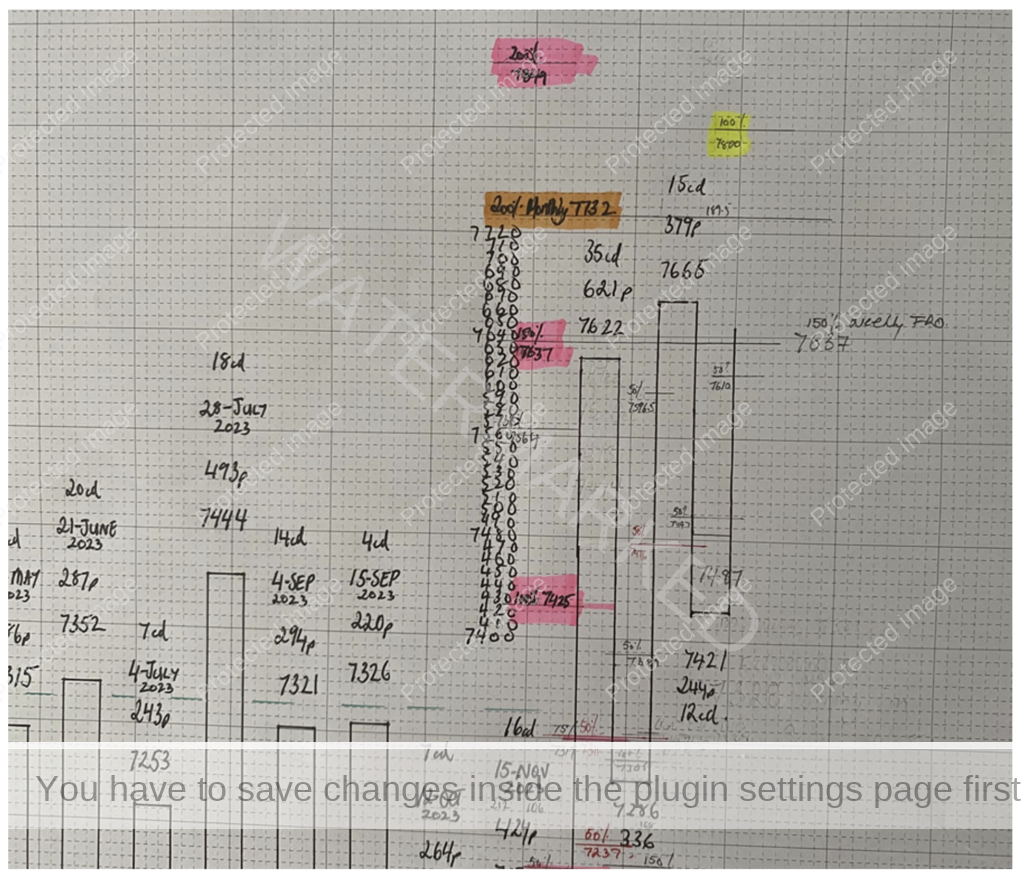
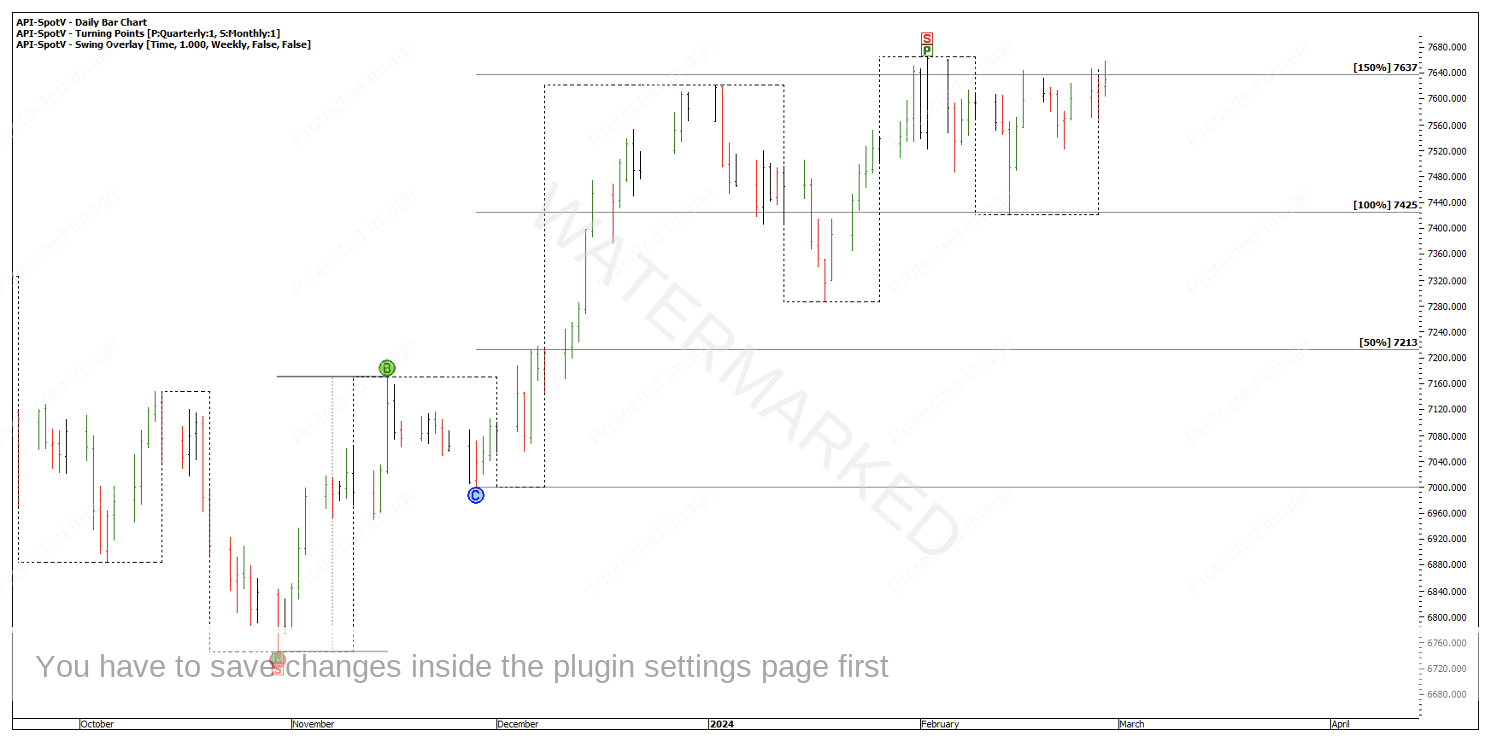
I see a lot of numbers floating around in ‘space’ on the SPI at this point, but it’s the 150% milestone at 7,637, of the slightly bigger weekly First Range Out that the market is finding some resistance at.
Chart 1 – Weekly Swing Chart
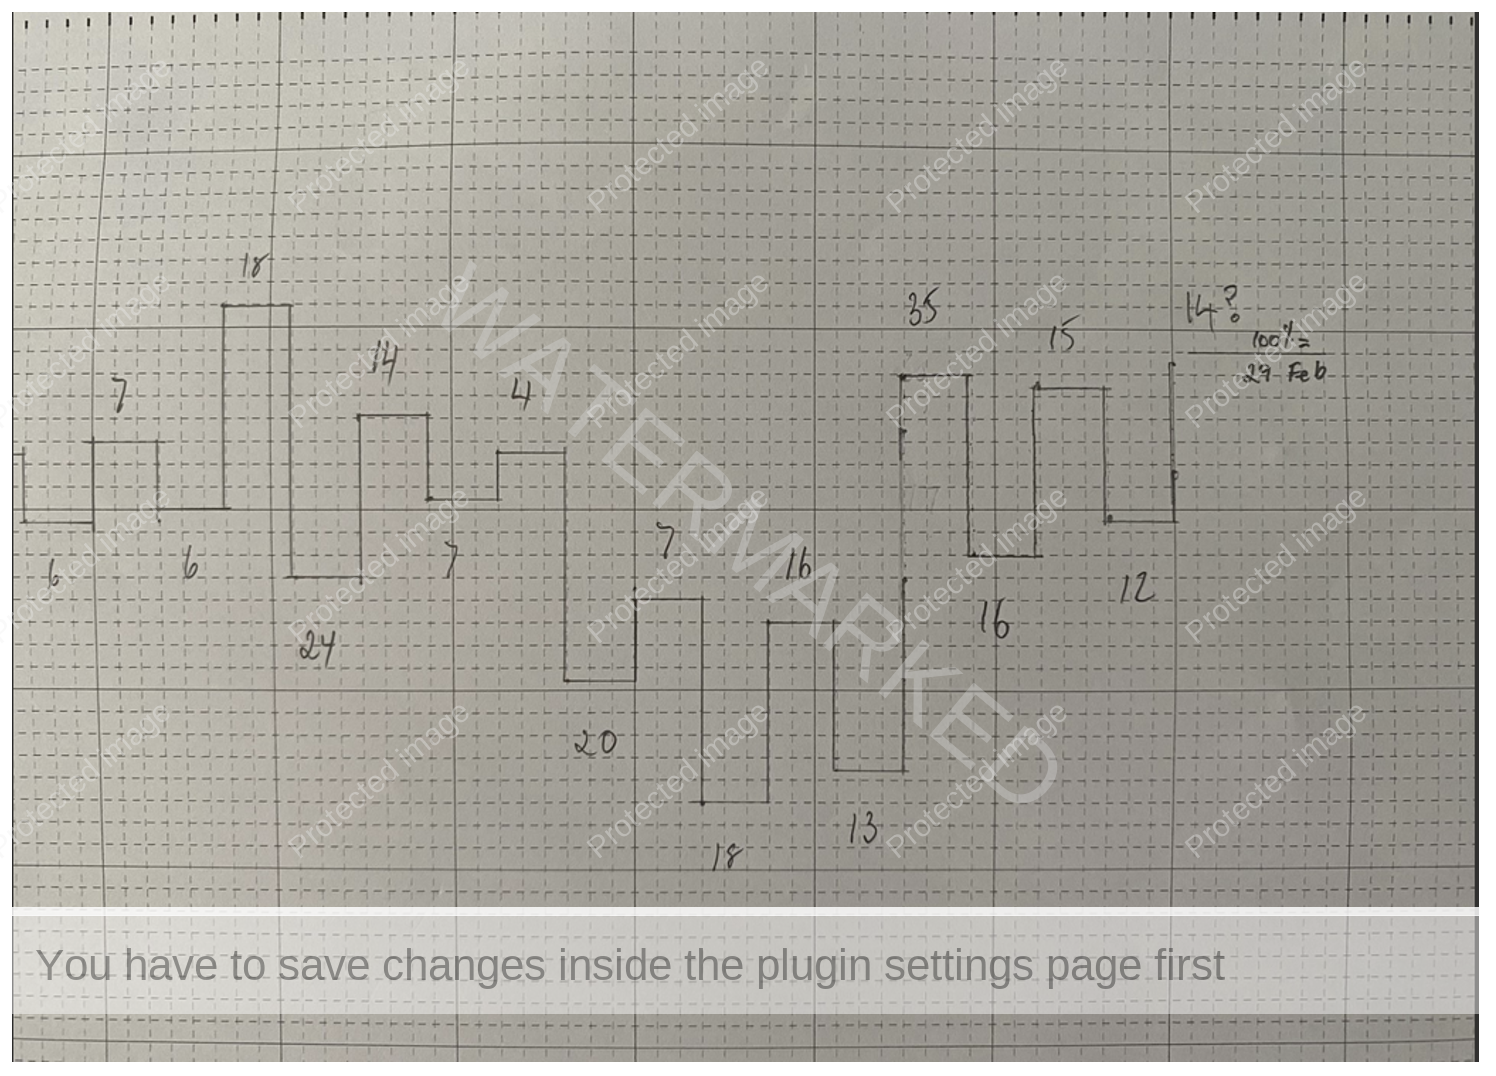
Chart 2 – Weekly Time Swing Chart
Above is a weekly time swing which you can run directly above or below your price swing. It just gives you that extra visual perspective on contracting, equal or expanding time ranges and gives you a great visual when you see the overbalance in time occur before the overbalance in price.
The above chart shows a 100% weekly repeat in time equals 29 February.
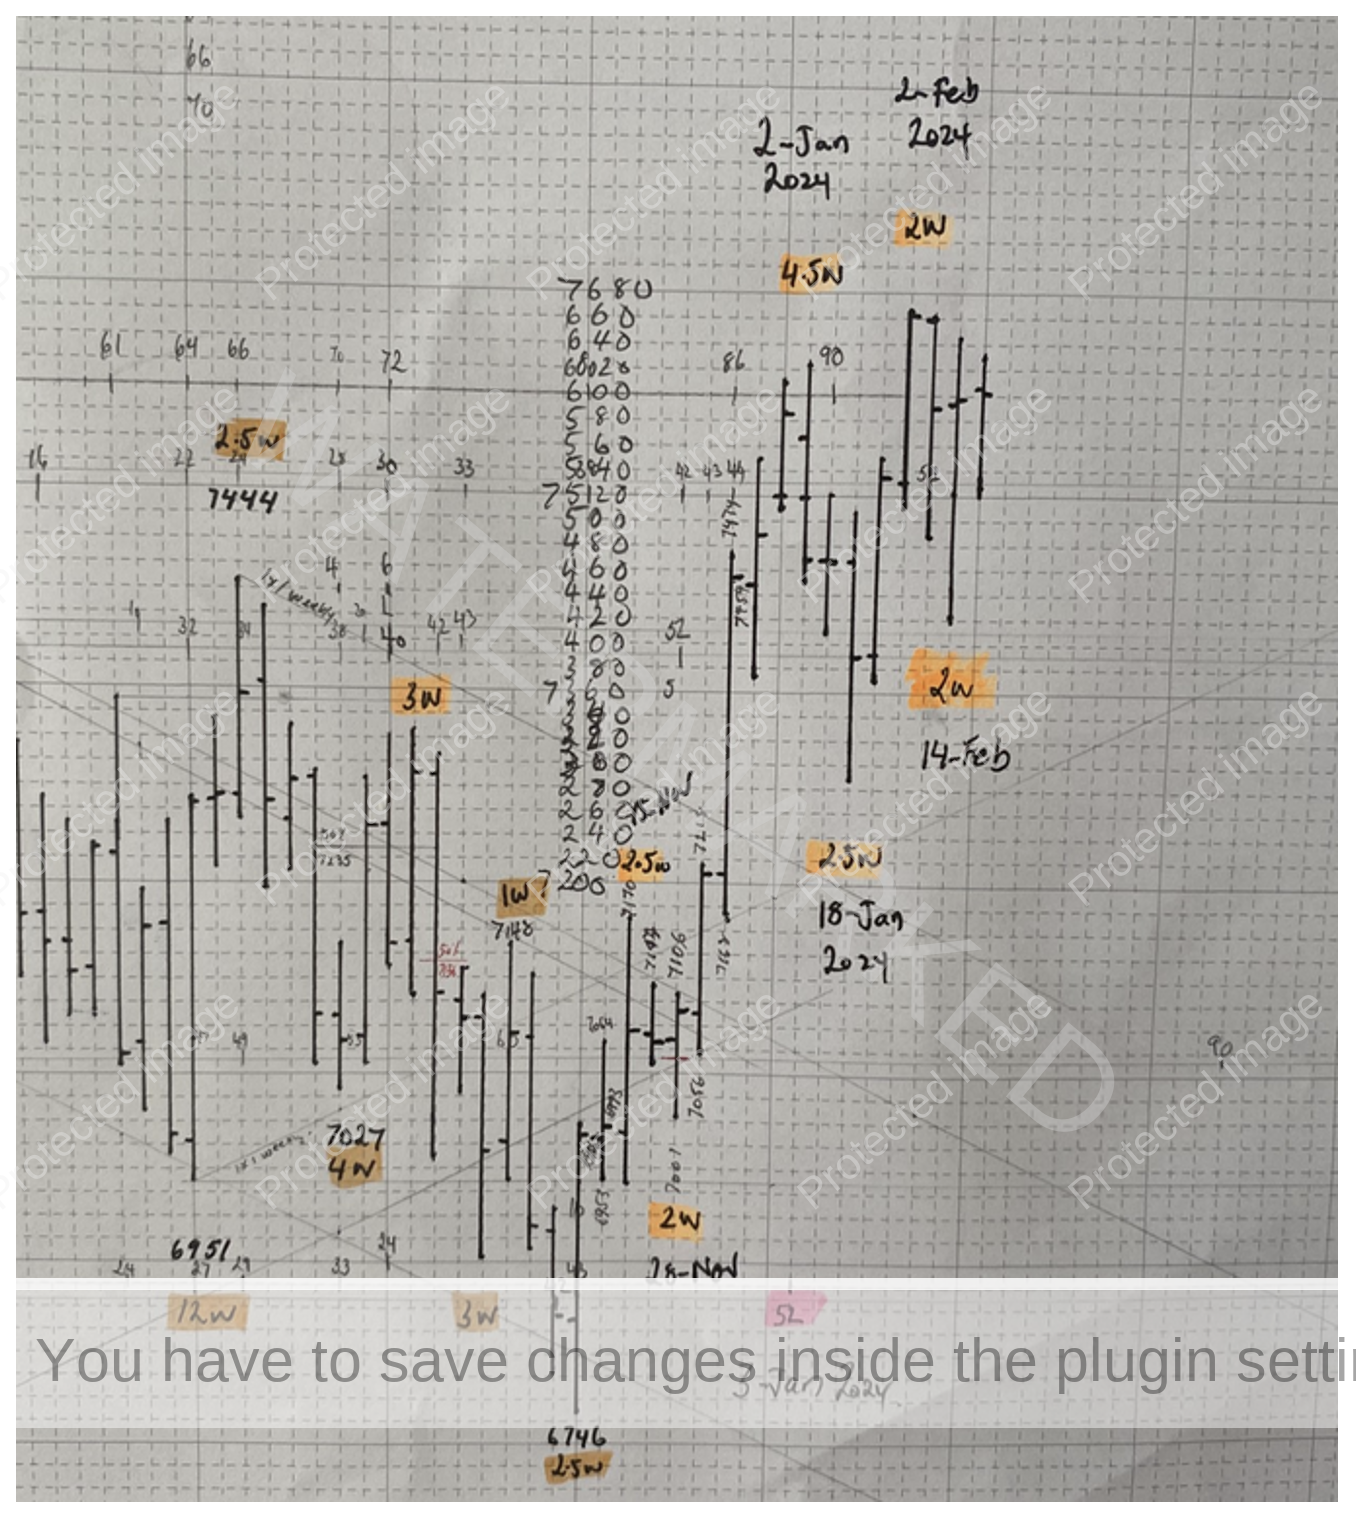
Another way to do it is to run a simple weekly bar chart with weekly counts and as you can see in Chart 3 below, the market made two weeks down into 14 February 2024 which is a contracting time frame down compared to the last weekly swing down of 2.5 weeks.
If there is no top this week, which would be two weeks up, then you have an expanding weekly swing time frame up.
Chart 3 – Weekly Bar Chart
The SPI200 has been in a fairly sideways trend since the start of the year, so does that mean it’s slowed down getting ready to make a monthly swing top, OR is it in an accumulation phase getting ready to have a good strong run to the upside and break through these current tops?
Either could happen, the market hasn’t managed to close above the 7,637 level mentioned earlier since 2 February. The weekly time count is right on 100% and there are now two contracting daily swing ranges up within a 4th and so far, contracting weekly swing range up.
Chart 4 – 150% of Bigger Weekly First Range Out
While the daily swing ranges are showing an uptrend, interestingly the daily time swing has been in a down trend. I measure the daily swings in hours, and I’ve seen this before where time will be trending opposite to price. My take on that is, price will either start heading down in line with the time trend or, price will now head up when time ranges start to expand to the upside.
Chart 5 – Daily Time Swing
It’s worth thinking about how many trades per year you need to be a successful trader. David Bowden says he needed 50% of each major trend move. For me, I like to think in terms of Reward to Risk Ratio trades.
If you risk 5% per trade and only took the best couple of trades for the year and banked a net result of two, 10 to 1 trades for the whole year, that would double your trading account.
Two trades at 10 to 1 = Double your trading account!
Four trades of 10 to 1 risking 2.5% would double your trading account!
If you look at the past 5 years on the SPI200 and how many monthly turns per year you generally see, it’s clear that there are plenty of trading opportunities.
2023: 7 monthly turns.
2022: 7 monthly turns.
2021: 8 monthly turns.
2020: 4 monthly turns
2019: 5 monthly turns.
In 2024, we haven’t had a monthly turning point yet so there are more to come! And of course, there are plenty of other markets you can look at for potential monthly Point A’s or Point C’s.
Happy Trading,
Gus Hingeley
