Aussie, Aussie, Aussie
Students looking to take the next step from the Active Trader Program to David’s Ultimate Gann Course and maybe even the Master Forecasting Course will find there is a big educational shift in the way you analyse the markets. To David, ABC trades were a beginner’s trading method that provided a foundation for traders seeking the Gann Methodology, and hence why they are taught in the first book of the Safety in the Market educational series, the Smarter Starter Pack.
David’s real focus was on ‘Seasonal ABC Trading’. David purposely established our thinking from an early start, using the ABC trading methodology in the Smarter Starter Pack to build the foundation around the ‘Seasonal ABC Trade’, which in turn would develop our understanding of the bigger picture or ‘Seasonality of the Trend’. It was through the use of seasonal trading that we progress our knowledge about how price and time forecasting is formulated.
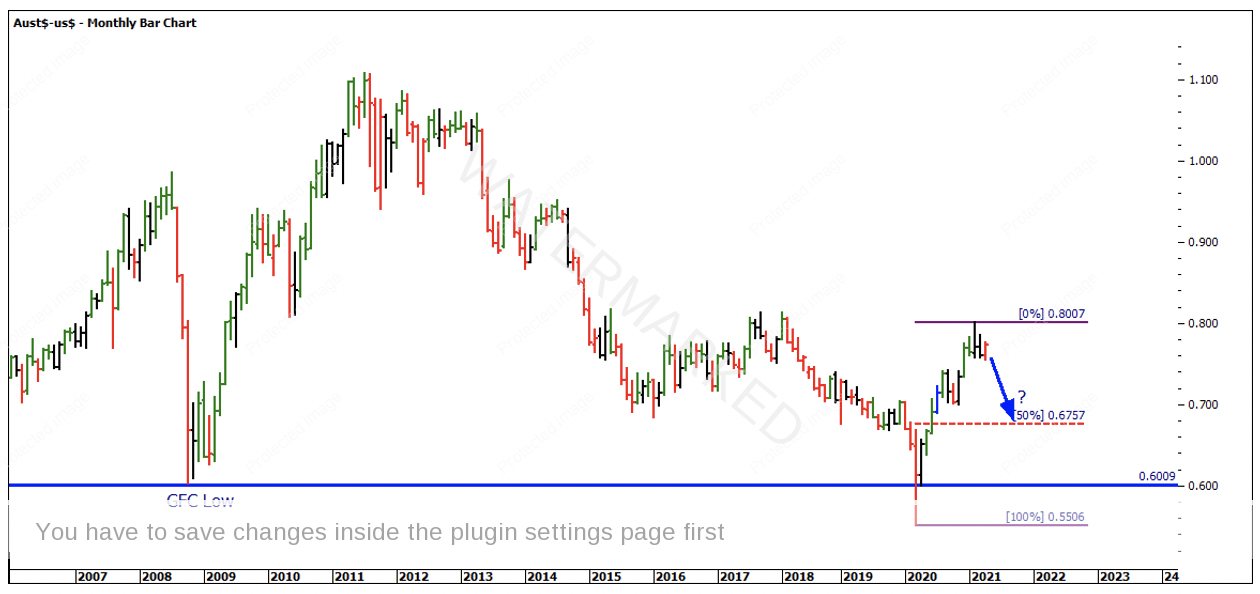
If we look at the Australian Dollar this month (ProfitSource Code: FXADUS), you will notice recently the market has pushed out of a double bottom, which could be the start of a new bull section. Using ‘Seasonal ABC Trading’ we can look to verify the double bottom and be on alert for a monthly higher swing bottom.
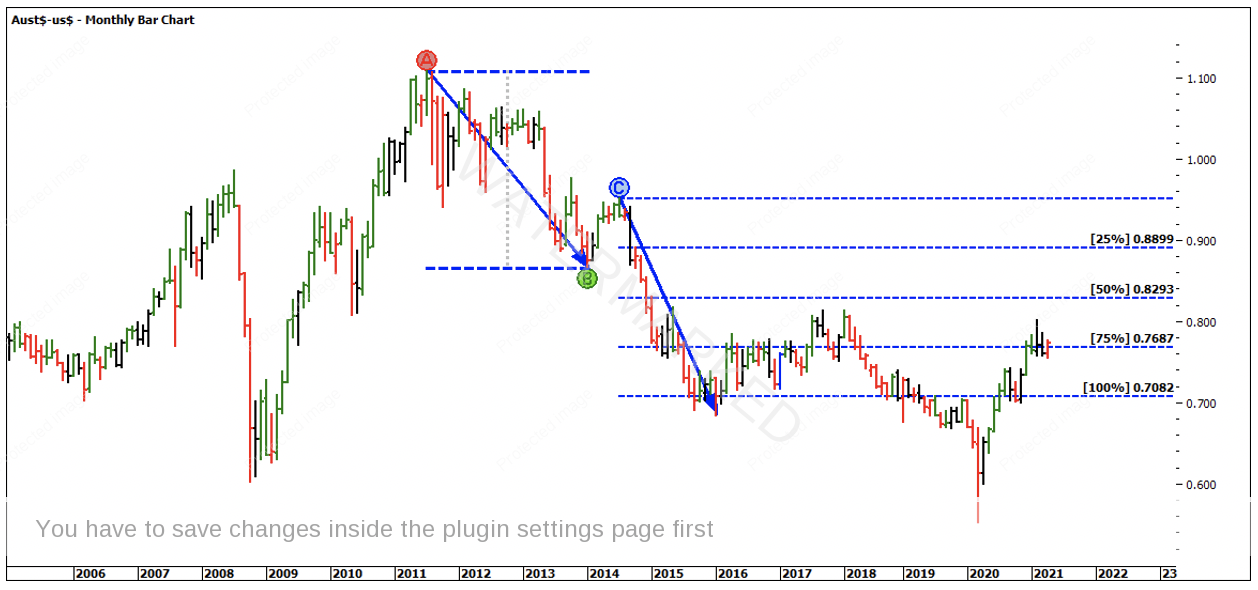
Looking at the 2011 high at 1.1080 down to the 2014 low at 0.8658, this provides a First Range Out of 0.2422. Projecting this from a Point C, the July 2014 reaction high at 0.9504, we have a projected 100% target at 0.7082. The market initially bottomed at 0.6893 in September 2015, and retested this level in January 2016 at 0.6824, before attempting to push higher again.
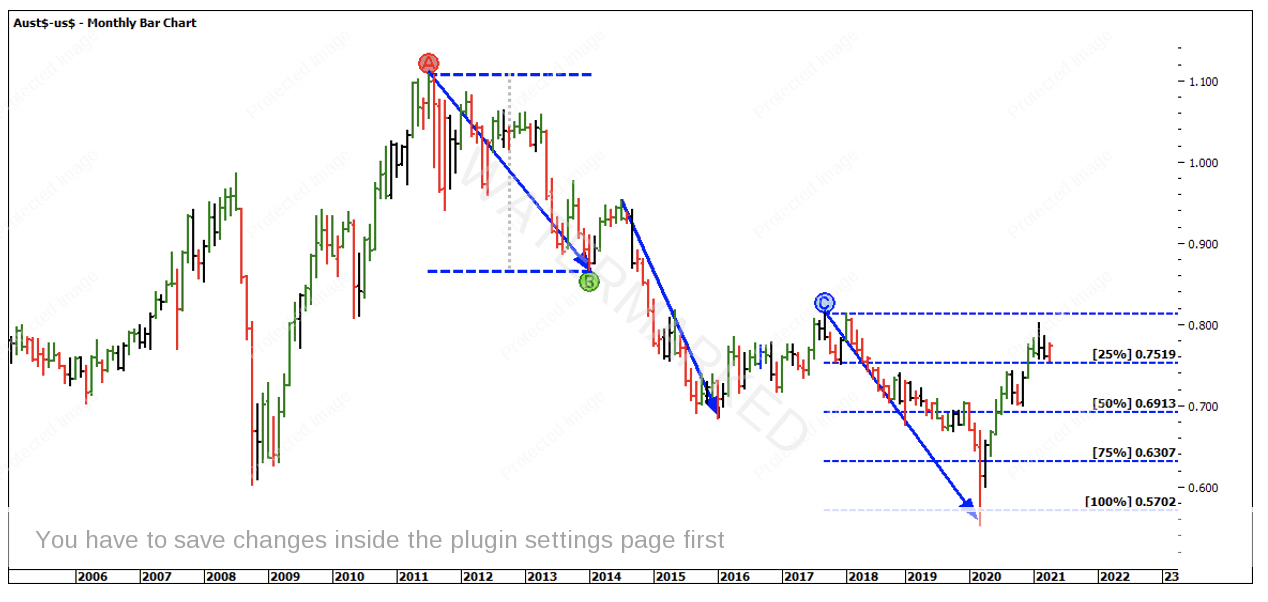
Projecting the First Range Out from the start of the third section in January 2018 at. 0.8135, the projected 100% level was at. 0.5713.
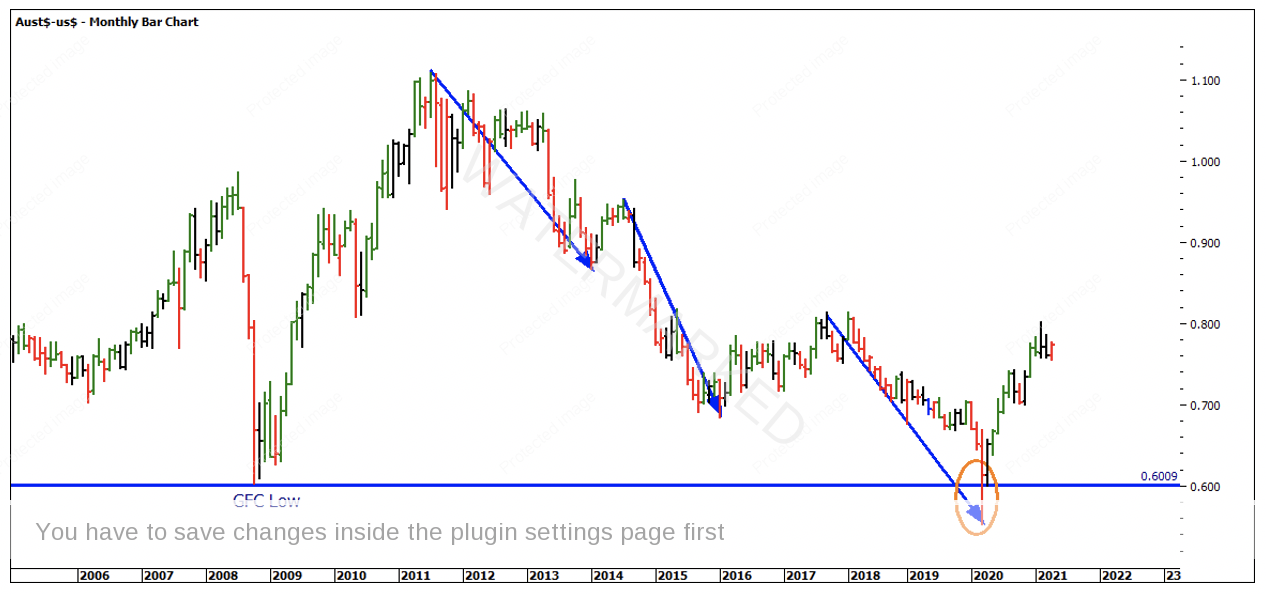
The market fell sharply, taking out the previous 2008 low at 0.6009. Notice that it was able to close back above that level at 0.6135. Since the market bottomed at the start of 2020, it has rallied back to the start of section three at 0.8000.
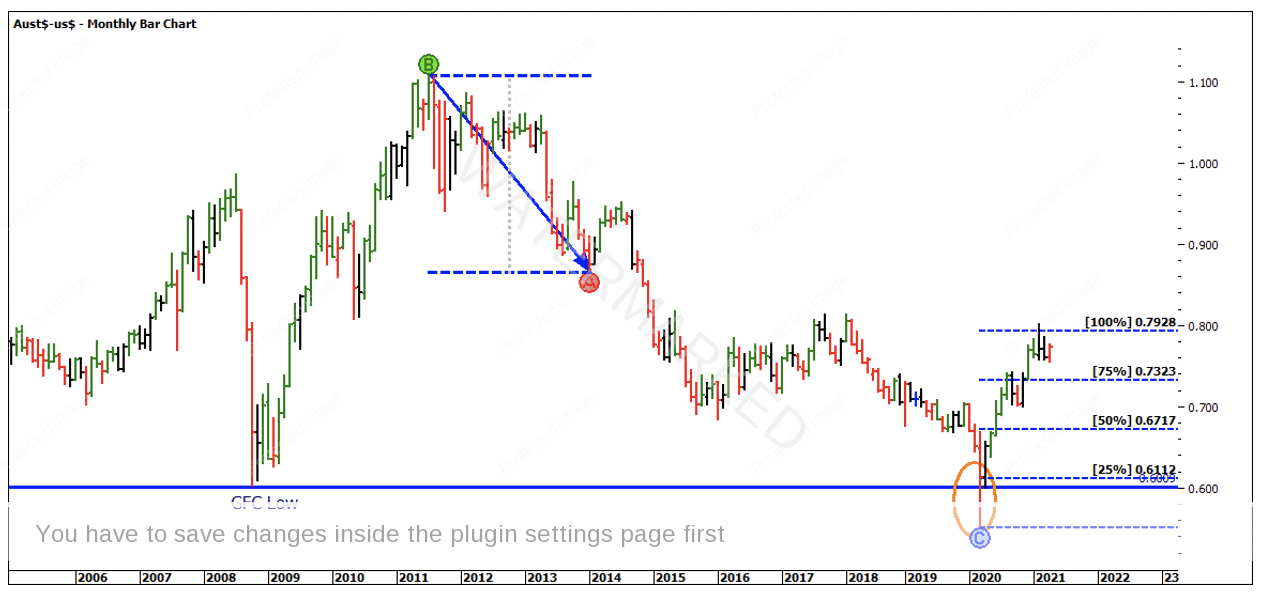
As you are probably aware the market likes to repeat certain numbers. If we strategically take the First Range Out from section one of the bear market of 0.2422 and apply that to the March 2020 low at 0.5506 we have a 100% target of 0.7928 which the market was able to react off.
This is a great example of an Overbalance in Price trade. While it is not directly an ABC, you can see how it fits the criteria of being the largest up side, while not directly breaking the previous January 2018 highs.
I know I will be watching for an estimated Point C above the 50% level at 0.6757.
It’s Your Perception
Robert Steer
