Balancing Time
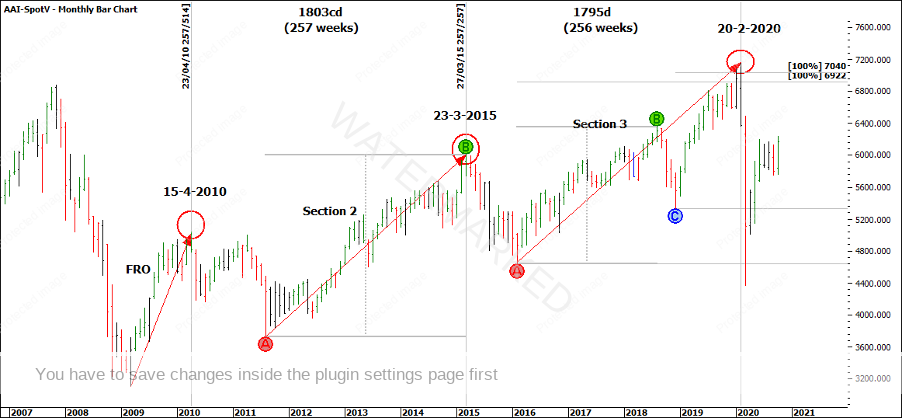
Welcome to the October edition of the Platinum Newsletter. Balancing time can be an amazing technique when combined with other well-proven indicators. Balancing time doesn’t have to be small time frames, what works on the small picture works just as well on the big picture. Take the SPI for example, from the 15 April 2010 top to the 23 March 2015 top there are 257 weeks or 1,803 days and from the 23 March 2015 top to the 20 February 2020 top there are 256 weeks or 1,795 days. This demonstrates a top to top balancing time within 8 days over a 5 year period.
Chart 1
However, all of that is in the past and the real trick is to be able to see it line up before it happens! I found the best way to identify large balancing time frames is on a weekly or monthly hand chart. If you don’t have one already and want to get some easy runs on the board, a monthly hand chart of this is a great place to start and easy to manage. For the SPI, from its birth date of 16 February, 1983 to present, charting at 320 points to the inch will encompass two x A1 sheets of paper in landscape format from Officeworks. Once you start counting the months and looking for balancing time frames and applying other techniques, you can mark up your chart and the information is there permanently in front of you.
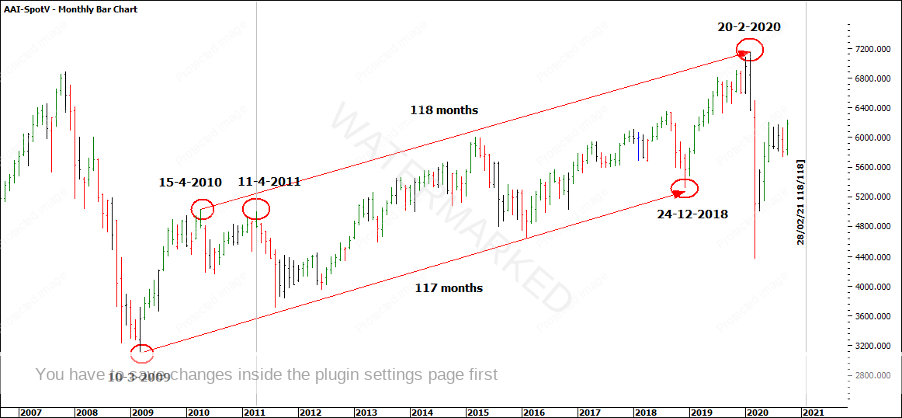
Looking at the below example, you can see from the 10 March 2009 low to the 24 December 2018 low there are 117 months for a bottom to bottom time frame. 117 months added to the 15 April 2010 top gives mid-January 2020. The top came in at 118 months on 20 February, not a perfect hit but a ballpark area to be thinking about.
Chart 2
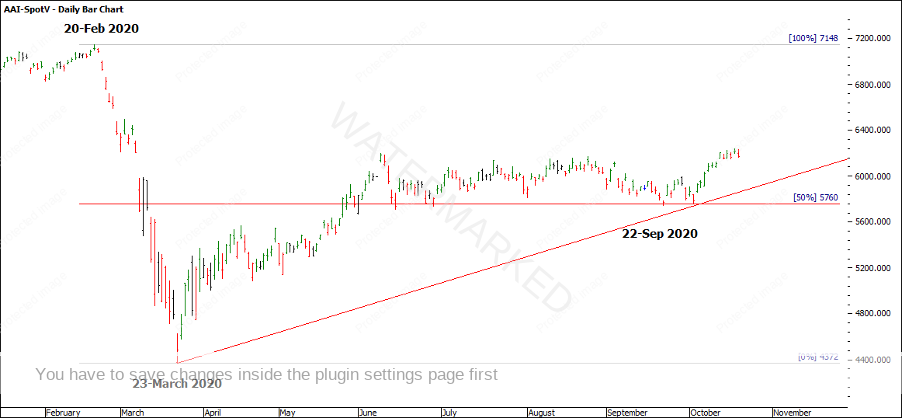
At 118 months, we saw the market have a fast-moving sell-off, followed by a recovery. I see the current market continuing to show strength as it holds above a major 50% retracement level and the 1×1 trading day angle from the 23 March 2020 low. The monthly trend has confirmed up (at time of writing on 21 October) and the weekly swing chart is showing an expanding swing range to the upside.
Chart 3
So that really leaves me wondering what is next for the SPI200? Considering the trend remains up, for now, if you run 118 months from the 11 April 2011 top, we arrive at February 2021 as a month to watch out for as a potential monthly change in trend (refer to Chart 2).
However, a Classic Gann Setup could present at any time, although if you can identify one that lines up with a large repeating time frame, then you have the potential for trading a monthly swing or better.
Happy Trading
Gus Hingeley


