Bean Oil – Current Market
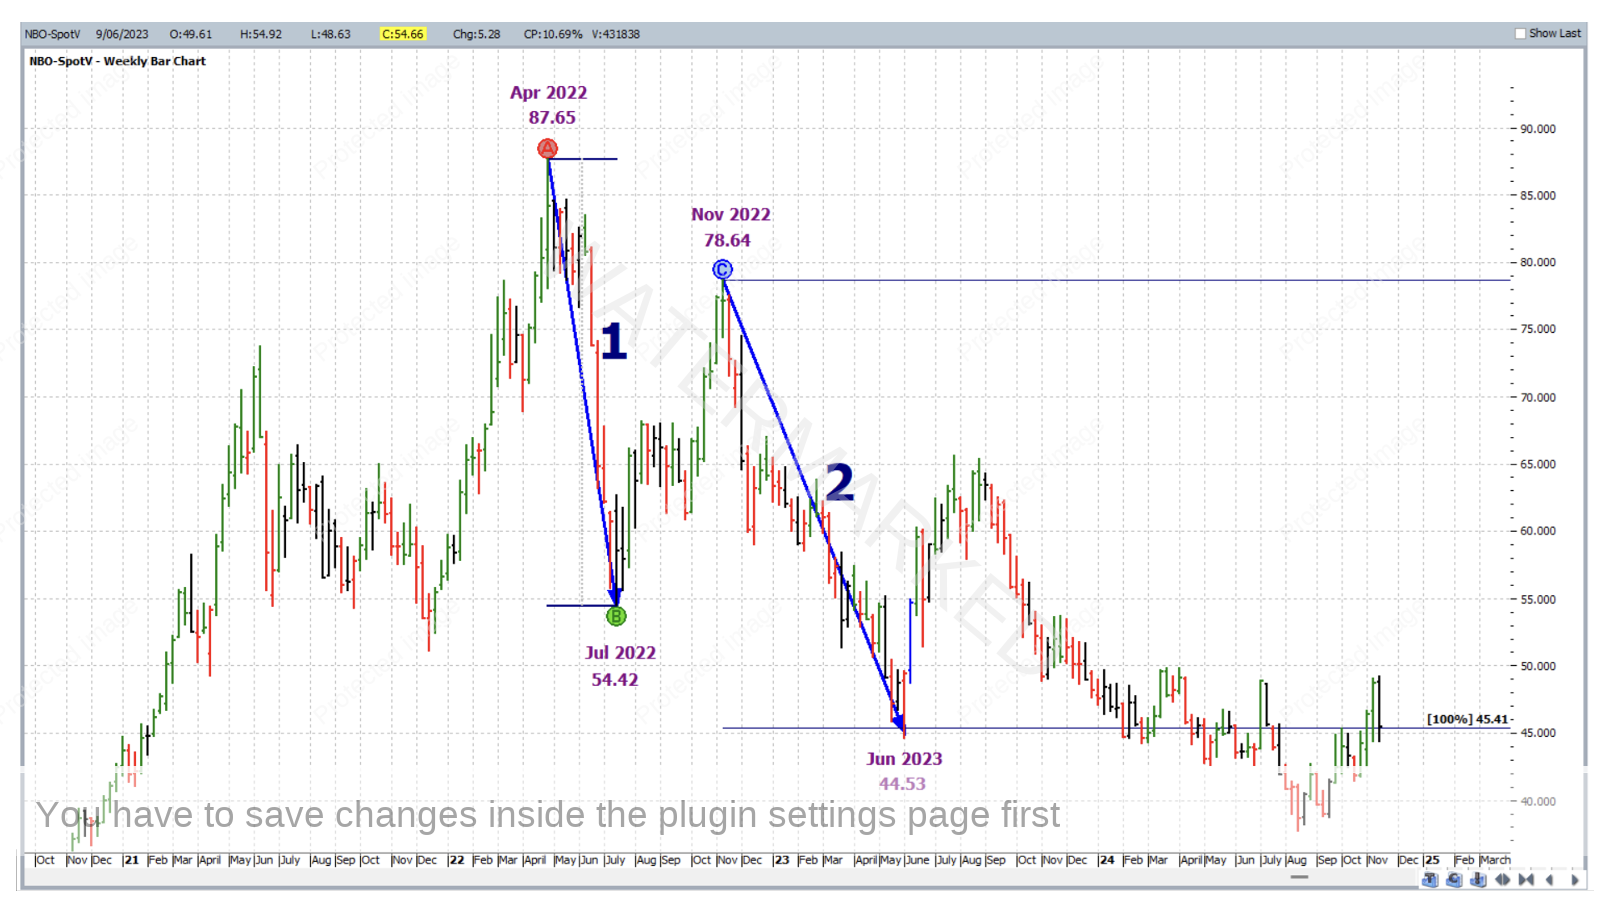
This month’s article takes on a very similar format to the last by looking at the current position of a market – this time Soybean Oil futures. The goal here is to keep the analysis both as strong and as simple as possible by engaging techniques taught in the Smarter Starter Pack and Number One Trading Plan manuals. In order to establish the current position of the Bean Oil market, let’s take a look at some of its recent market action. Below is the continuous weekly bar chart which links contracts of highest volume, symbol NBO-SpotV in ProfitSource. Since the All-Time High of 87.65 US cents per pound in April of 2022, two complete sections down have occurred offering plenty for the stalking bear.
And just like last month, with the ABC Pressure Points tool applied we see that the second section was close to an exact repeat of the first. The June 2023 low only false broke the 100% milestone by a tolerable amount. This is no fluke and it traces back to David’s reason for teaching us ABCs and the concept of the repeating range in the Smarter Starter Pack!
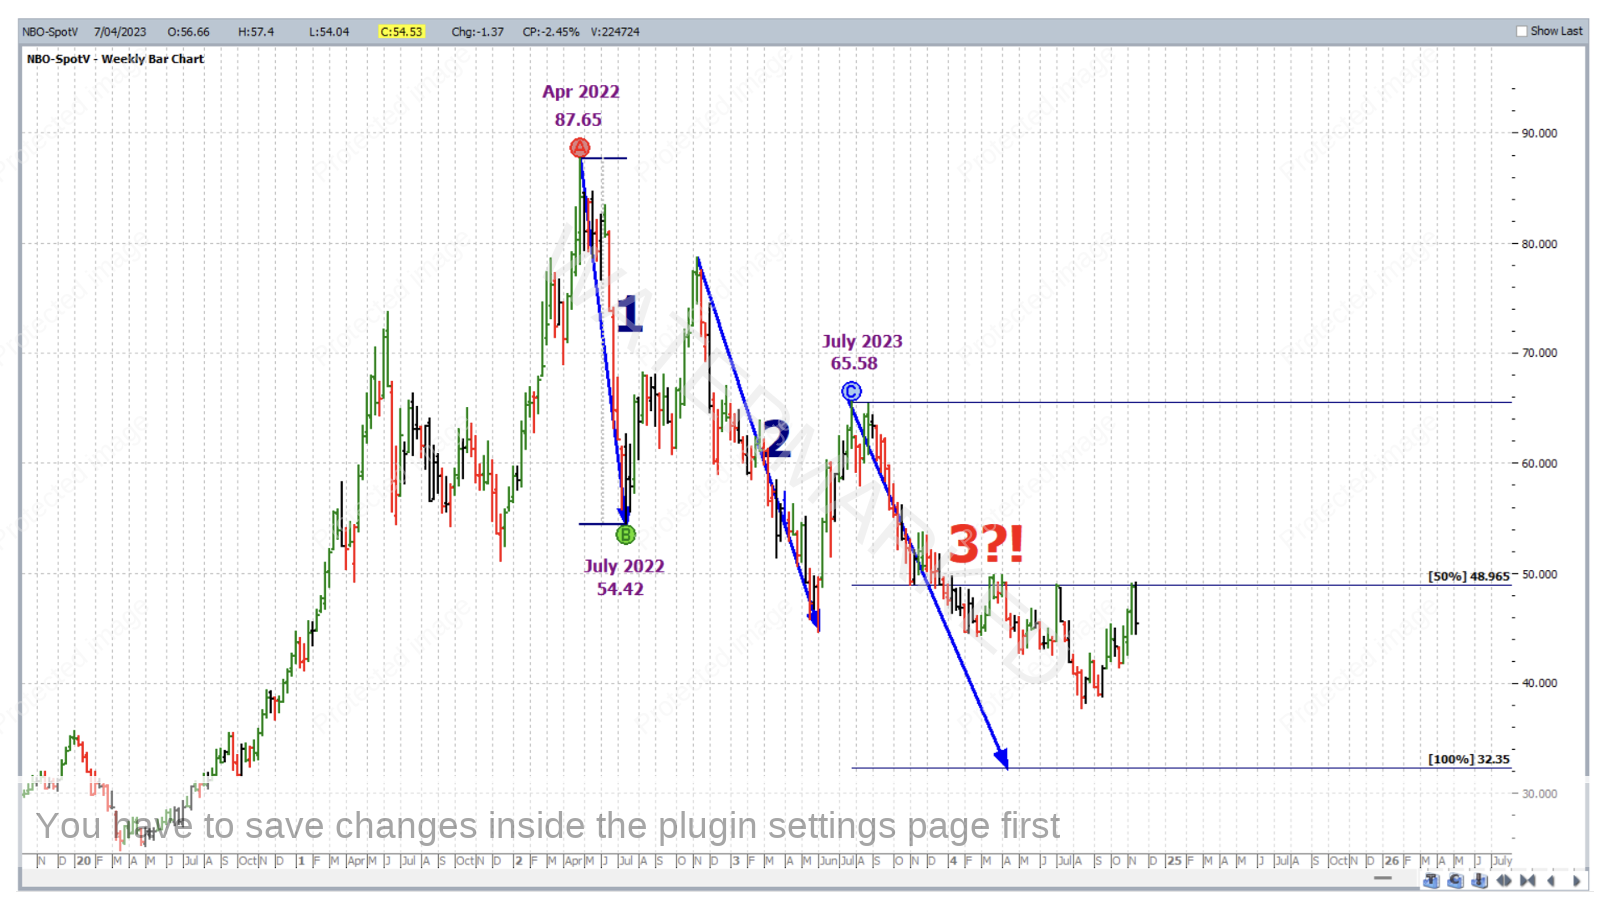
What about the current move down? This is considered below, where on the same chart, the ABC Pressure Points Tool is applied again, with the AB reference range still being the major First Range Out (April 2022 high to July 2022 low), but with Point C now at the high (July 2023) of the current and yet to be completed third section down. If this move is to again go to 100%, there could still be more in it for the bears.
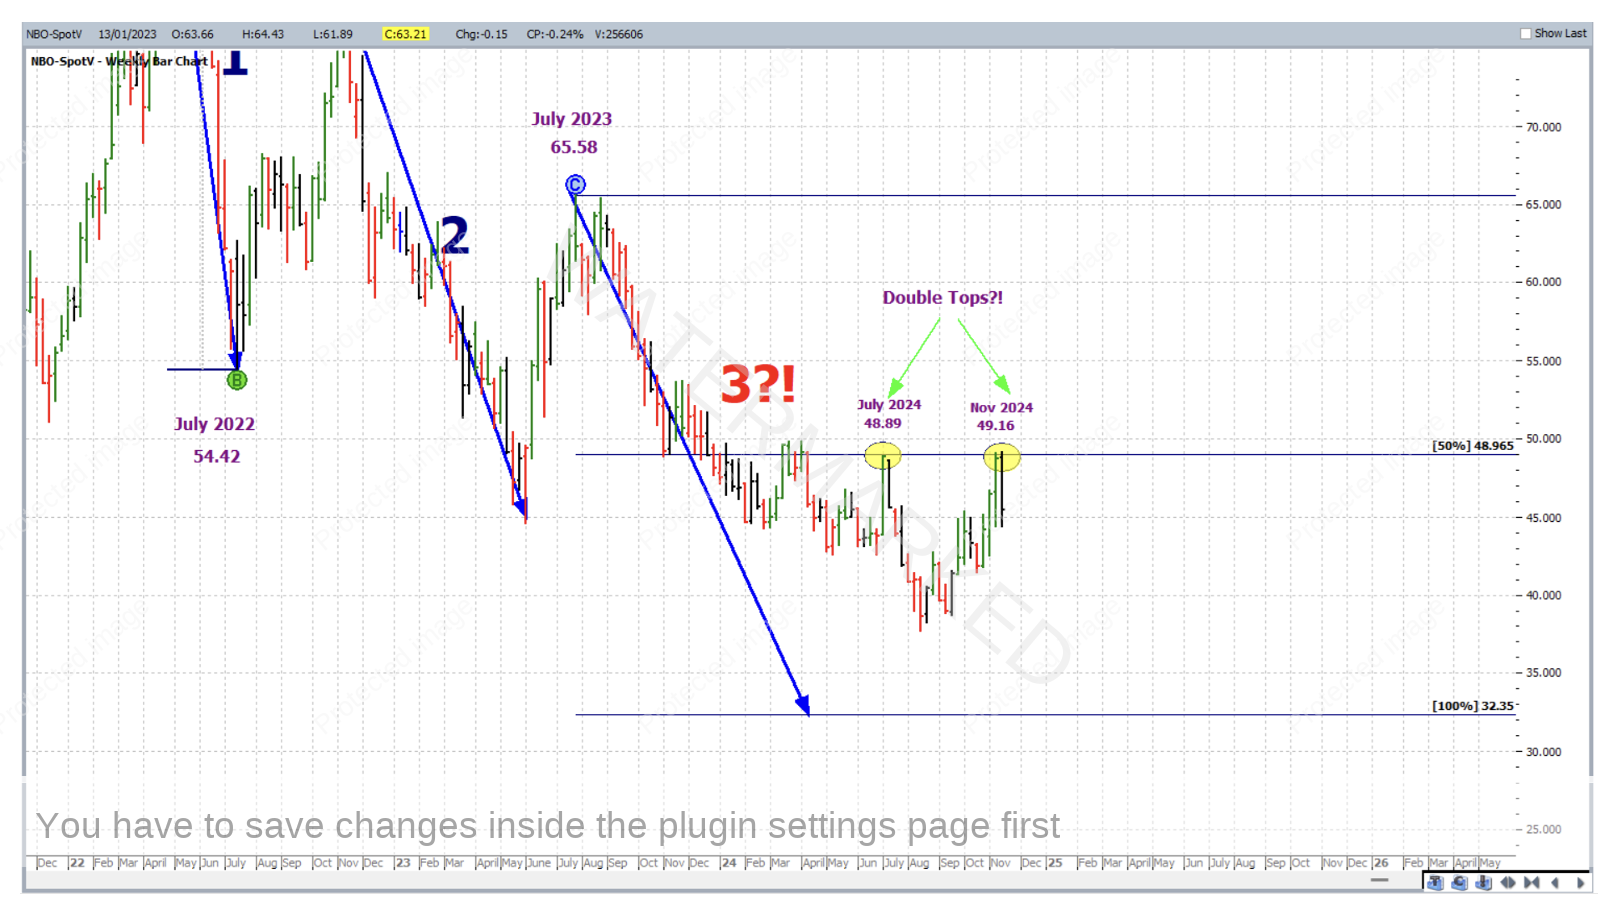
If you look closely at the chart above for long enough, you’ll see that the third section so far has been a little sideways and sluggish, so to get back on board short, more reason is required. So what else is there? Zooming in further there is a potential double top formation – right at the 50% milestone of this major ABC formation. The July 2024 top was at 48.89 and the current top for November only a slight false break of the July top at 49.16.
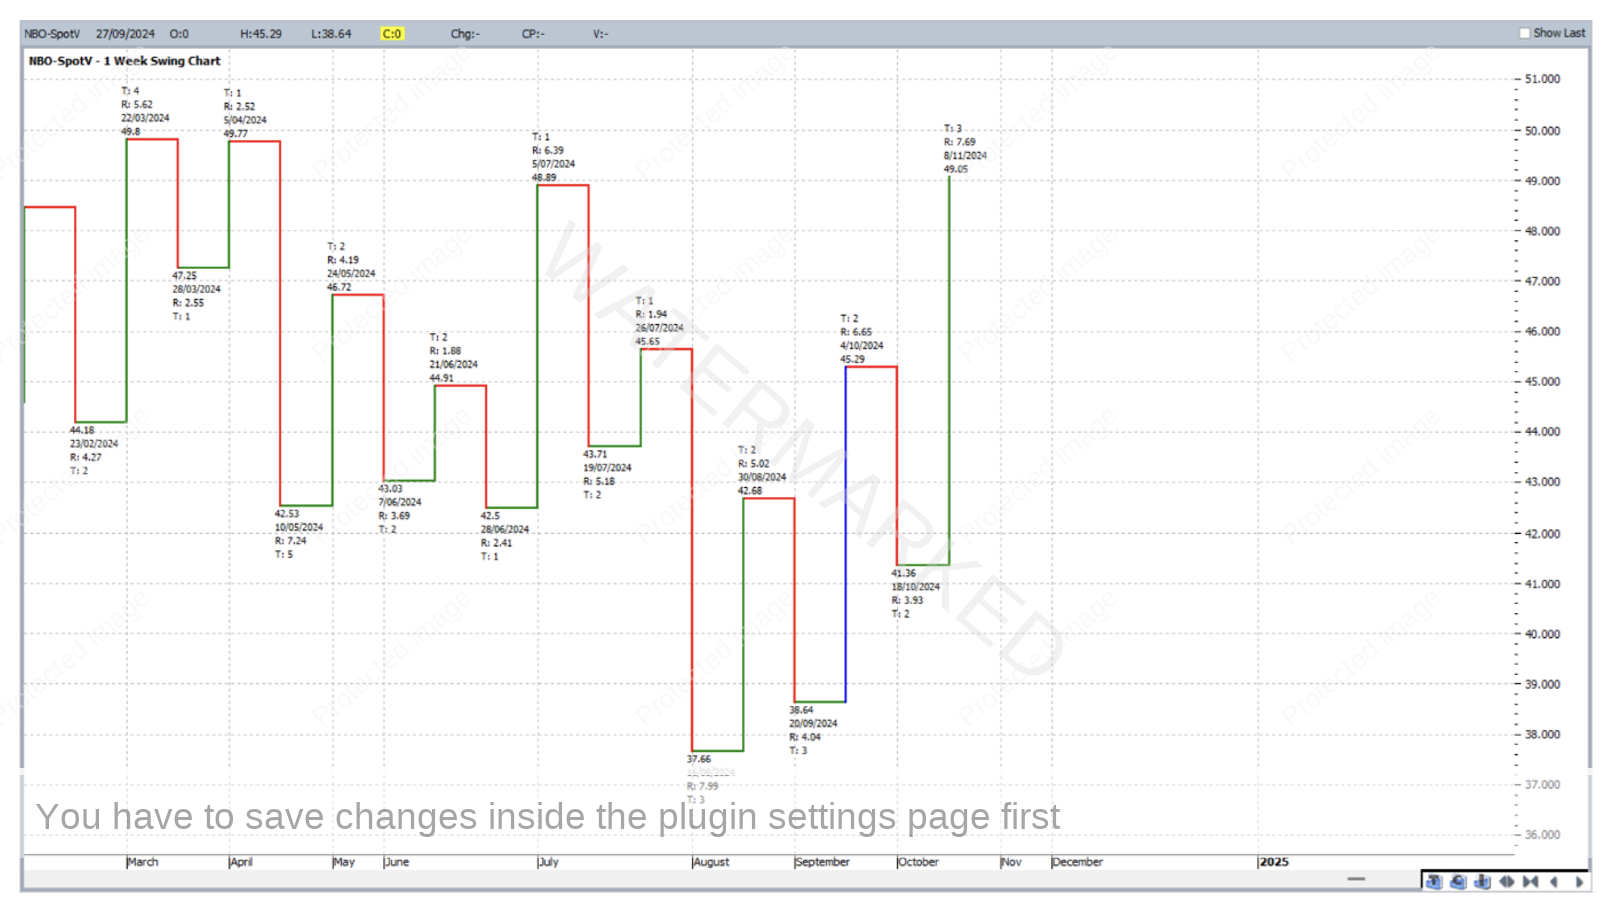
Looking at the swing charts, the weekly trend is currently UP with expanding upswings and contracting downswings – all bullish there, but that being said, three clear sections have unfolded up into the current top of 11 November 2024 at 49.16; note the chart below only shows data for up to and including for 8 November 2024 because last week’s bar was an outside (reversal) bar meaning the weekly swing chart is yet to be updated to include data from the high of 11 November 2024.
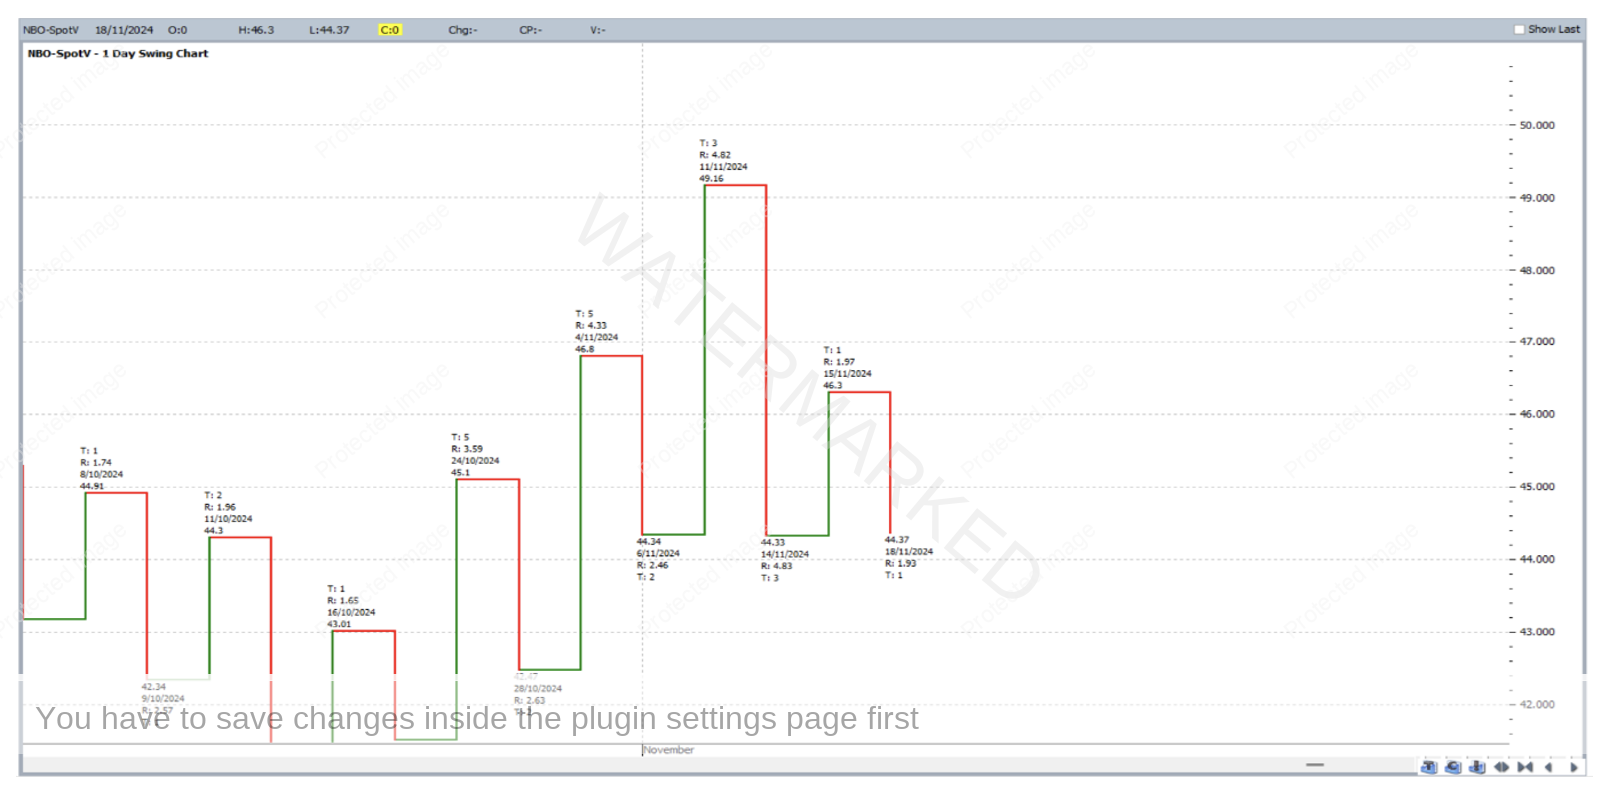
To the daily swing chart and the trend at the time of writing has just been confirmed DOWN with expanding downswings and contracting upswings, perhaps an early indication that the bears are coming back – remember the daily swing chart will always be the most sensitive to change and gives us our first indication.
Work hard, work smart.
Andrew Baraniak
