Better To Be Out Than In
There are many gems buried in the material that David has created for us. Some of which comes in as detailed lessons others in phrases, anecdotes or observations. One of my favourites is, “it’s better to be out wishing you were in, rather than in wishing you were out”.
The global turmoil has obvious impacts to markets, and this recent sad turn of events has placed volatility smack bang into the focus of everyone , even if they are participants in markets or not. I have been contacted by many in the last 2 weeks regarding Oil as it’s a market I have spent 20 years digesting. In February I recall discussing the natural rhythm that Crude follows where we often see a move from March into April. This is a small cycle that is measurable and something we can look to understand but when markets move like they have it becomes a very challenging market to get set in or even hold a position in.
Chart 1 shows the building price action that started as early as mid-December with a higher bottom in January of this year anchoring around seasonal time.
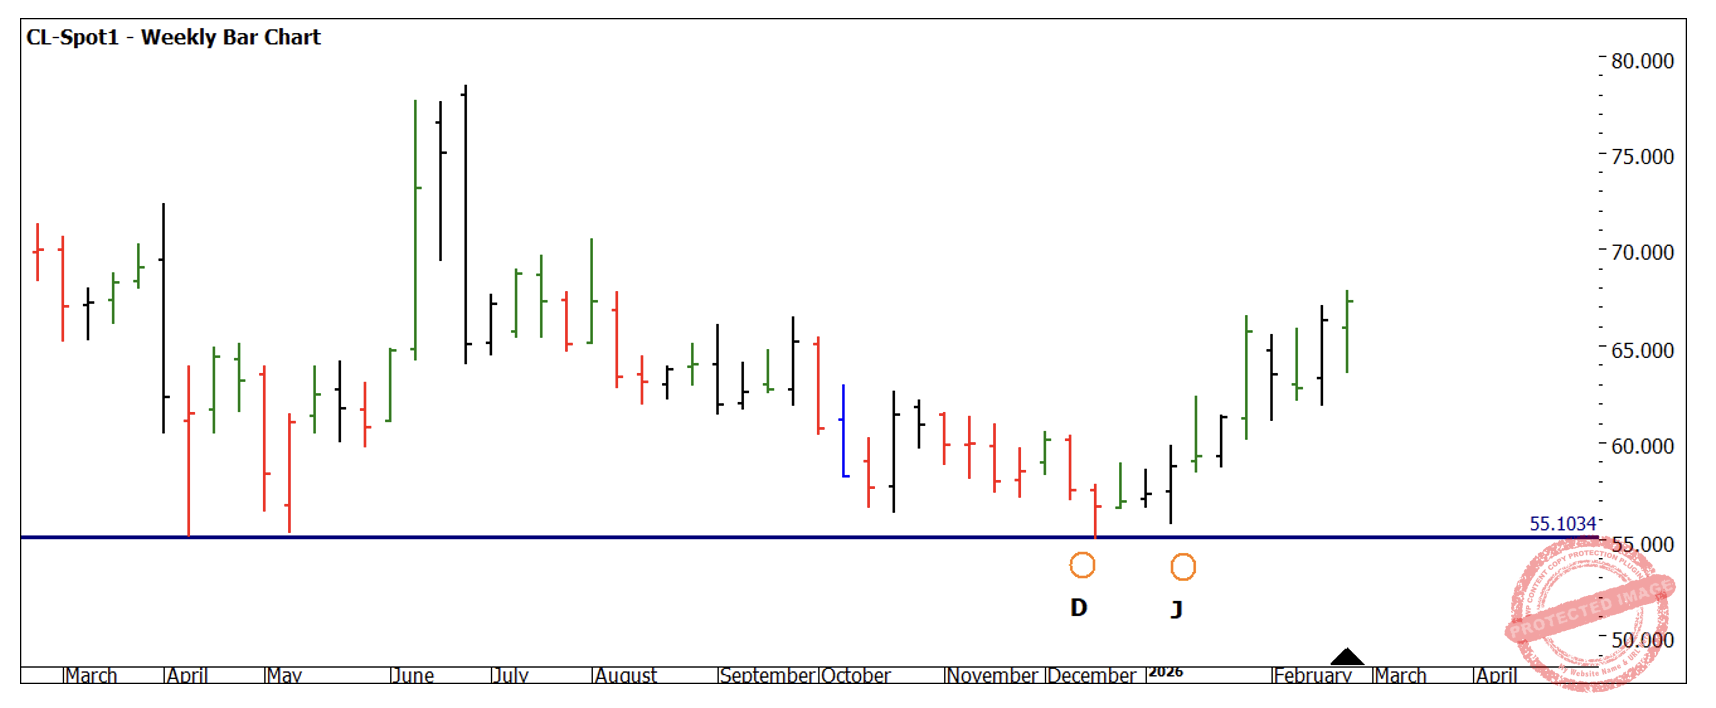
Chart 1 – Weekly Bar Chart CL-Spot1
Your first point of study should be to understand how our price forecasting techniques could have generated a cluster around the $55 level.
Moving to the daily chart, Chart 2 shows the trend progressing with Point A sitting on support with the first higher bottom pattern appearing around late February. The challenge being here were several outside and inside days present, the notion of limits within the ABC pattern where also stretched.
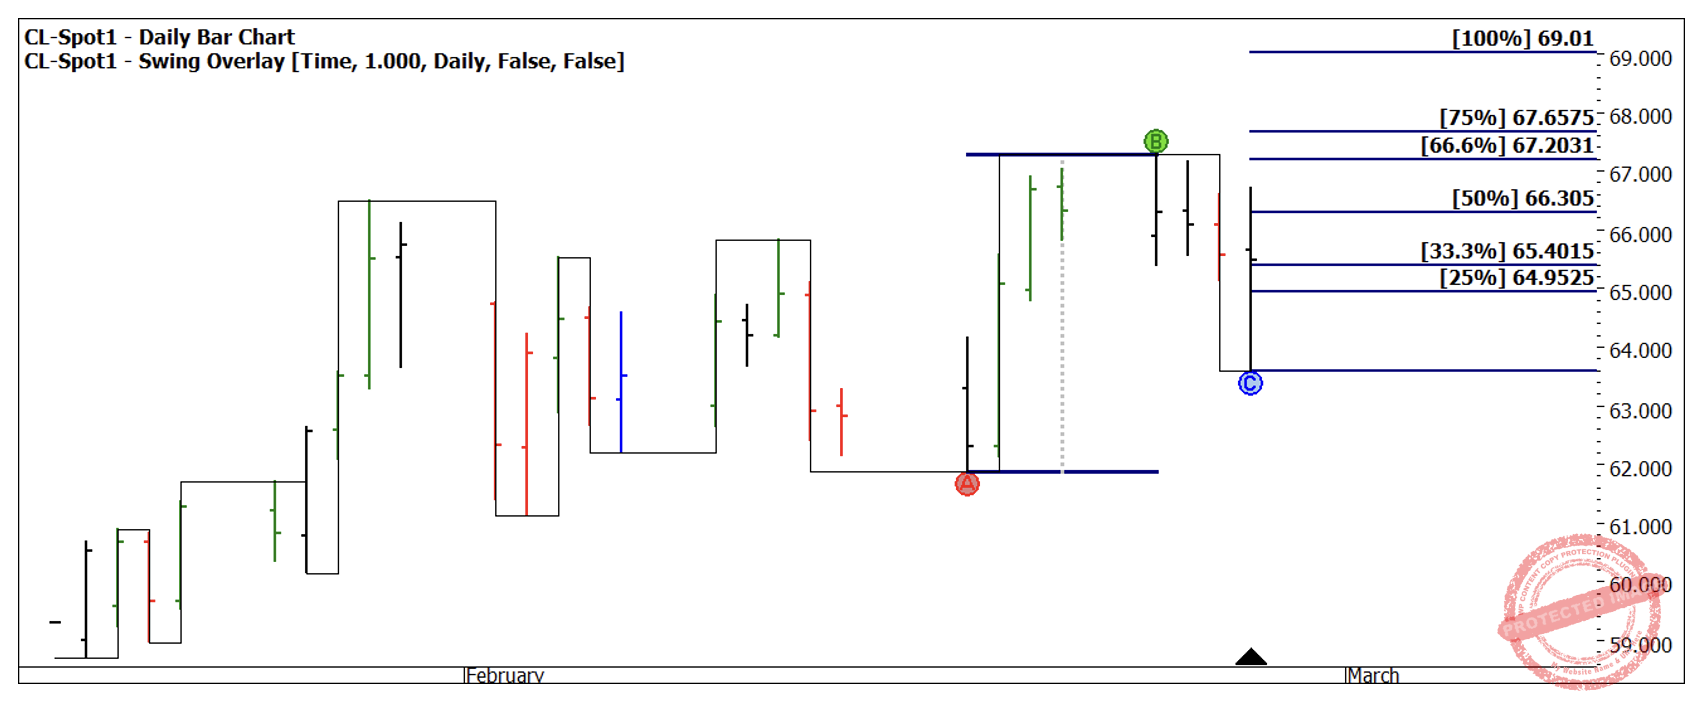
Chart 2 – Daily Bar Chart CL-Spot1
The higher swing bottom was confirmed on the 27th of February, however, there are a number of variables that would have to be managed. For example, where to place stops, how to mitigate a poorer reward to risk ratio and a handful more.
I am suggesting it could have been done and no doubt traders using a myriad of methods got long on the 27th, but I am unsure within our framework how that could have logically been achieved. Using our methods we would likely have entered a least a week before but again a stretch.
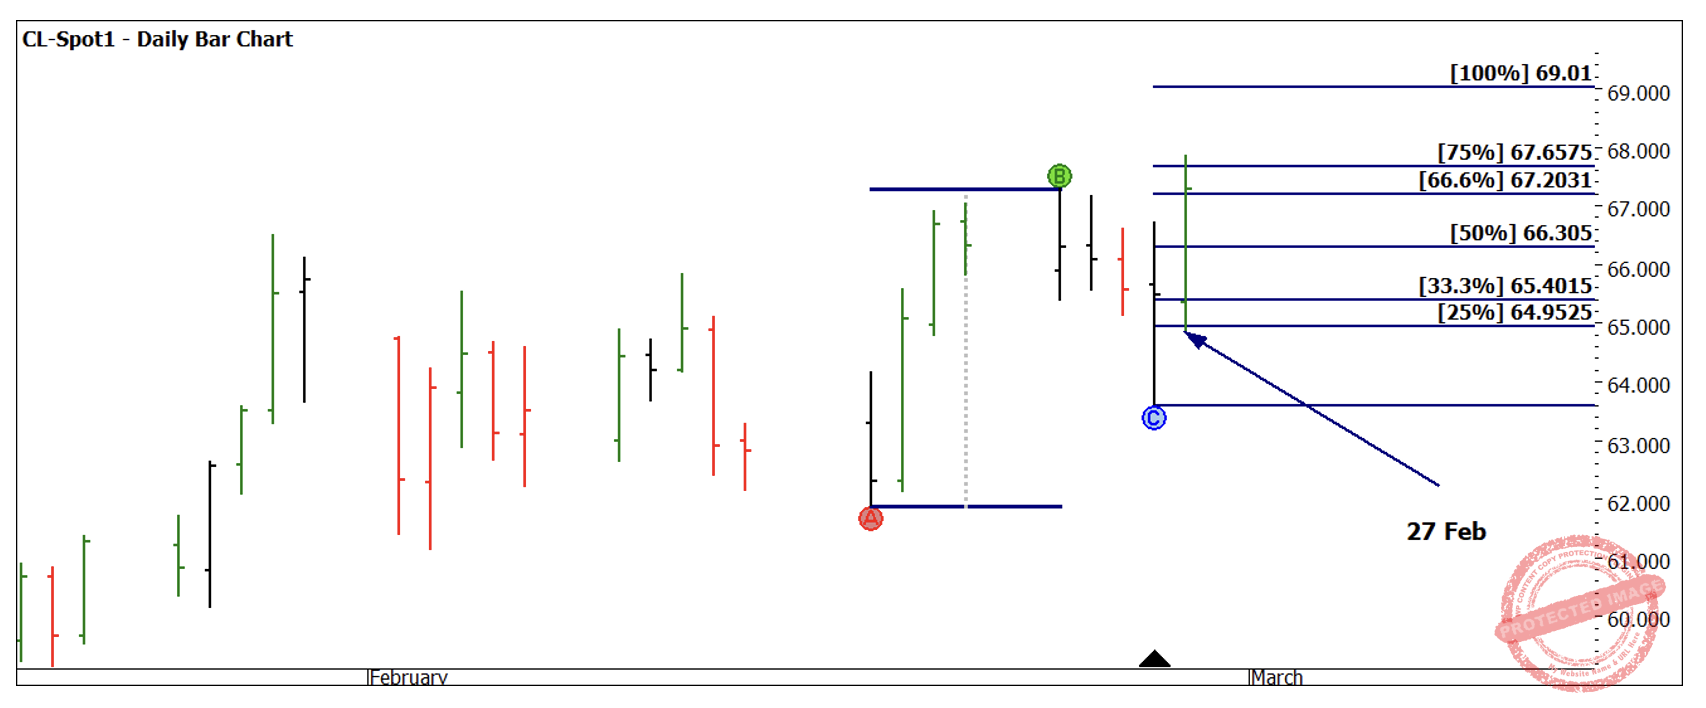
Chart 3 – Daily Bar Chart CL-Spot1
Over the weekend the military campaign kicked off, markets were closed and therefore prone to a volatility spike that can be very hard to manage.
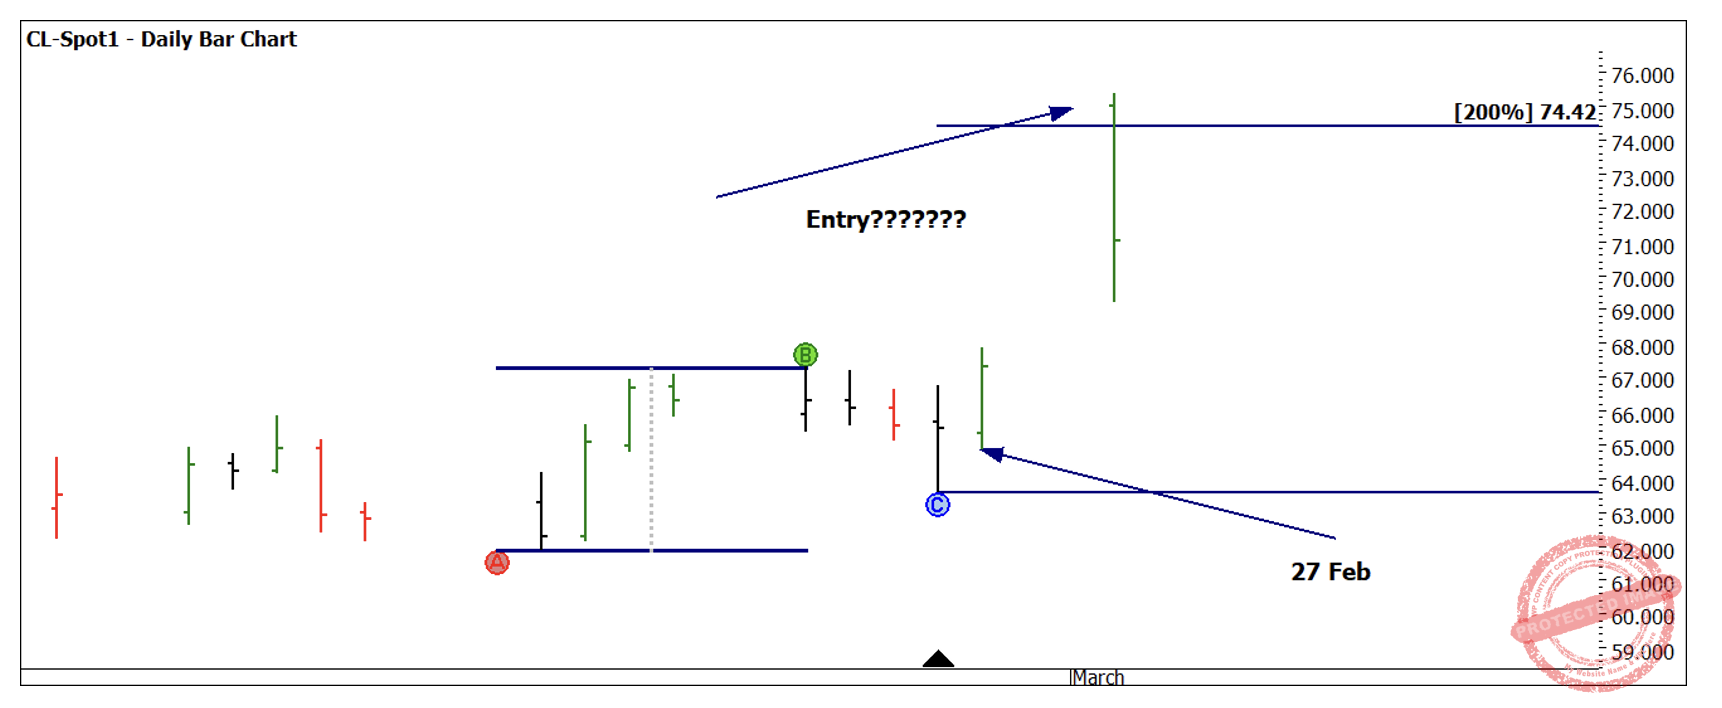
Chart 4 – Daily Bar Chart CL-Spot1
Assuming you were long and held during that day you were well placed to enjoy the coming ride.
Chart 5 shows the following week which was the easiest in this recent move. An Openers Rule on the 3rd March was the next most logical entry signal.
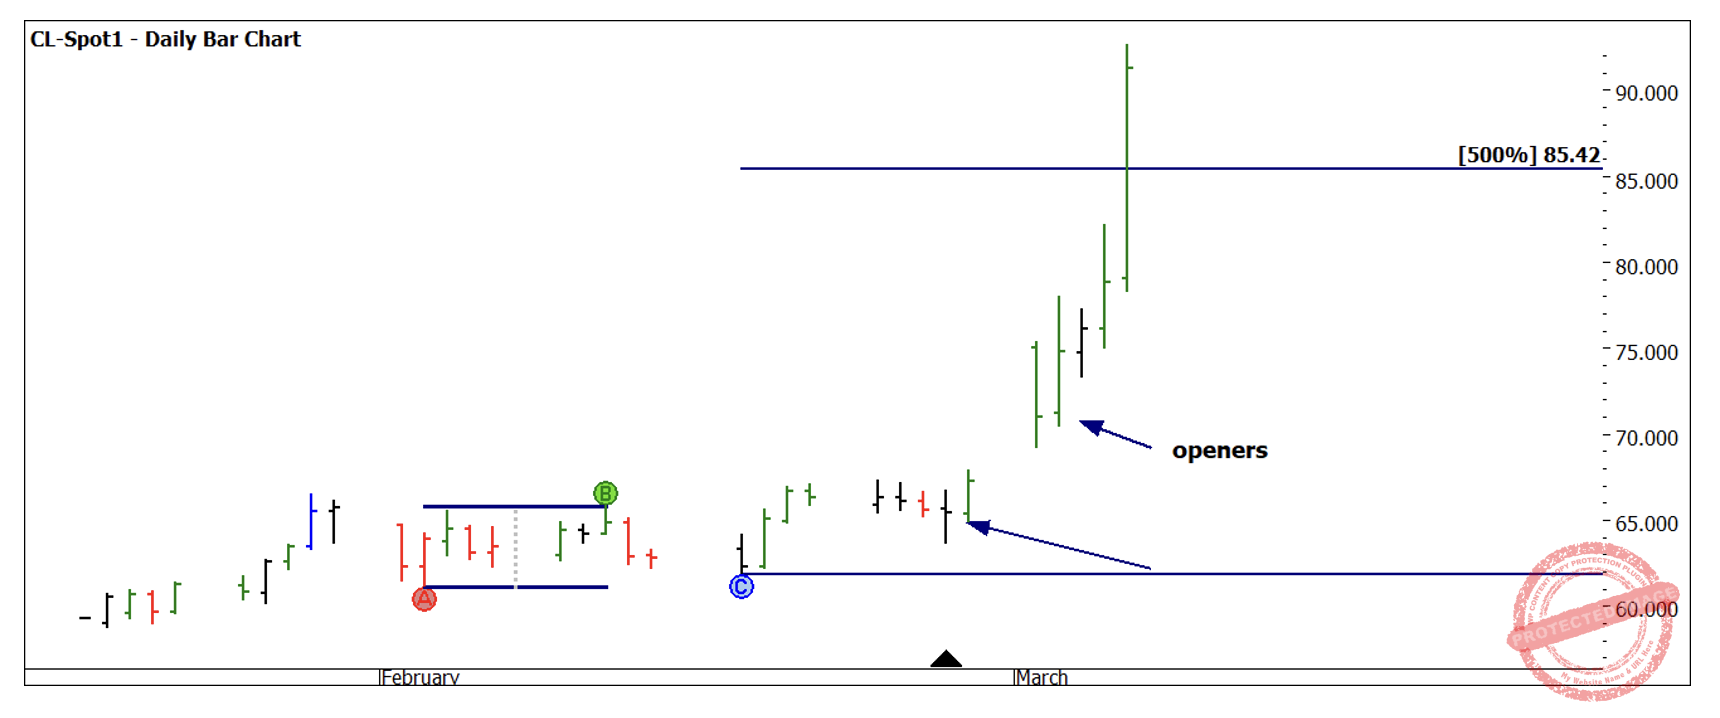
Chart 5 – Daily Bar Chart CL-Spot1
The 9th of March produced an historic day as the range produced was extraordinary, the daily bar was $38.29, there is no technique or insight that I can share with you that would allow you to stay in a position on this day with that volatility. The volume shows an increase and suggests a day where stops long and short were triggered regularly but only those who had been set at prices much lower could hold on for what was an impossible day for traders. Having watched the session many would agree it was better to be out wishing you were in.
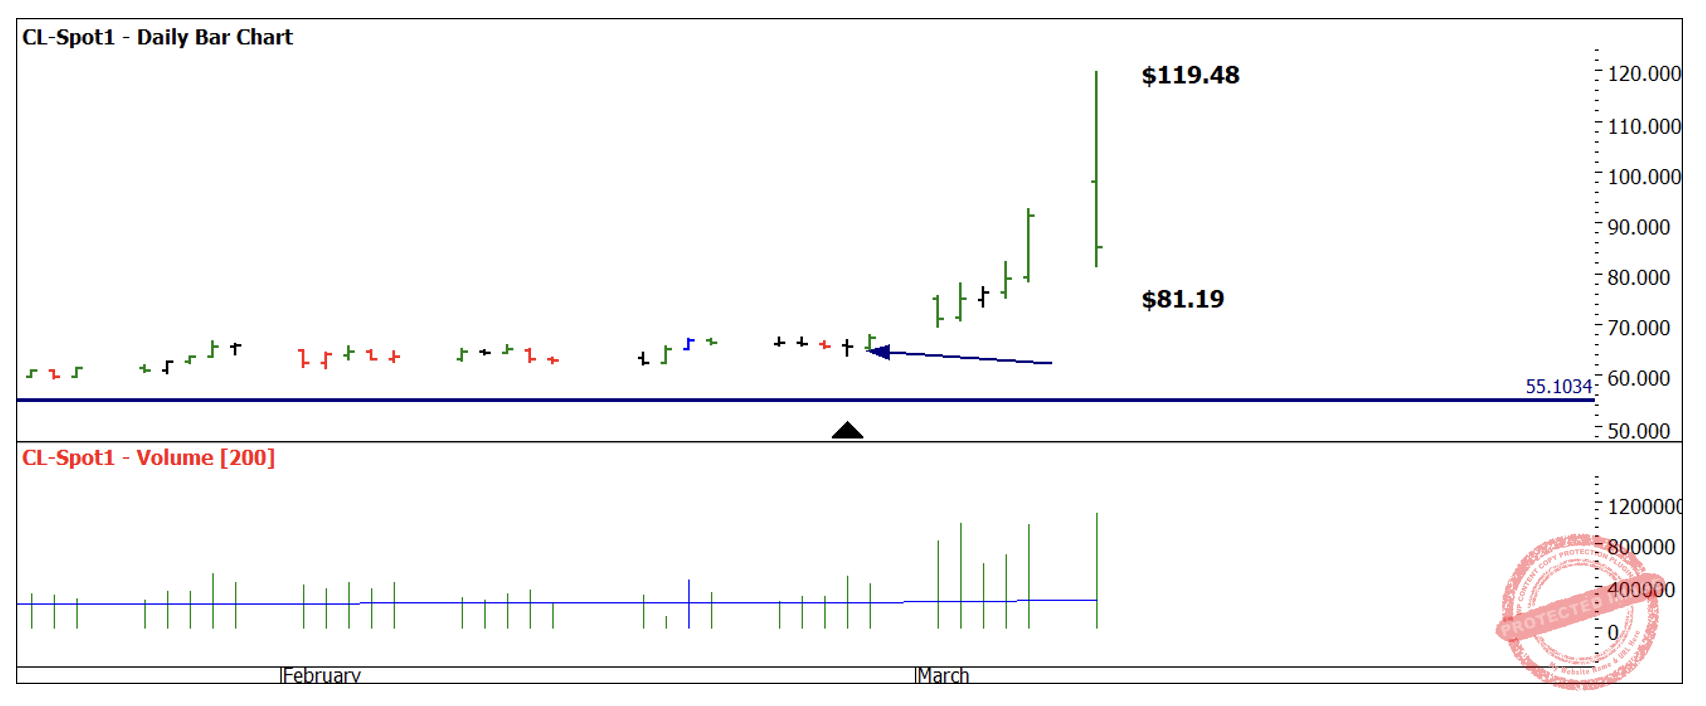
Chart 6 – Daily Bar Chart CL-Spot1
We all like to be in the markets when volatility is concerned, it produces its own challenges and, in many cases, it’s better to be out waiting for the trend to establish.
The takeaway for me from this period of market is we can enjoy the benefits of volatility when we are already in and get swept along but chasing it once it has started is a challenging game. Not impossible, but one that must be treated with a great deal of caution.
Good Trading
Aaron Lynch