BHP
At the time of writing, the sting of inflation has hit the US markets as the hope that the numbers were turning in the right direction was dashed and the “doves” of more interest rate rises are set to be released next week when the US Federal Reserve meets again. In turn stock markets reacted south as they attempt to process the news.
In short, rising interest rates are bad for stock markets generally and this will flow through to our own inflation numbers no doubt, so we need to brace for higher rates. That is not all bad if you are a cash investor, it means better returns after what has been a pitiful time for that asset over the last 10 years. For those with a mortgage more increases are on their way. If we frame asset classes as being a situation of money flow, moving from weak to strong or high risk to safety there is likely to be opportunity for the trader who is only interested in movement and direction as opposed to long term appreciation.
As primarily a commodities trader, my focus draws me back to stocks that link to hard assets so it’s not surprising that I am drawn to BHP. As Australia’s largest stock by market capitalisation it’s fair to say it’s well known and of course it has global reach as it’s projects are not just within our borders. This market is a great one to research and study, and as we all know one of the exercises from the Smarter Starter Pack is all about BHP. I wonder if that is still on your to do list?
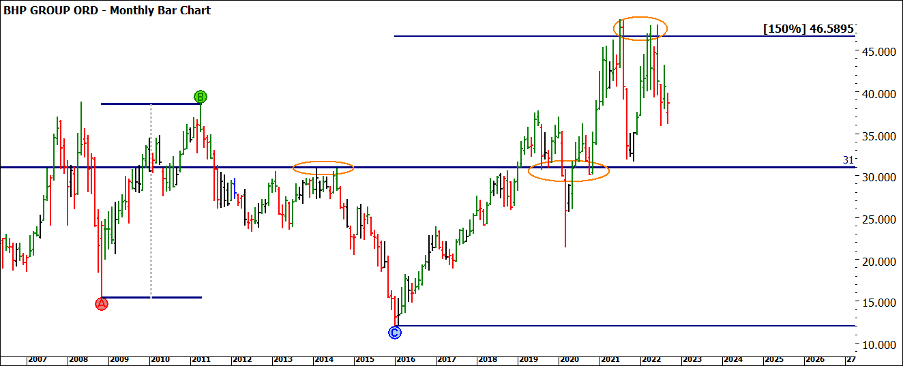
Since 2016 where the market formed its $12 lows, we have seen significant price increases to highs this year at approximately $48. Chart 1 below displays the considerable rise and when you consider they have paid out around $13 a share in dividends, it’s been a good news story. You will also note a line at $31, this will become useful going forward but just note the support and resistance at that level and the 150% level of the double bottoms.
Chart 1 – Monthly Bar Chart BHP
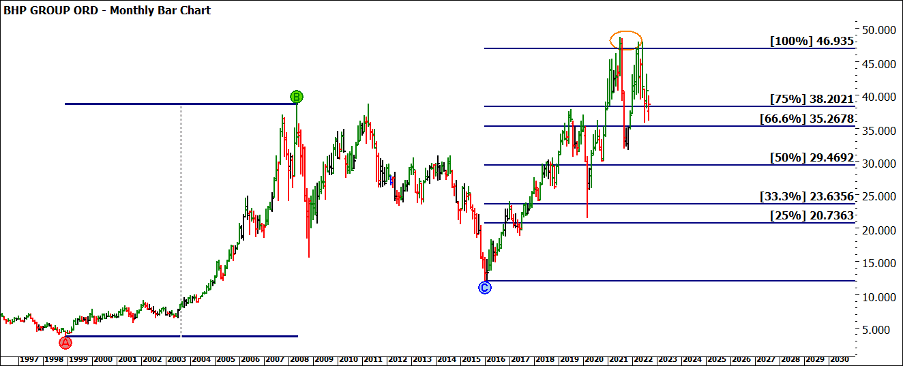
The story we all know is history repeats, the bigger the reference points we use the more weight we can place on them. It would be wise to note the bull market range from 1998 to 2008 repeated approximately 100% into the current yearly highs (Chart 2)
Chart 2 – Monthly Bar Chart BHP
We can contend then that the current highs have some solid harmony on a price forecasting front and are likely to be in play for the medium term. If that is the case and the bear continues to claw down asset classes, inflation persists, and rate rises are thrown out as blunt tools to curb spending, we may see lower prices tested.
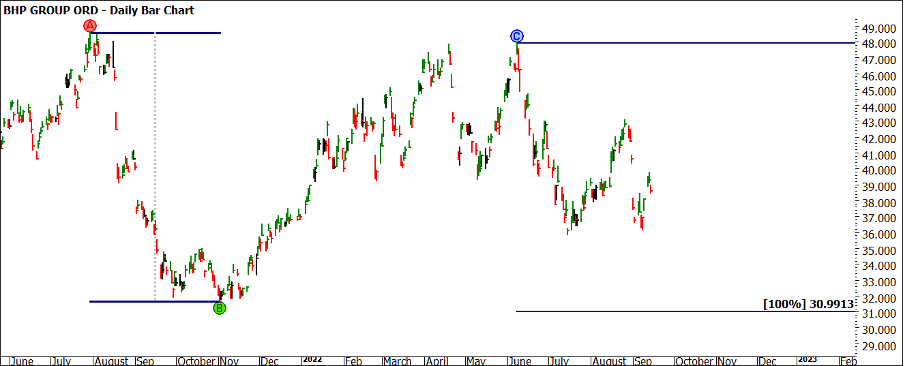
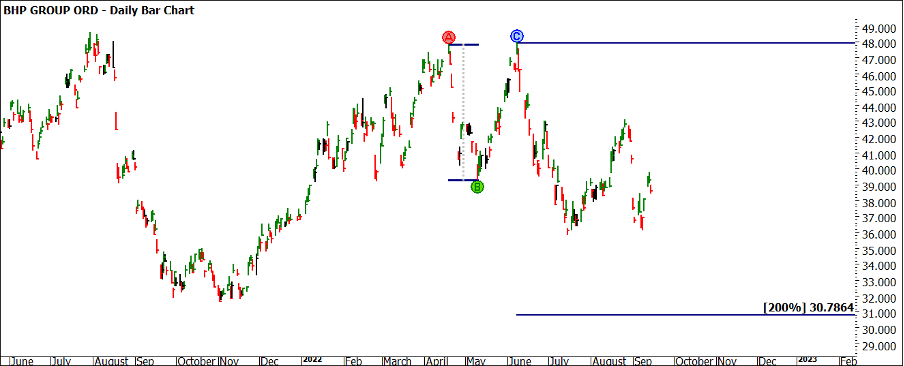
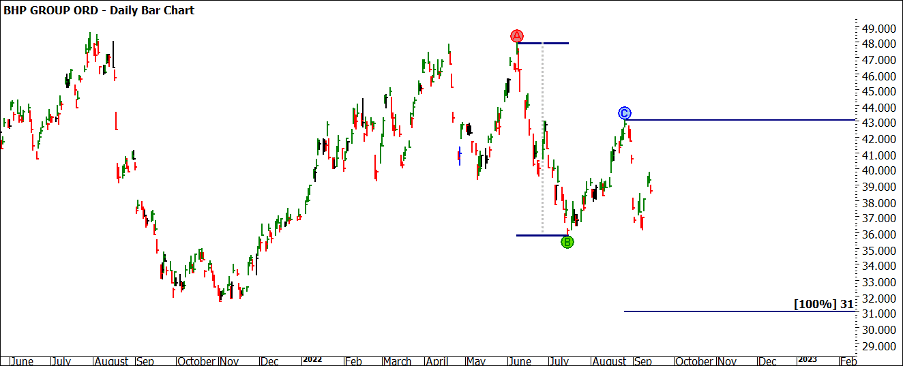
In that case I turn to the same tools to project lower and am simply relying on prices to repeat. There are several tools we have access to here but let’s keep it simple with ranges repeating. The following 3 charts project prices lower using big picture turns, I challenge you to see what other tools and techniques can cluster around the $31 level.
Chart 3 – Daily Bar Chart BHP
Chart 4 – Daily Bar Chart BHP
Chart 5 – Daily Bar Chart BHP
Utilising one technique on three separate market sections it’s amazing how the repetition comes together, I never get bored when the market proves the rules. Now of course this could all play out to be wrong and have no significance, hence we have a trading plan with rules to dictate our transactions in markets. However, that area will likely prove to be strong support and then potentially resistance. I do hope you will keep in touch with this market and see how it develops.
Good Trading
Aaron Lynch
