BHP – Follow Up
Welcome to the next edition of the monthly newsletter, for those who are currently impacted in Victoria, Australia with tighter lockdowns related to COVID my thoughts are with you. Also, to the Safety community around the world, this has certainly been a challenging year to date.
Markets in Australia have again started to show some signs of life and I thought I would follow up on BHP that we discussed in last months newsletter. There is nothing more frustrating to a trend-following trader to see a market move sideways and offer short or choppy moves. The downside of this environment is we can find it hard to hold positions due to volatility and it provides an environment where we can easily overtrade. I can certainly attest that overtrading has been an issue I have had to manage, and David often mentioned it was a challenge for him as well.
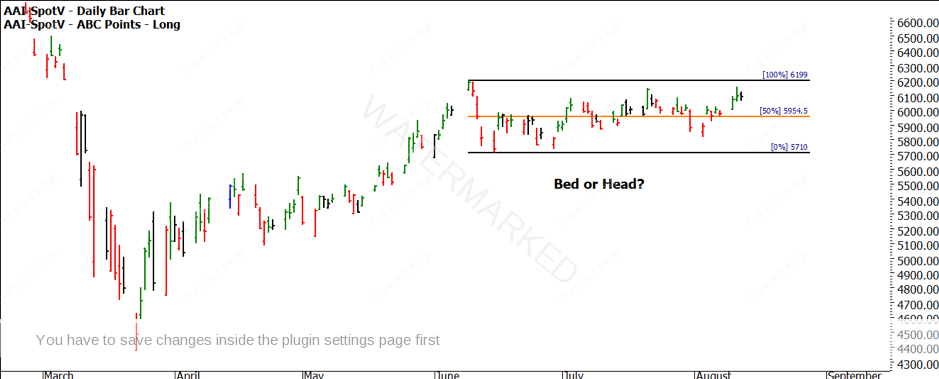
We discussed how the SPI200 had been sideways for a reasonable period of time and how certain stocks that make up the index can provide clues to what’s next. In Chart 1 below, we can see the SPI moving again to challenge the upside of the resistance at 6199. I am drawn back to lessons from Frank Tubbs (via David’s revival of his work) whereby he discussed “beds of preparation” or what can be a head of distribution. The challenge is knowing which one you are witnessing.
Chart 1 – SPI200 Daily Bar Chart
If we return our focus to BHP, we can breakdown its recent moves. It would be wise to review my last article and recreate the charts.
I will break down the swing chart picture with particular focus on the swing ranges in line with the small picture Gann retracement tool. There is, of course, more we could add but this environment can become cluttered and hard to read if we add too many aspects to the chart. We should try to keep our focus simple and form read the chart.
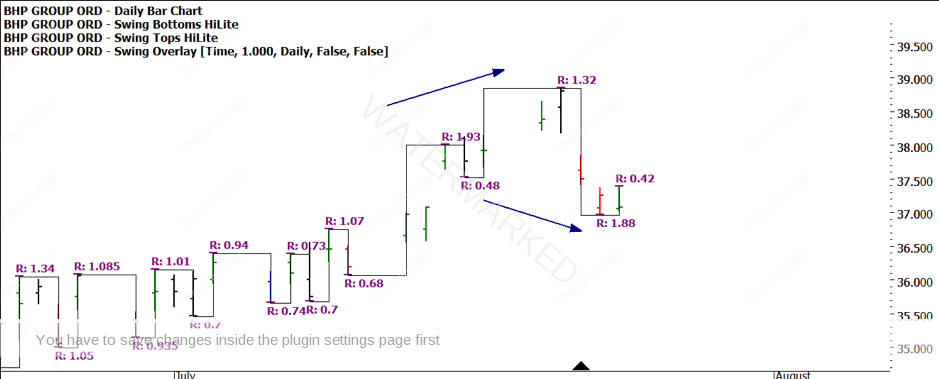
In Chart 2 we pick up around mid-July as BHP price action had jumped higher and then retraced. We can see how the upside swing ranges are contracting ($1.93 vs $1.32) and downside ranges are expanding ($0.48 vs $1.88). The gap was also closed so we may be expecting some further downside. The trend on the 1-day swing chart is uncertain.
Chart 2 – BHP Daily Bar Chart
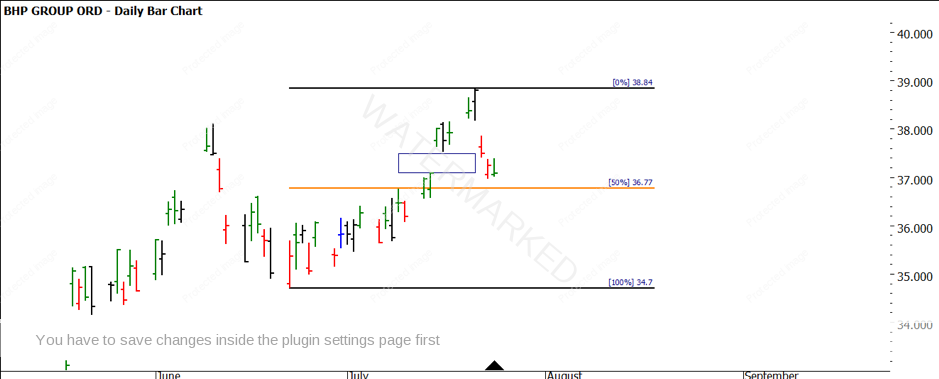
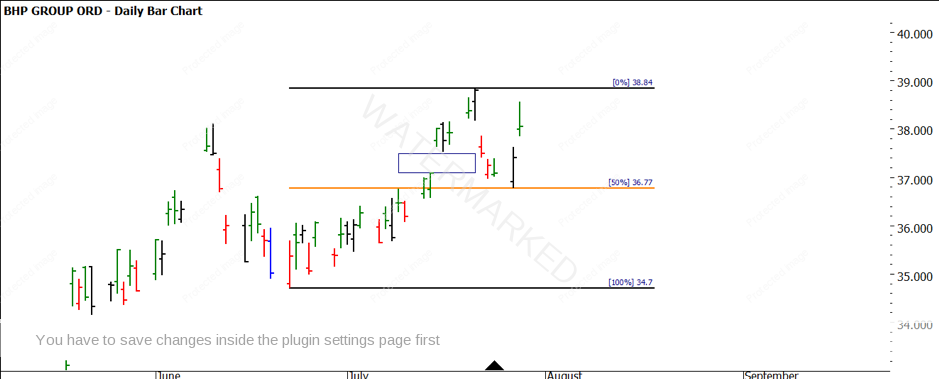
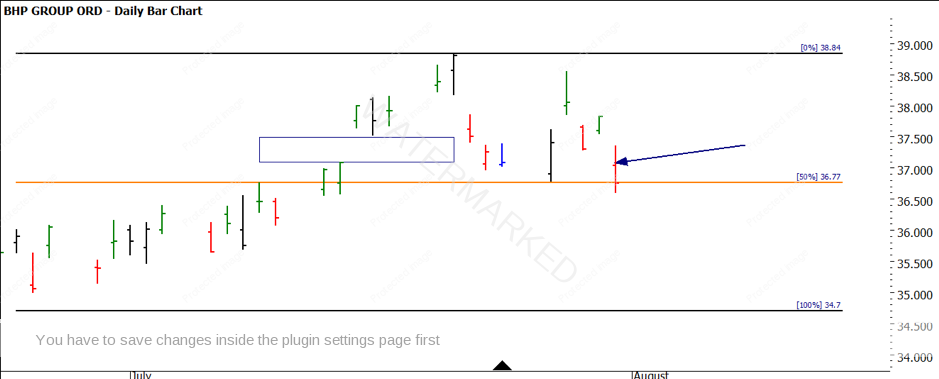
Chart 3 show our retracement tool on the small picture, we should be closely watching the 50% level for some reaction.
Chart 3 – BHP Daily Bar Chart
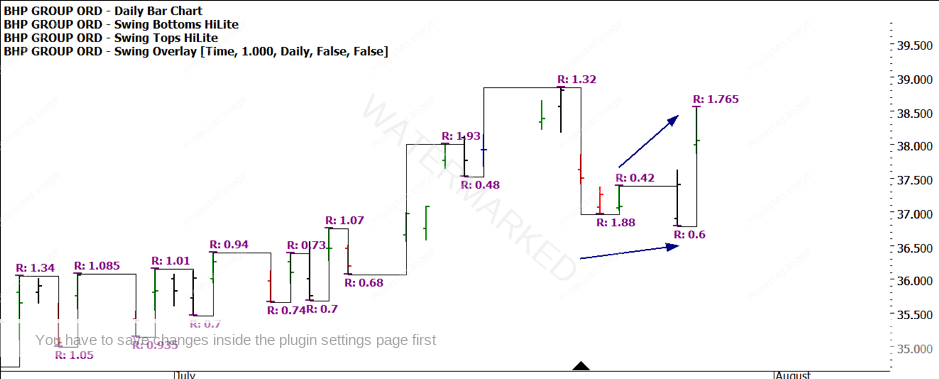
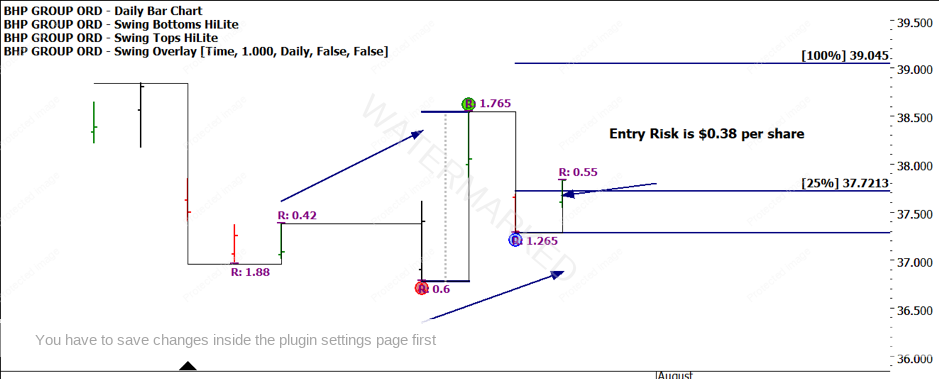
As we step through the next 2 days, we see post the weekend an outside reversal day to the upside with the market finding support at the 50% level 1 cent above at $36.78. As Charts 4 and 5 show, there has been a change of momentum with upside ranges expanding and downside ranges contracting. There is also a potential overbalance in price setup to the long side. It would also be prudent to check the volume pattern here and you can see why the potential for a long setup was an option.
Chart 4 – BHP Daily Bar Chart
Chart 5 – BHP Daily Bar Chart
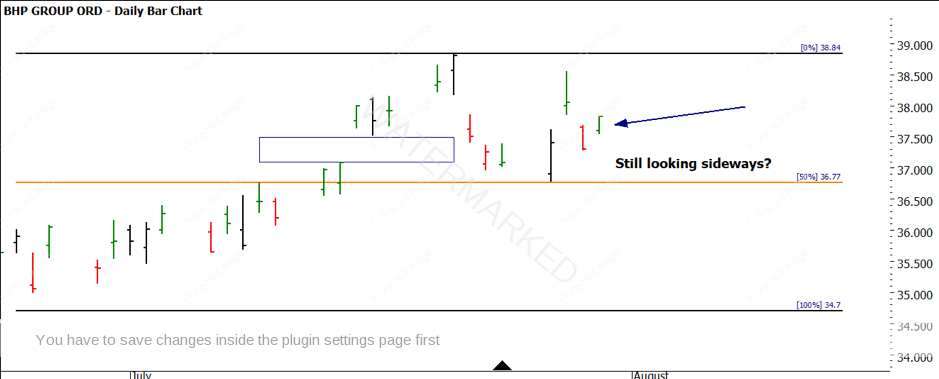
As we progress another 2 days forward we can see if we were happy to take a first higher bottom entry then we can enter a long trade with a risk of $0.38 per share, the swing chart pattern had some positive aspects but does the overall market still look sideways? We can see this in Chart 6 and 7.
Chart 6 – BHP Daily Bar Chart
Chart 7 – BHP Daily Bar Chart
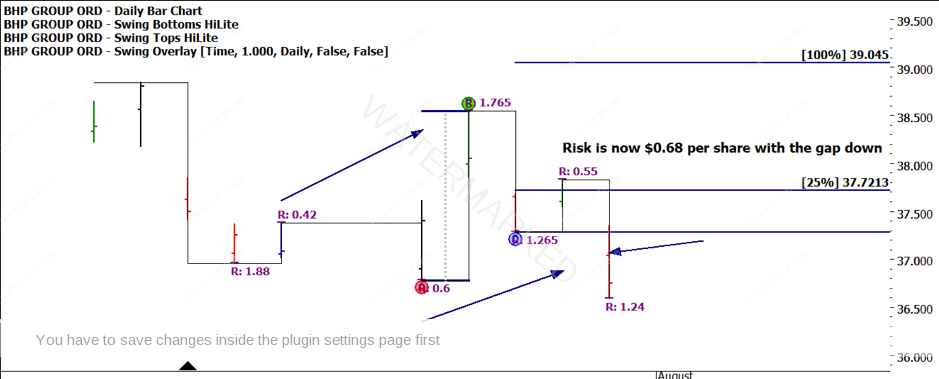
As we step to the next day, we are faced with a gap down that increased our initial risk and depending how you managed stops (intensive care rule) would most likely have you questioning your analysis.
Chart 8 – BHP Daily Bar Chart
Chart 9 – BHP Daily Bar Chart
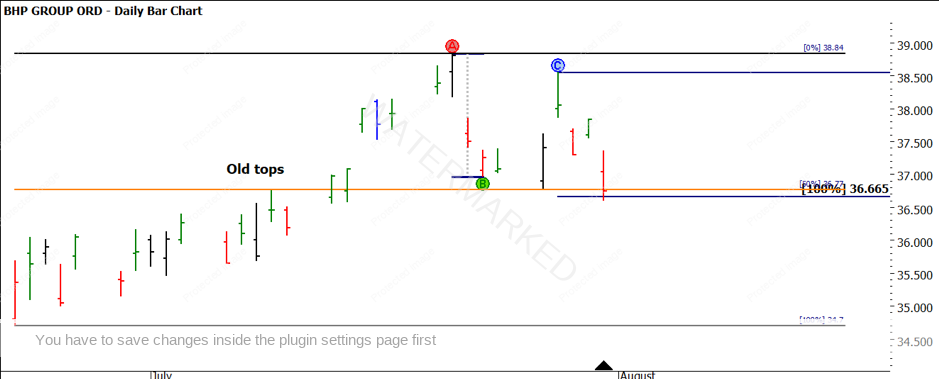
If we examine the current position with a view around Price Forecasting, we can still see the 50% level at $36.77 in play and we are now looking at a potential, very small picture, double bottom. We add Chart 10 and we can see the downside swing range has just repeated 100% down into the 50%. Were we potentially just a little early on the long side? For those that utilise Time by Degrees in their analysis, you may research the harmonies on the 31st July as opposed to the 29th of July.
Chart 10 – BHP Daily Bar Chart
One of the hardest skills to muster as a trader is to be able to hold to your analysis on the big picture if the small picture keeps bumping you off. This is where time-based techniques are a big help to combine price with time.
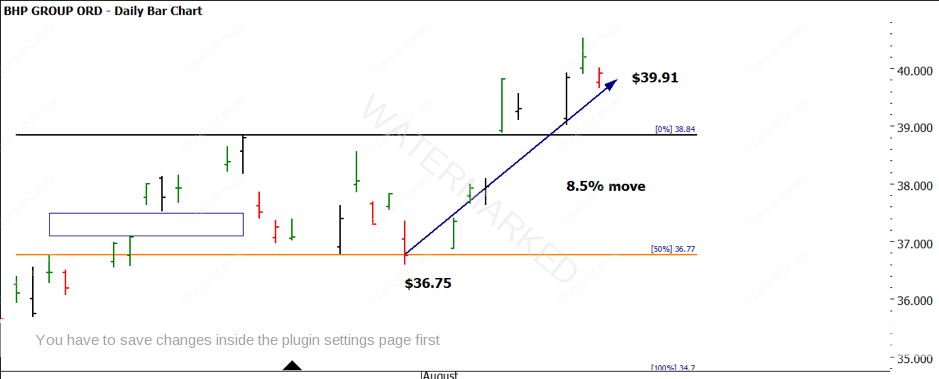
If we fast forward to current day, you can see the price action moved from a close of $36.75 to $39.91 with a potential ABC long trade for the next session. This move is approx. 8.5% of the share price in under 2 weeks, with the potential for more.
Chart 11 – BHP Daily Bar Chart
The task I leave you with now is, how could you have setup your trading plan to take advantage of these moves? Where could you have entered and were there opportunities to add to the position along the way?
We are at the crossroads on the SPI 200 as to whether we breakout of the sideways range we have seen to date. If the SPI is to breakout to the upside, we should expect to see the major stocks that make up proportionally large parts of that index to be in line with that move. I would expect BHP would have to assist in the heavy lifting for that to occur.
Good Trading
Aaron Lynch
