BHP
The Big Ranges
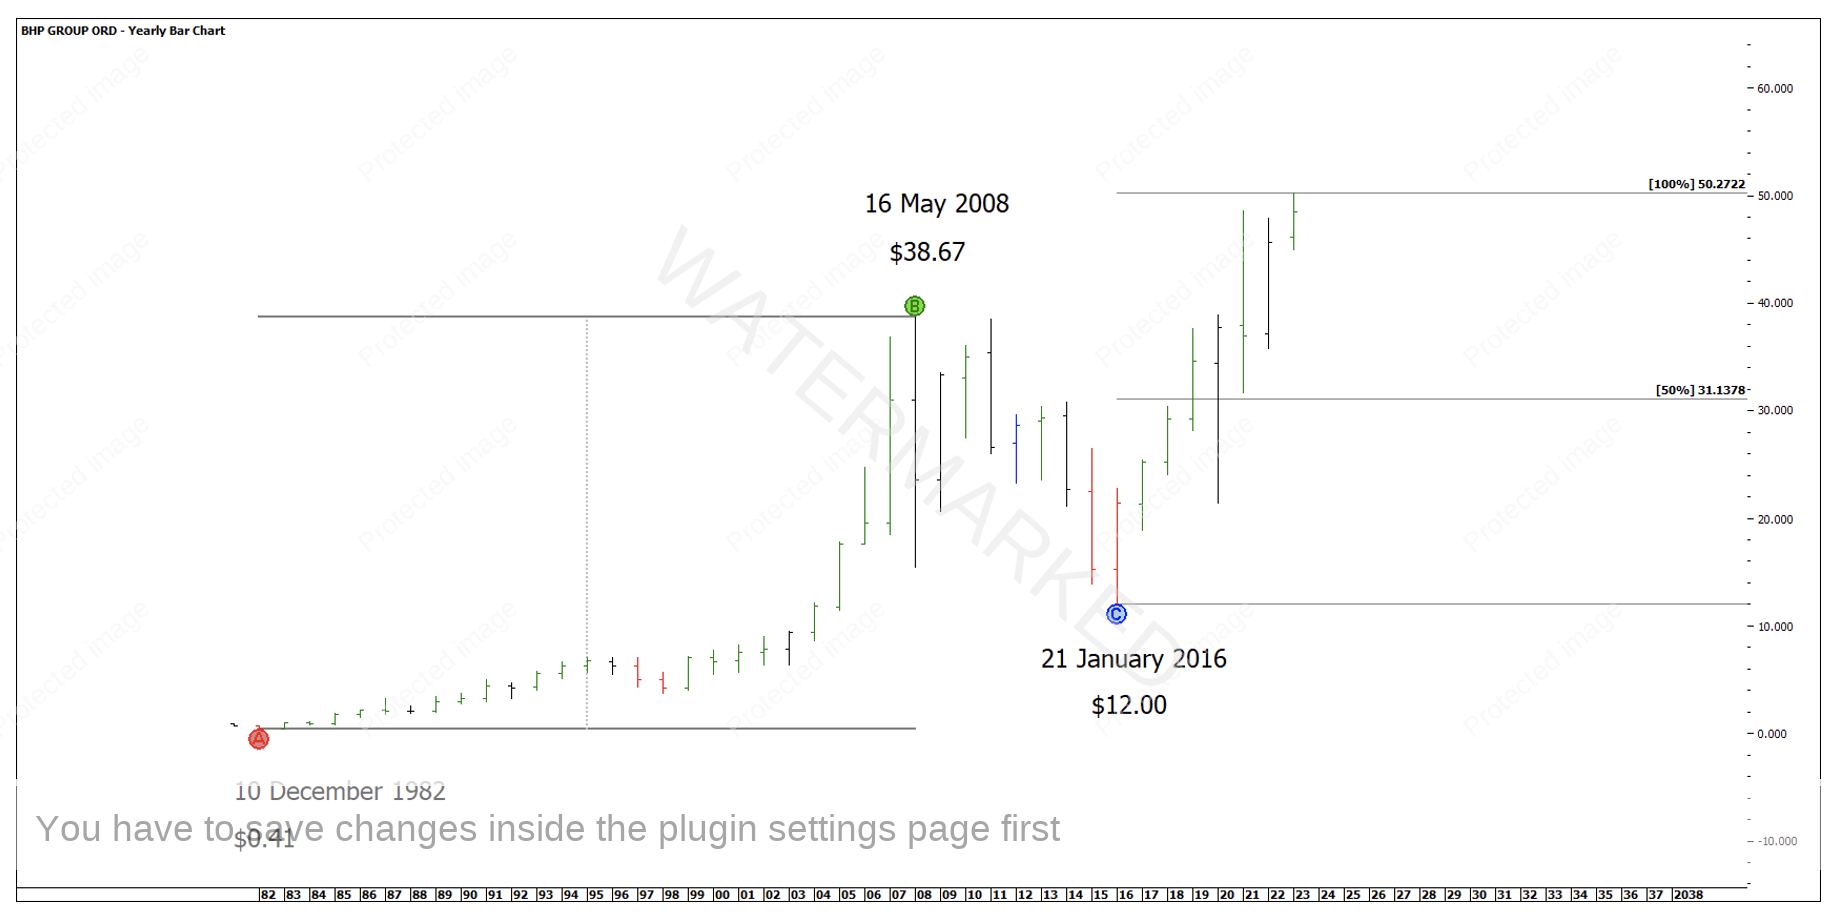
Let’s take a look at BHP this month. Looking at our big picture ranges on BHP from the All-Time Low, there is a very large picture ABC formation. At the time of writing, BHP’s All-Time High sits at $50.21, only 6 cents short of an exact 100% milestone of the ABC at $50.27. See Chart 1 below
Chart 1 – Big Picture ABC
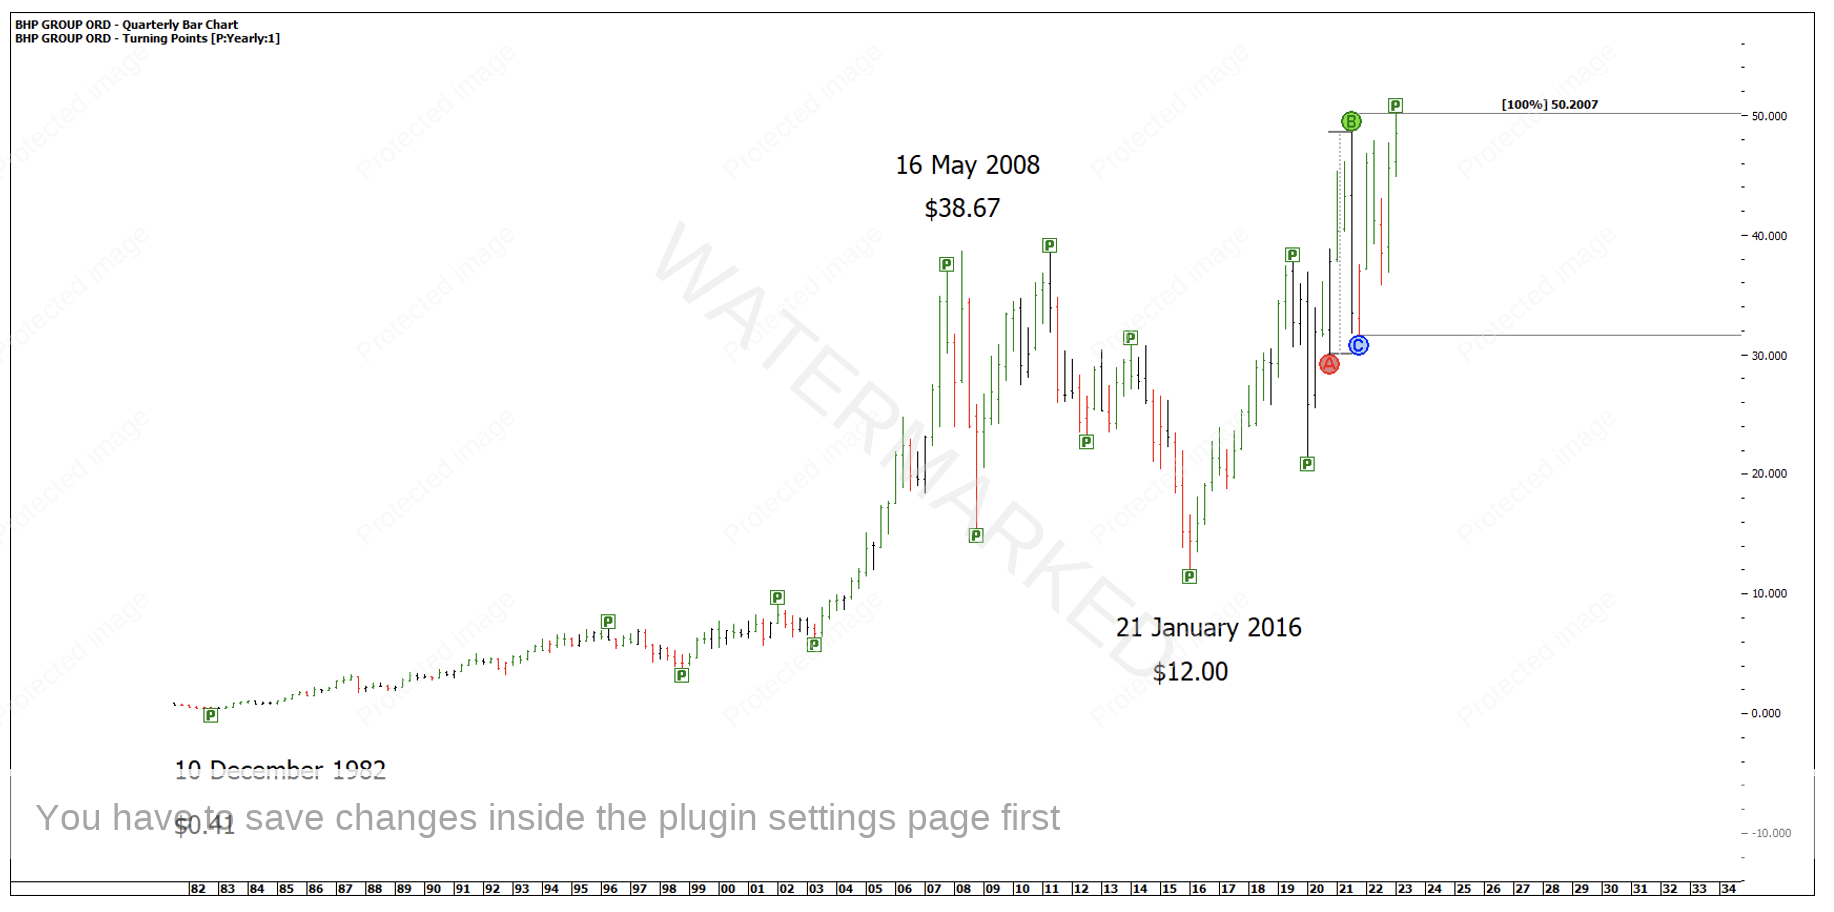
If we drop down a time frame and continue to look for big picture milestones, we find the 100% milestone of the second quarterly range up from the 2020 yearly swing low gives a price target of $50.20.
Chart 2 – Quarterly ABC
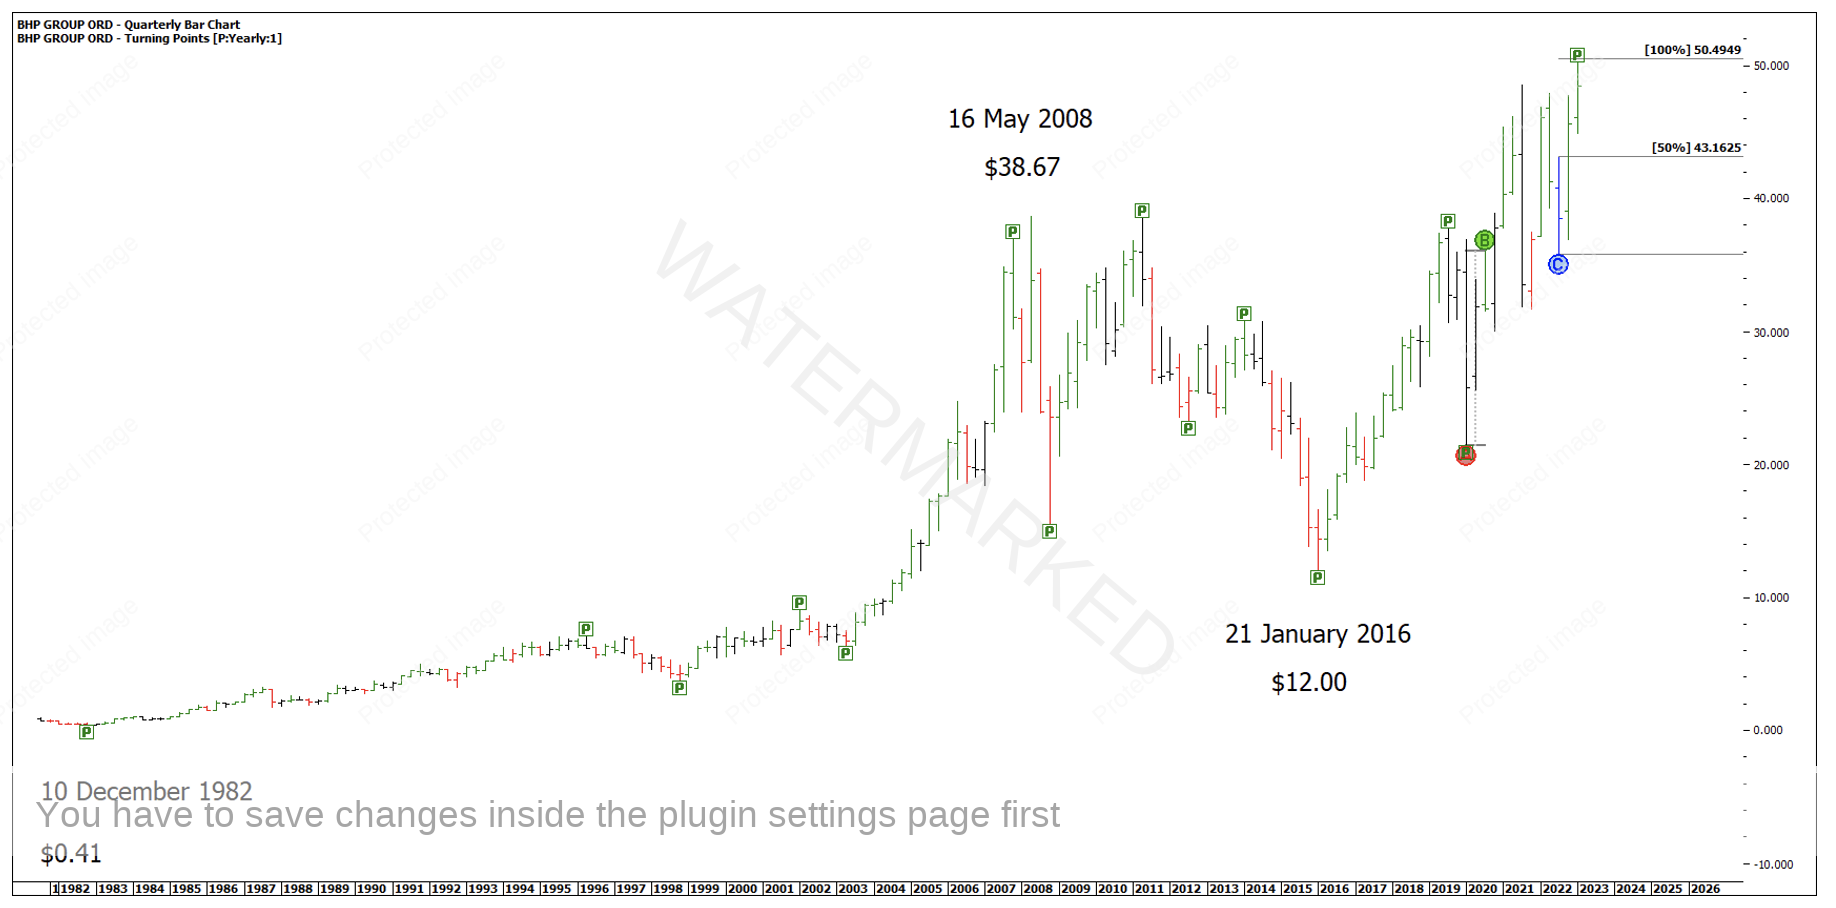
If we then run an ABC tool over the quarterly First Range Out (FRO) from the March 2020 low and then add Point C to the most recent quarterly swing low, the 100% milestone gives a target of $50.49.
Chart 3 – Repeating Quarterly Ranges
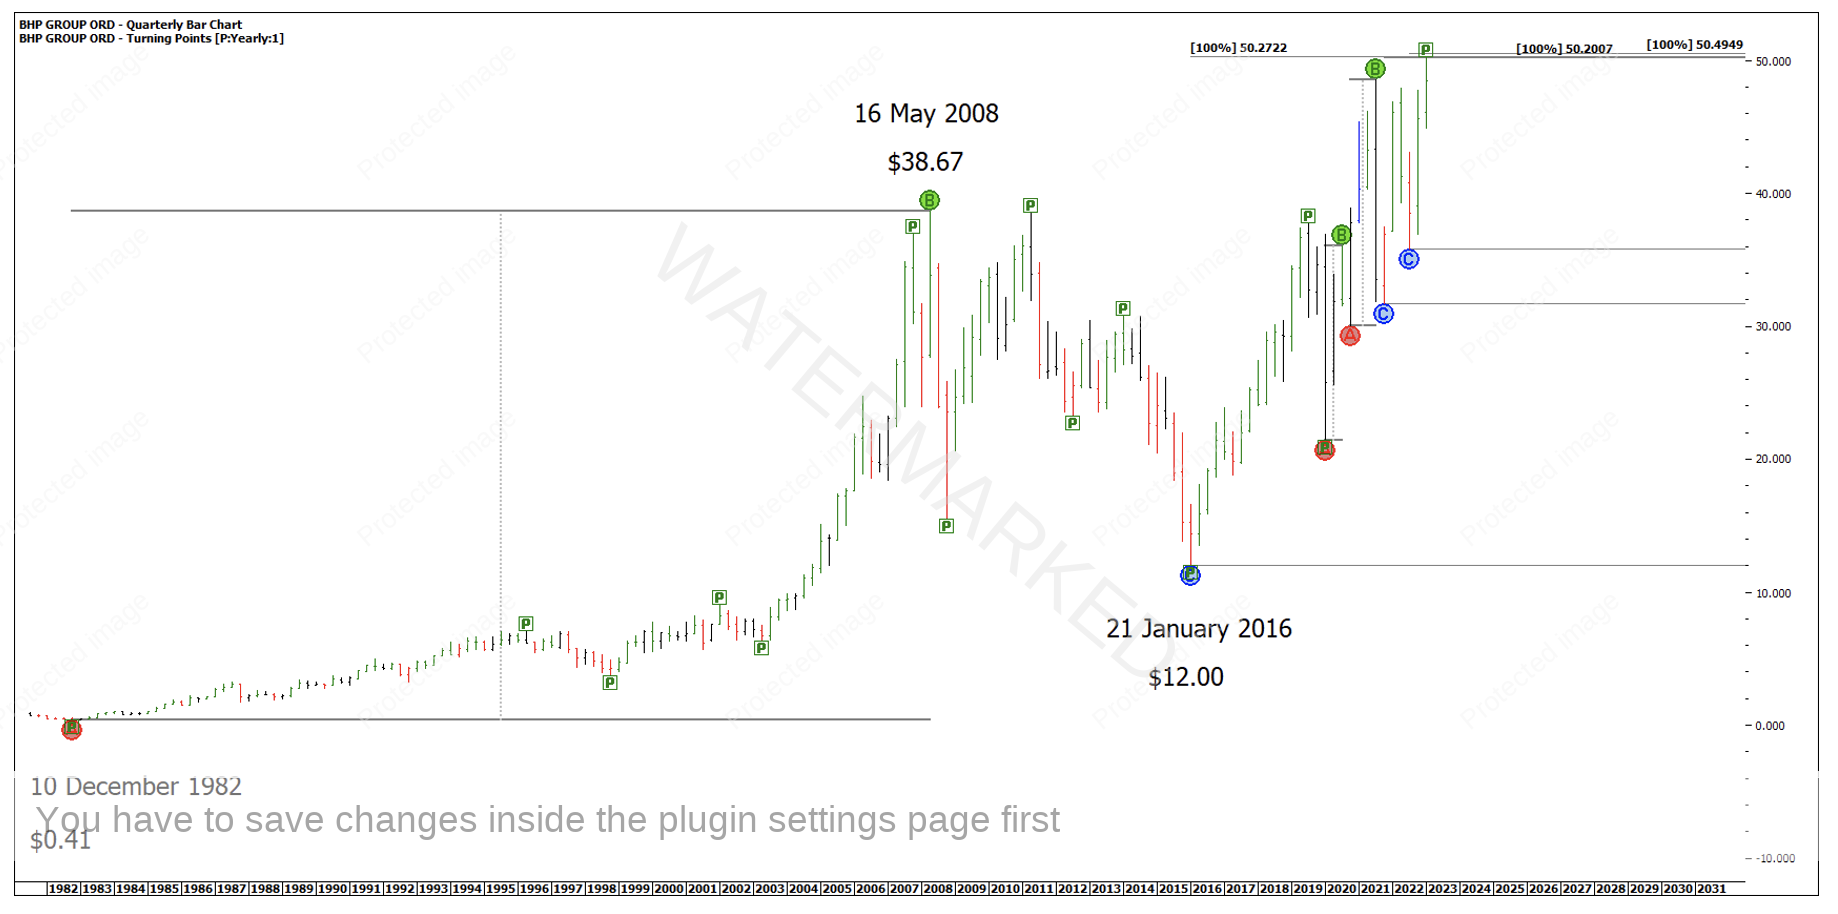
So far, these three large milestones form a tight cluster shown below.
Chart 4 – 3 Part Cluster
Now that the bigger picture milestones have been identified, we can drop down a couple of time frames and look to dissect the last quarterly swing up to look for signs of completion.
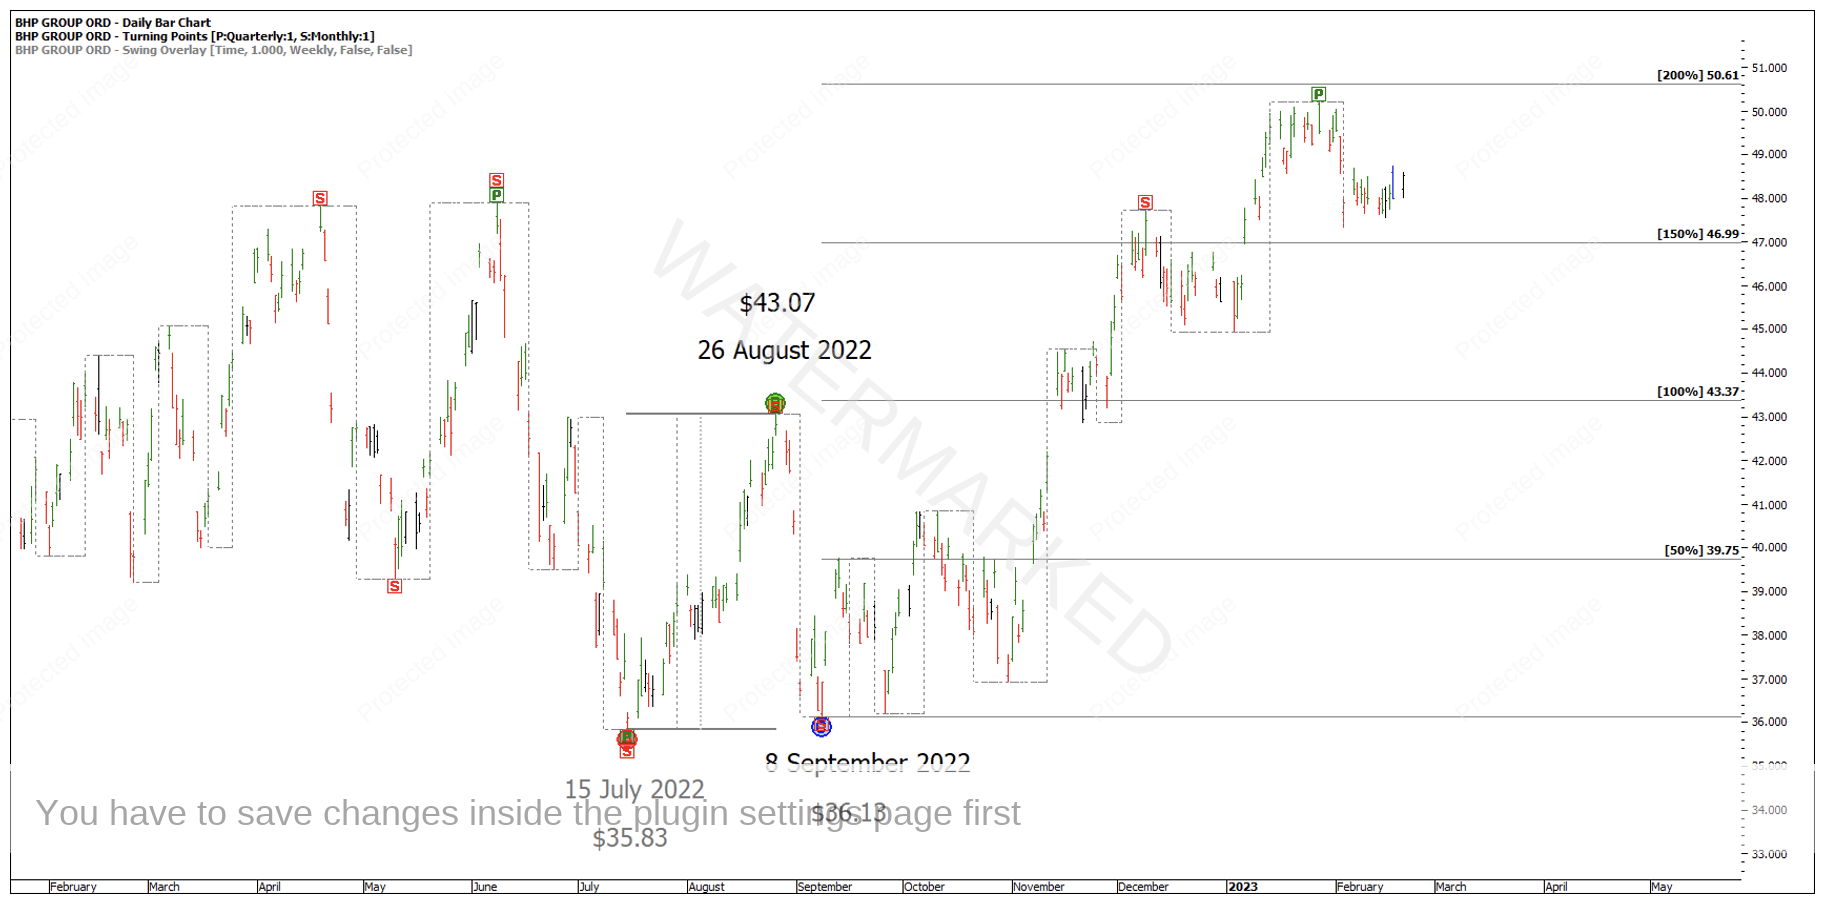
If we run the ABC tool over the monthly FRO, we get a 200% target of $50.61.
Chart 5 – 200% Monthly First Range Out
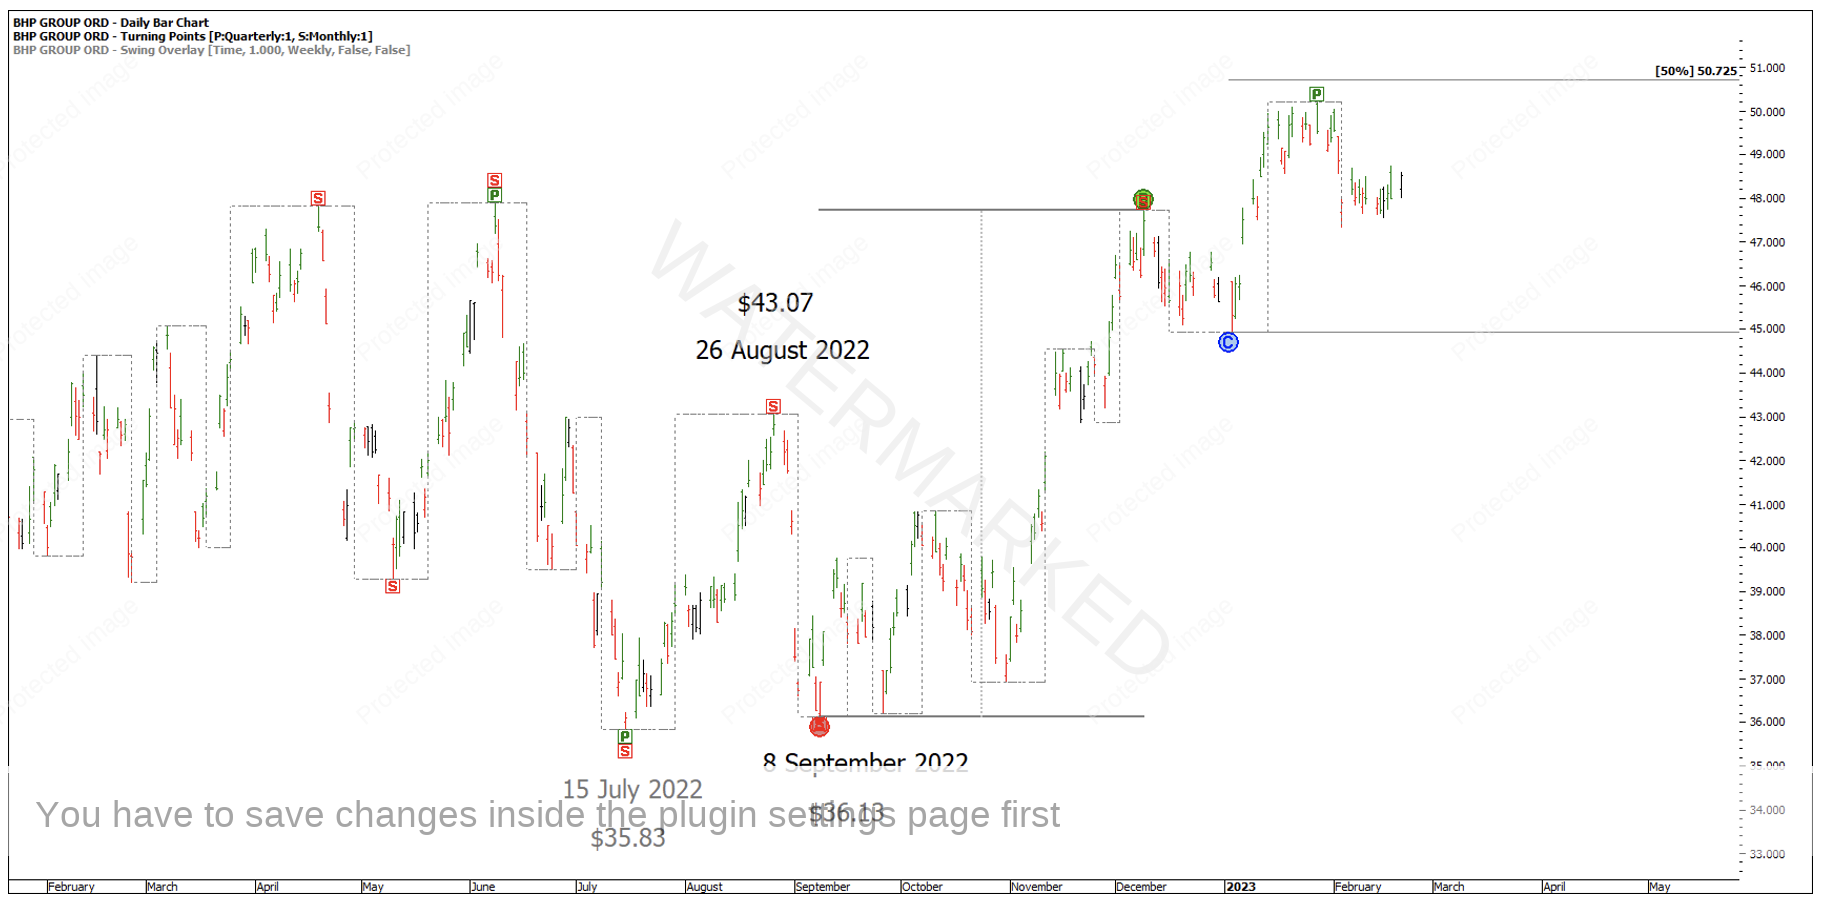
If we then run the ABC tool over the last monthly swing, the 50% milestone gives a target of $50.72.
Chart 6 – 50% of Monthly Swing
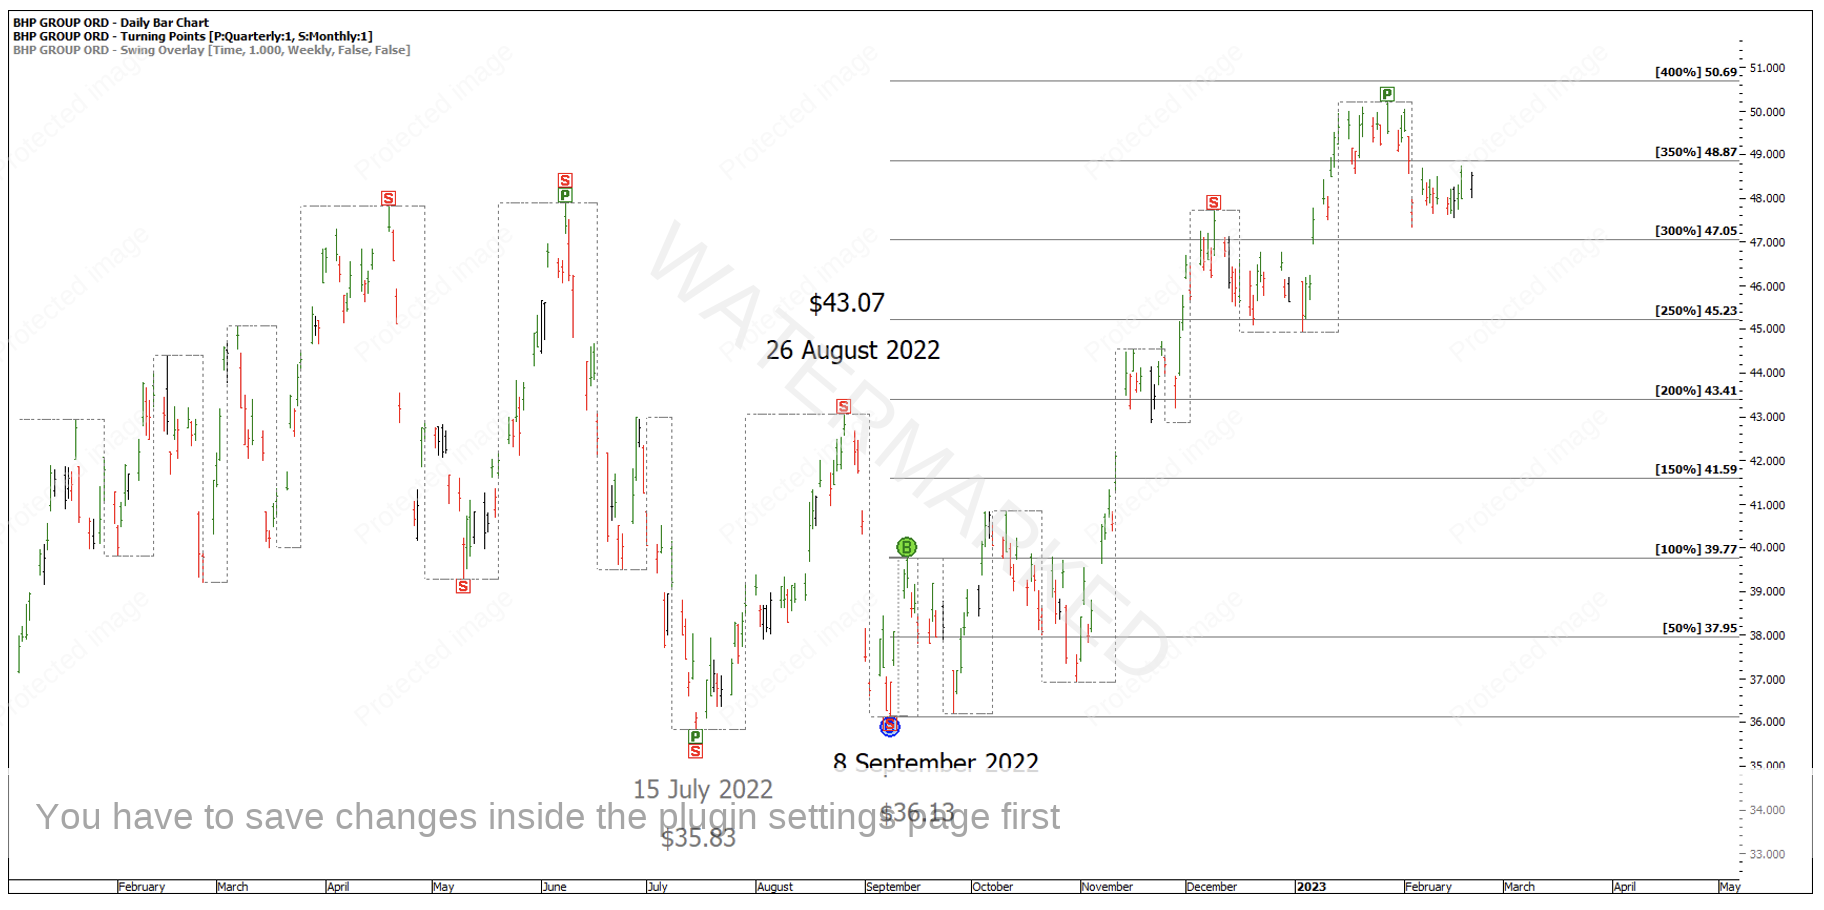
Interestingly enough, if we then apply David Bowden’s 256-point lesson from the Number One Trading Plan to the weekly FRO from the 8 September 2022 low, we get another milestone adding to the price cluster at $50.69.
Chart 7 – Multiples of a First Range Out
This is now a six-part cluster, ranging from $50.20 to $50.72. That is a difference of $0.52 cents or very close to 1% variance.
Still, there is no guarantee that,
- BHP will reach this price cluster
- That BHP will stop IF it hits this cluster
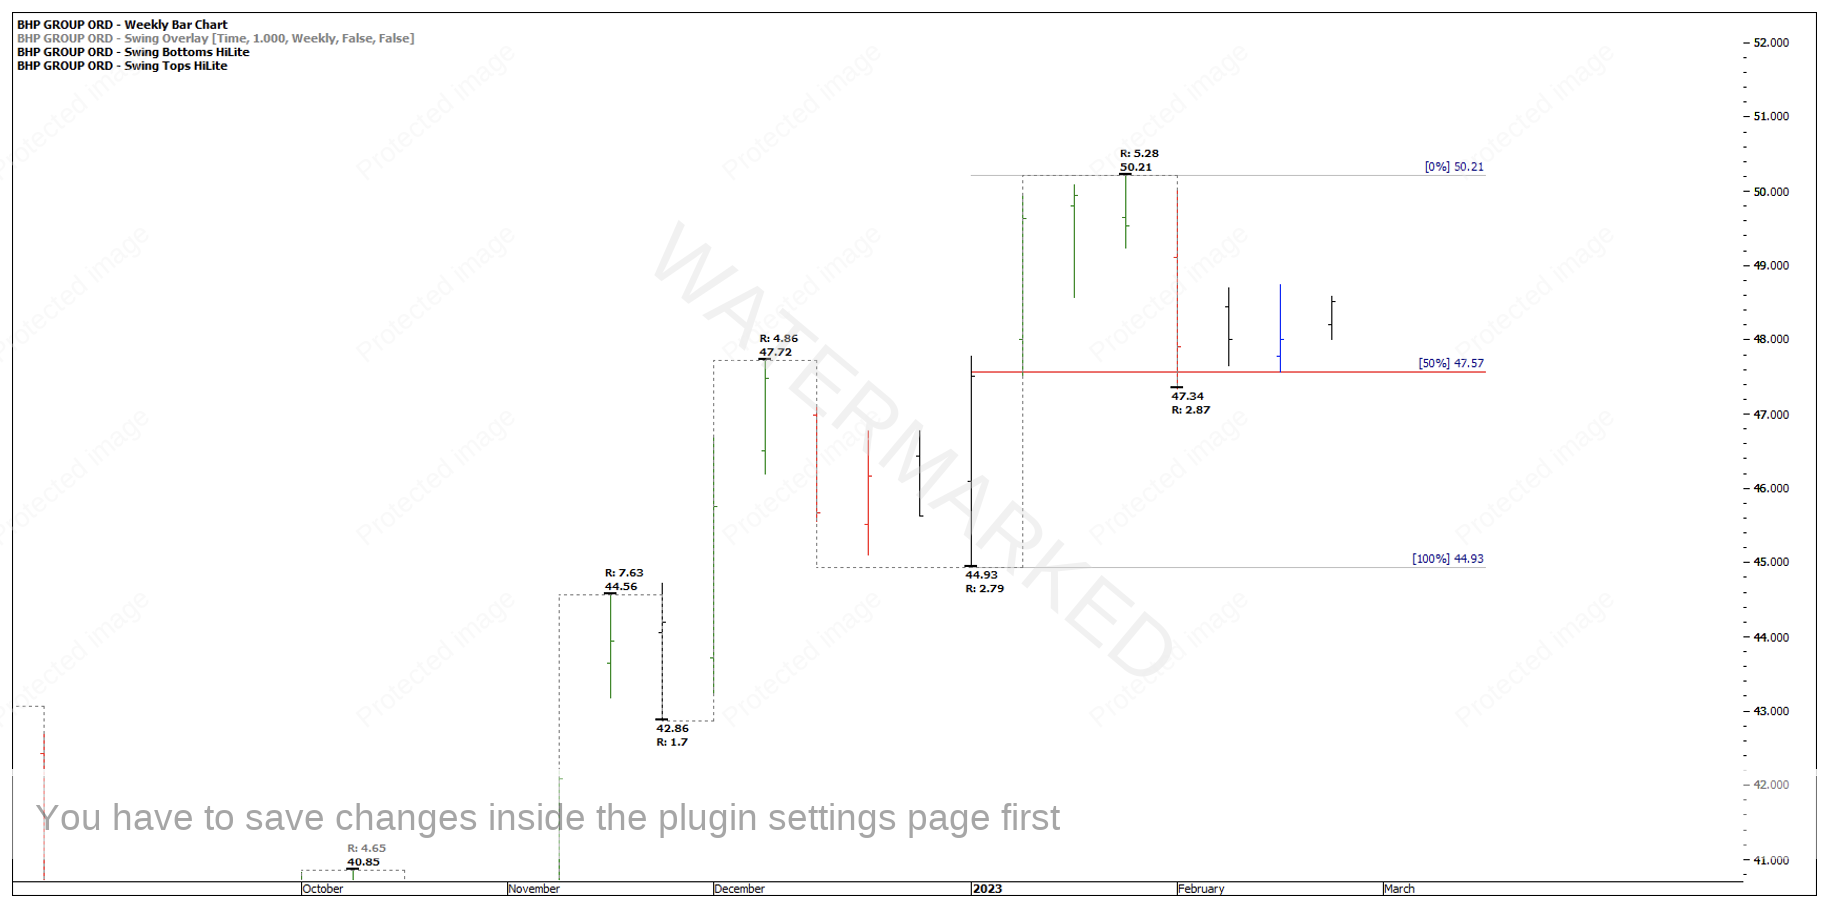
Currently BHP is finding support on the 50% retracement of the last weekly swing chart which is also sitting on an old weekly swing top.
Chart 8 – Weekly Swing Chart
If BHP continues to push higher, we can watch the daily swing within this weekly swing for signs of completion and look for more milestones to add further confirmation to this price cluster.
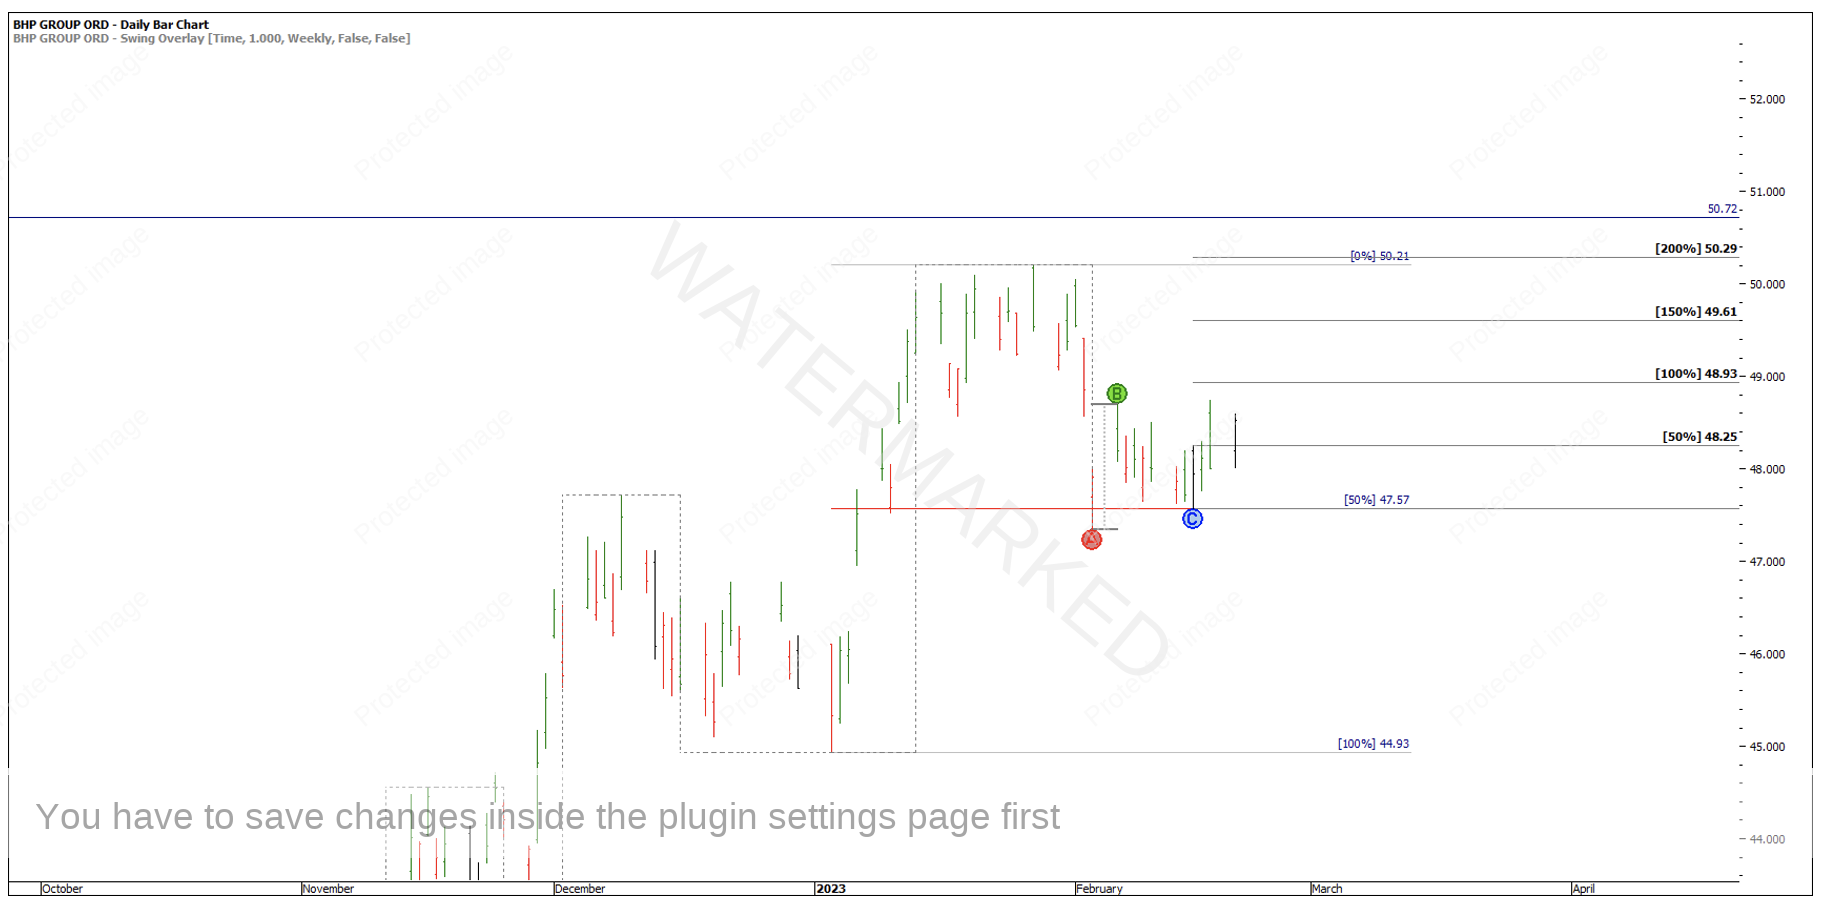
200% of what looks to be the daily FRO, gives a price target of $50.29 which at this stage falls a bit short of the highest part of the cluster is $50.72.
Chart 9 – Daily Swing Chart Milestones
One of the easiest things to do now is to put in a price alert into your charting software or trading platform. In this case I would like to be alerted if $50.00 is hit. I prefer to have alerts set on a trading platform which come up as a notification on my phone.
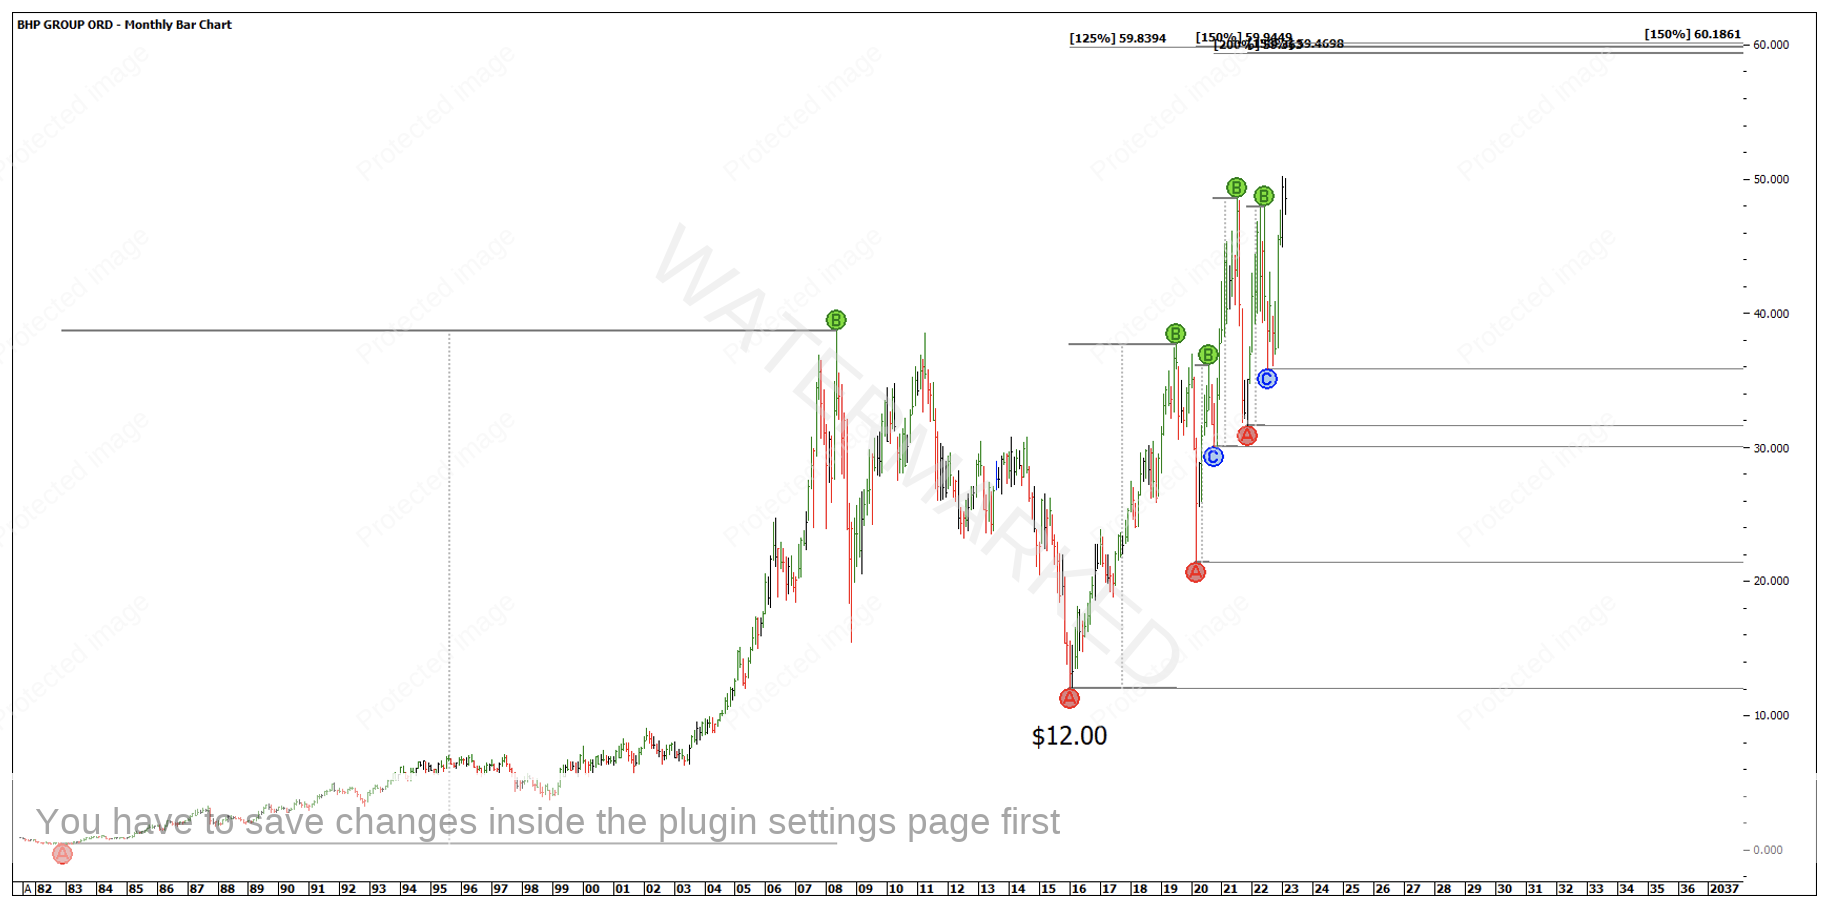
It’s always wise to have alternative clusters identified. What if BHP runs straight through the above cluster? Chart 10 below shows the potential for a big picture cluster around the $60 area. A nice round figure that would also be 5 multiples of the January 2016 low of $12.
Chart 10 – Alternative Price Cluster
BHP could tank overnight and not hit any of these levels, the main thing is if it all comes together and a trading opportunity presents, we can be prepared.
Happy Trading
Gus Hingeley
