Boeing Away
Welcome to this month’s newsletter, and it’s interesting to note that we’ve travelled halfway through the year in what seems the blink of an eye. It seems that there’s already been enough headlines, news and geopolitical discussion to fill several years, and we’re still attempting to process these challenges and get to the other side. Whilst this will occur in the fullness of time, markets are quick to react to change and are inpatient when it comes to the resolution of big picture issues. These challenges add extra complexity against the backdrop of economic uncertainty that is changing around the globe and in particular here in Australia with high inflation and high interest rates.
Boeing has continued to be a market that captures my attention, particularly as it has been trading in its price action around important levels of which we are all familiar. The 50% level is enough to make a fortune, according to Gann’s work. And we should pay attention when we see price action interacting in such a way that the 50% off multiple levels suggests a cluster in price. If we can deem a strong level, we can wait for confirmation on which side it falls to know our bias of long or short trades.
A quick refresher on Gann 50% rule, in essence its states the safest place to buy or the safest place to sell are levels just above or just below these major 50 % points. In Chart One we can reference the orange line that is created at the 50% level of the GFC low in 2009 and the all-time high in 2019.
This has proven and continues to prove that being biased to trades based on which side of this orange line has held us in good stead over the last 12 to 18 months. The recent setup than I am referencing is a good example of how the market has set itself up underneath this 50% line and positioned itself with a first lower swing top.
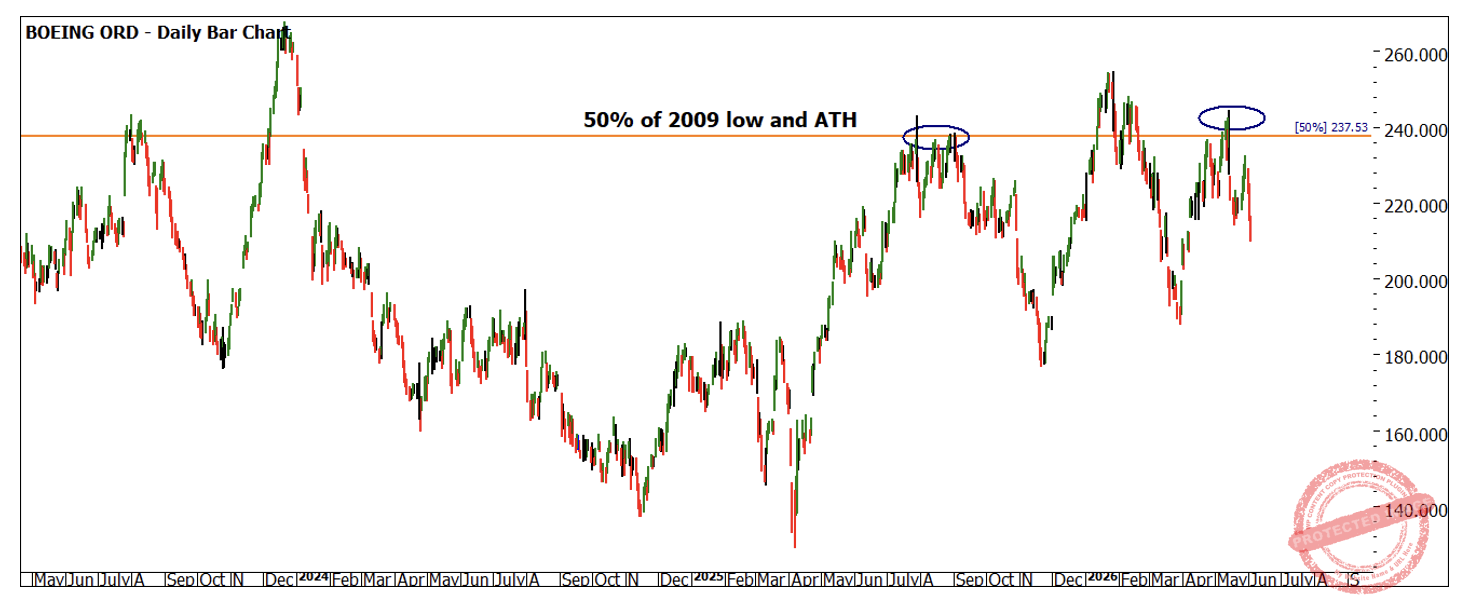
Chart 1 – Daily Bar Chart Boeing
Chart 2 looks at price-based action in a similar way, but in this case using the First Range Out as an extension rather than retracement to guide us on a 50% level. This First Range Out that I’m using is a little abstract given its position within the range I selected, however through testing we can gain confidence that this is an appropriate example to be using.
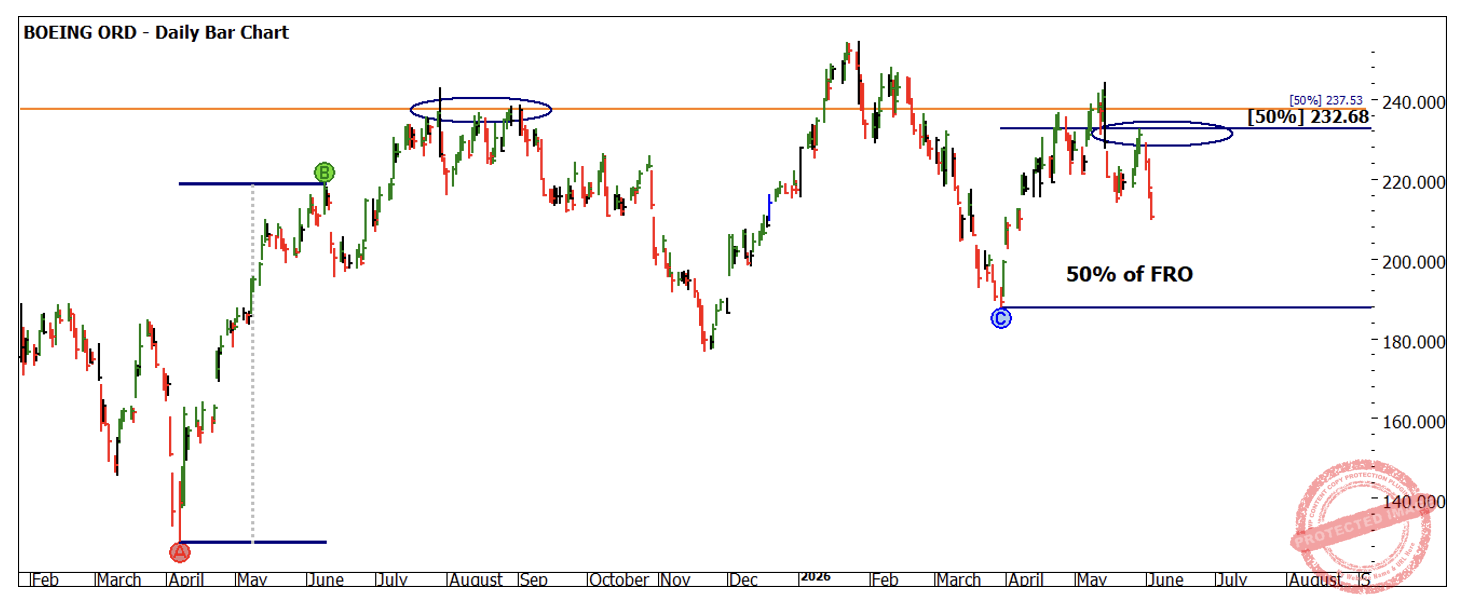
Chart 2 – Daily Bar Chart Boeing
Chart 3 below uses our first-dimension studies ie: price. This analysis uses a Highs Resistance Card from the all-time high. This gives us an understanding of where we sit in price relative to levels like 50%.
Setups where we find several different techniques off very large turning points that cluster and provide multiple 50% points can be powerful. It provides an exciting place to look on the smaller picture to combine the position of the market and an entry from your trading plan.
There are of course other elements that can be overlaid over the top, primarily the second and third dimension, which we’re currently working through in the Ultimate Gann Course Coaching for students, but keeping it at the level of Starter Pack and Number One Trading Plan studies, we should be comfortable to understand that this setup was something that could be researched and identified through the studies of price alone.
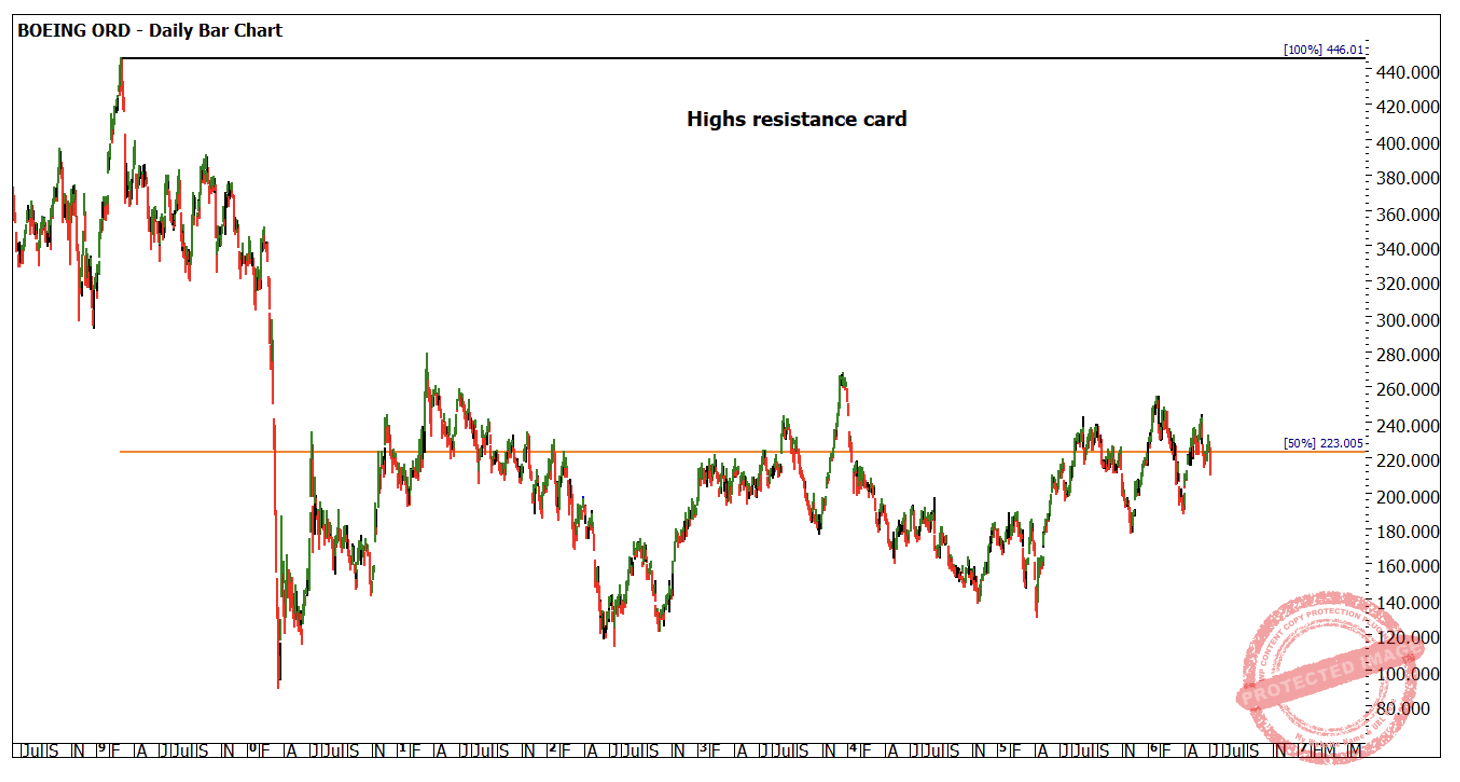
Chart 3 – Daily Bar Chart Boeing
This example would not be complete without applying another price-based tool in the form of a Low’s Resistance Card. Using the $89.00 low that has been a feature of many of the articles that I have produced on this market over the last 6 to 12 months, we said the price action has broken through the 175% level of the $89.00 low. I have noted on the chart in grey boxes, areas that we would need to see the price action comfortably close through to suggest an ongoing environment for a short trade.
The first of those gaps has been closed in this current move, but understand that there are future tests for the price action on Boeing to see whether or not this move is just short lived or something that could develop into a more significant move. Possibly our seasonal date in June.
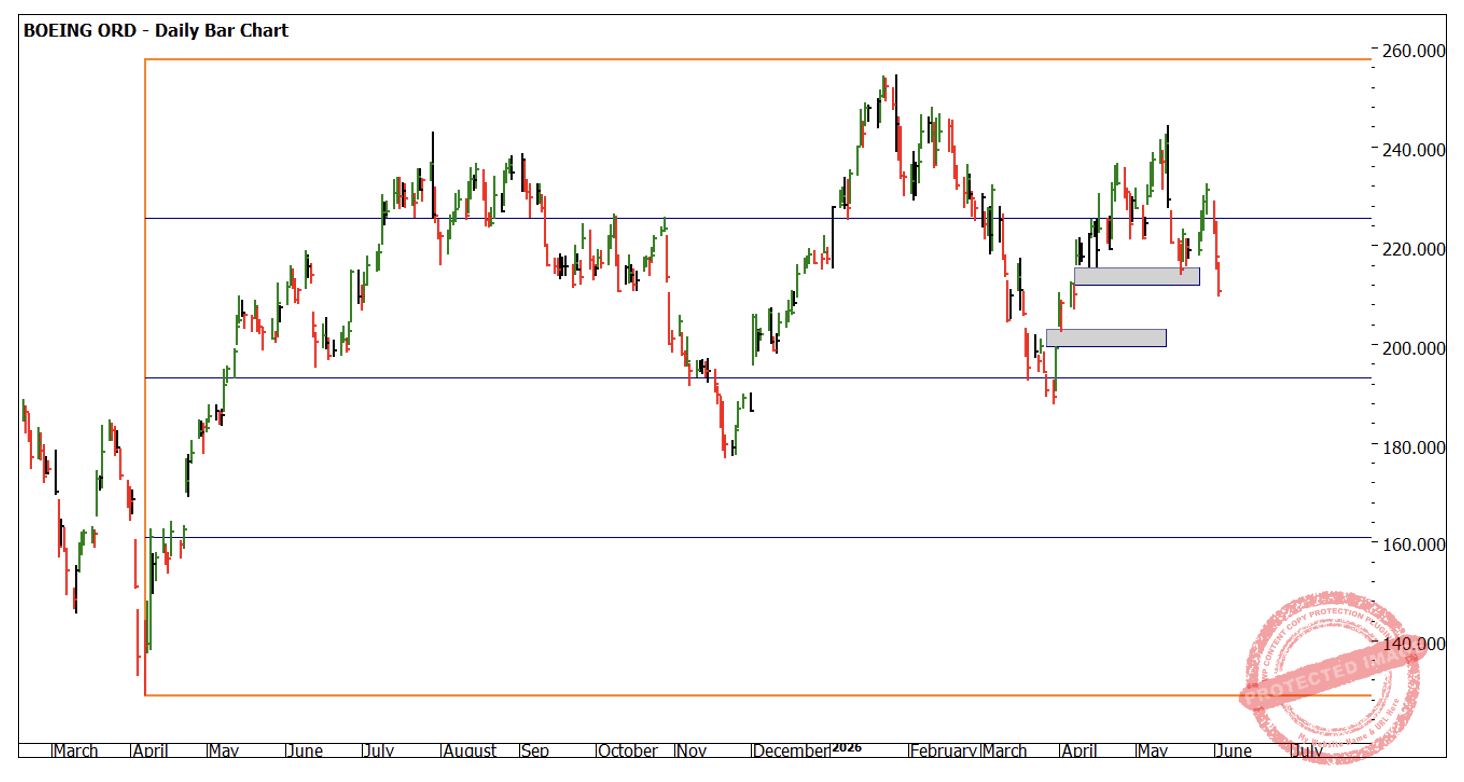
Chart 4 – Daily Bar Chart Boeing
With the last of our end of day charts, you’ll see the ABC broader formation that I am referring to that aligns strongly in terms of multiples of 50%. The date of entry in this case is 1st of June 2026.
The price action gapped down from the previous sessions open and found itself sitting underneath the 50% on the smaller picture. This again aligned with the broader view that potentially we were in a better place to be shorting the market than attempting to be long as we saw from B to C.
Another subtle point to note within this ABC pattern is the basic use of time. In its simplest form, the A to B range was 5 calendar days and the B to C range was 10 calendar days. If we examine the price action with the overlay of time, we can see that the movement from B to C in price was only 50% of the A to B swing but took 200% of the time from A to B to go half the distance.
These are the types of scenarios and setups that, if you can combine on the big picture, really do allow you to get a close entry to the market and to find yourself in a move as it’s starting to develop.
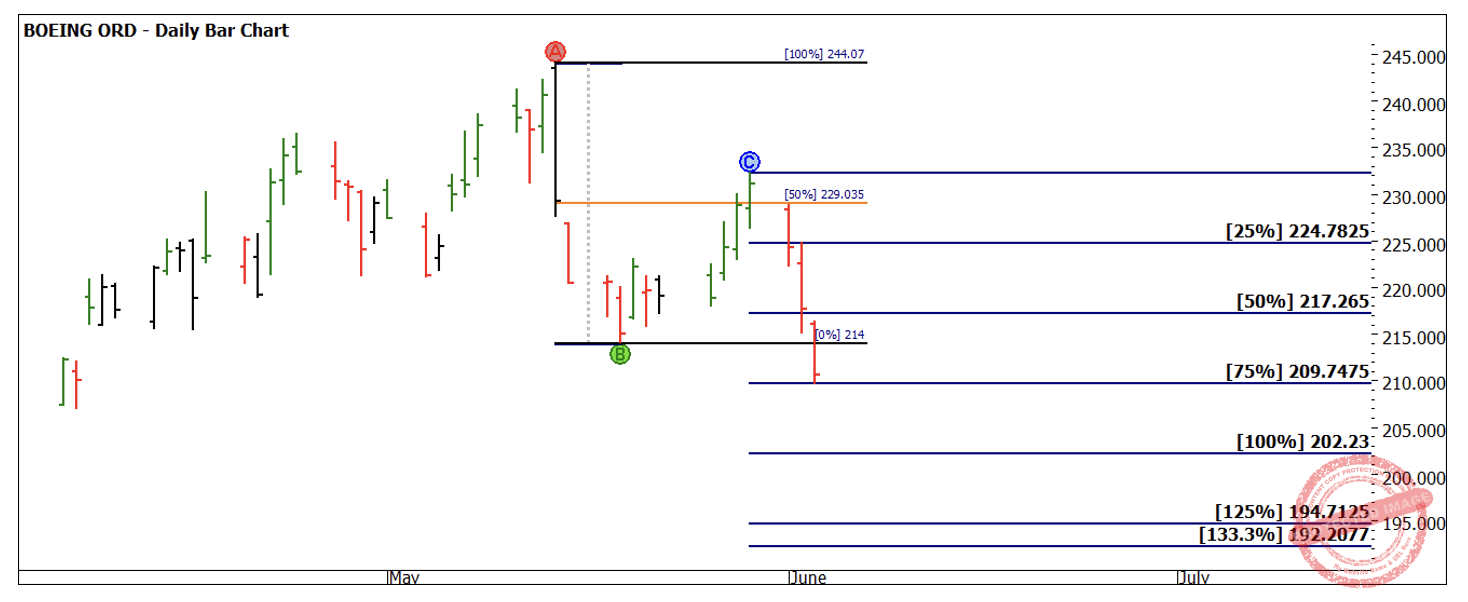
Chart 5 – Daily Bar Chart Boeing
In Chart 6, the final chart, you can see an intraday or a four-hour bar chart perspective. That shows the gap down on the open. This is a textbook setup for the use of an Openers Rule. In this case, you can see using a stop either behind the gap or a third of the average daily range behind the open allowed you to enter the market with a relatively low risk, which in turn has been rewarded as the markets continue to move away over the next three trading sessions.
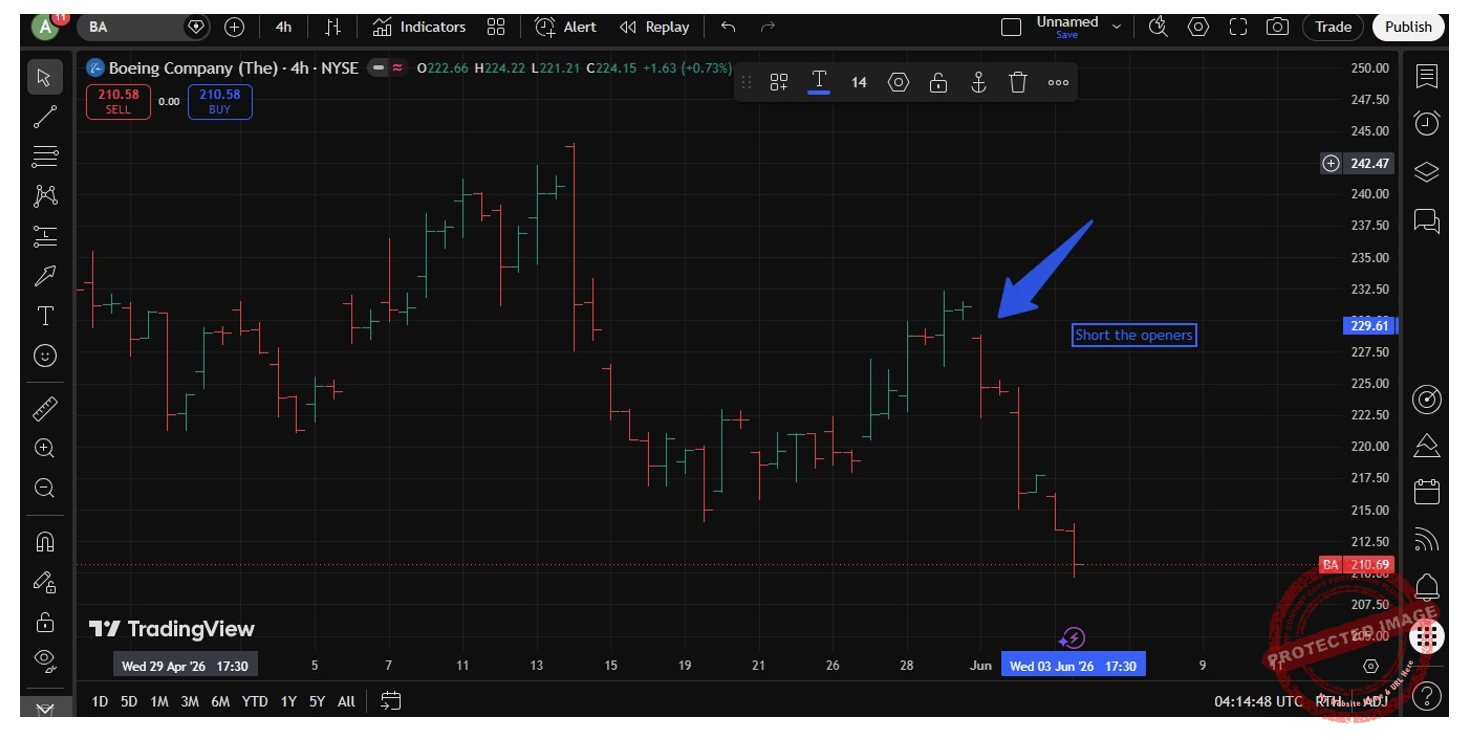
Chart 6 – 4-Hour Bar Chart Boeing
The main point that I hope you can digest from this is that in many cases using first dimension (price) work to identify areas of support and resistance and then waiting for signals on the right side of those levels, develops good habits for executing our trading plan when these setups occur.
We can obviously keep things as simple or more complicated based upon all the tools within our toolbox. If you step back and read the growing number of articles that I have put together on Boeing, you’ll see in many cases it’s a simple case of taking the little things or the simple things and executing well.
Good trading
Aaron Lynch