Bringing It All Together
This month it’s back to the usual format of discussing price clusters but this time with a stock. After all, Gann was more than just a commodities trader! This article focuses on a recent example where by three elements of price forecasting were brought together to form a price cluster, giving the Safety in the Market trader reason to anticipate a turn in the market, and then profit from that by way of a 14 to 1 Reward to Risk Ratio in a relatively short period of time.
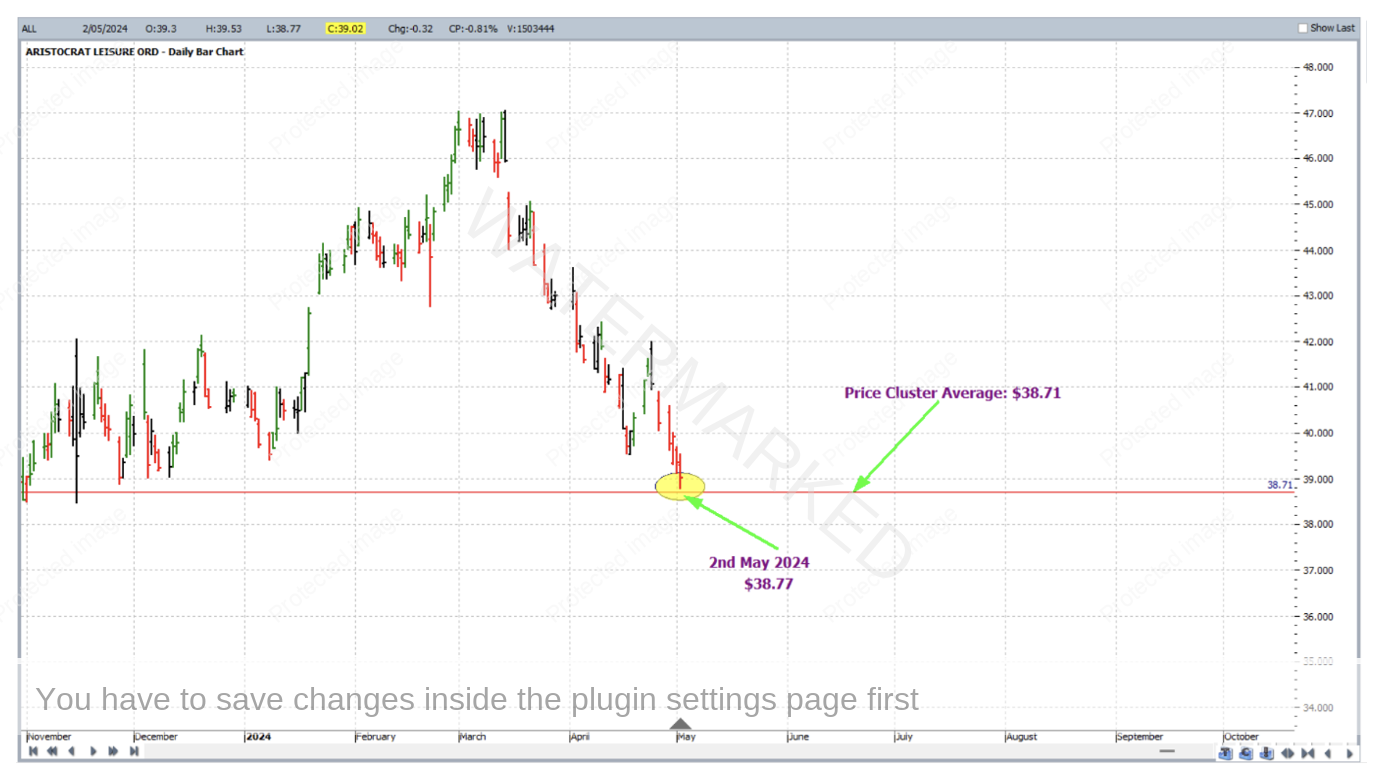
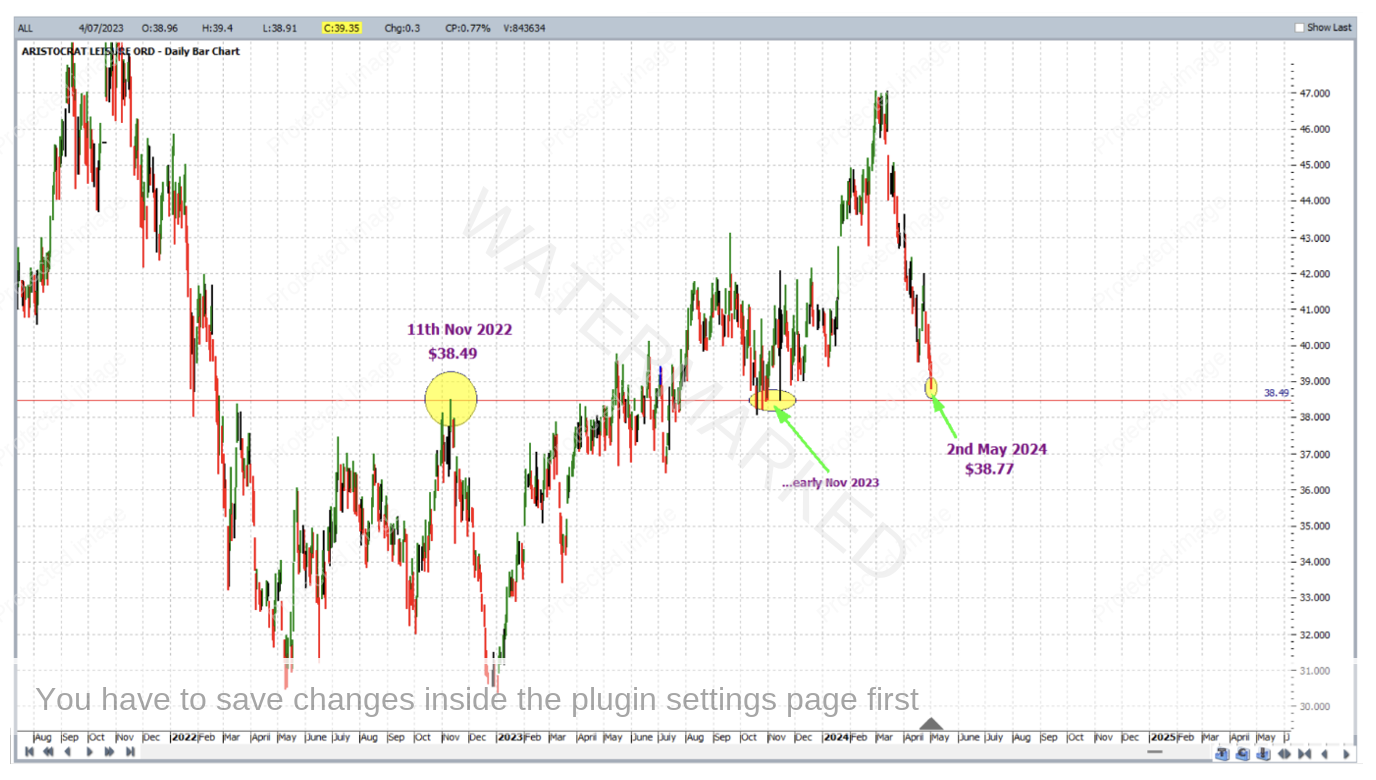
The stock in question is Australian top 50 constituent Aristocrat Leisure Limited (ALL:ASX). By early May of 2024, this market had lowed at $38.77 and this was within 6 points of a price cluster, the three inputs of which averaged at $38.71. Six points is a fairly small error in relation to the average size of a daily bar in this market. This is shown below in the ProfitSource daily bar chart of the said market, in ProfitSource’s Walk Thru Mode.
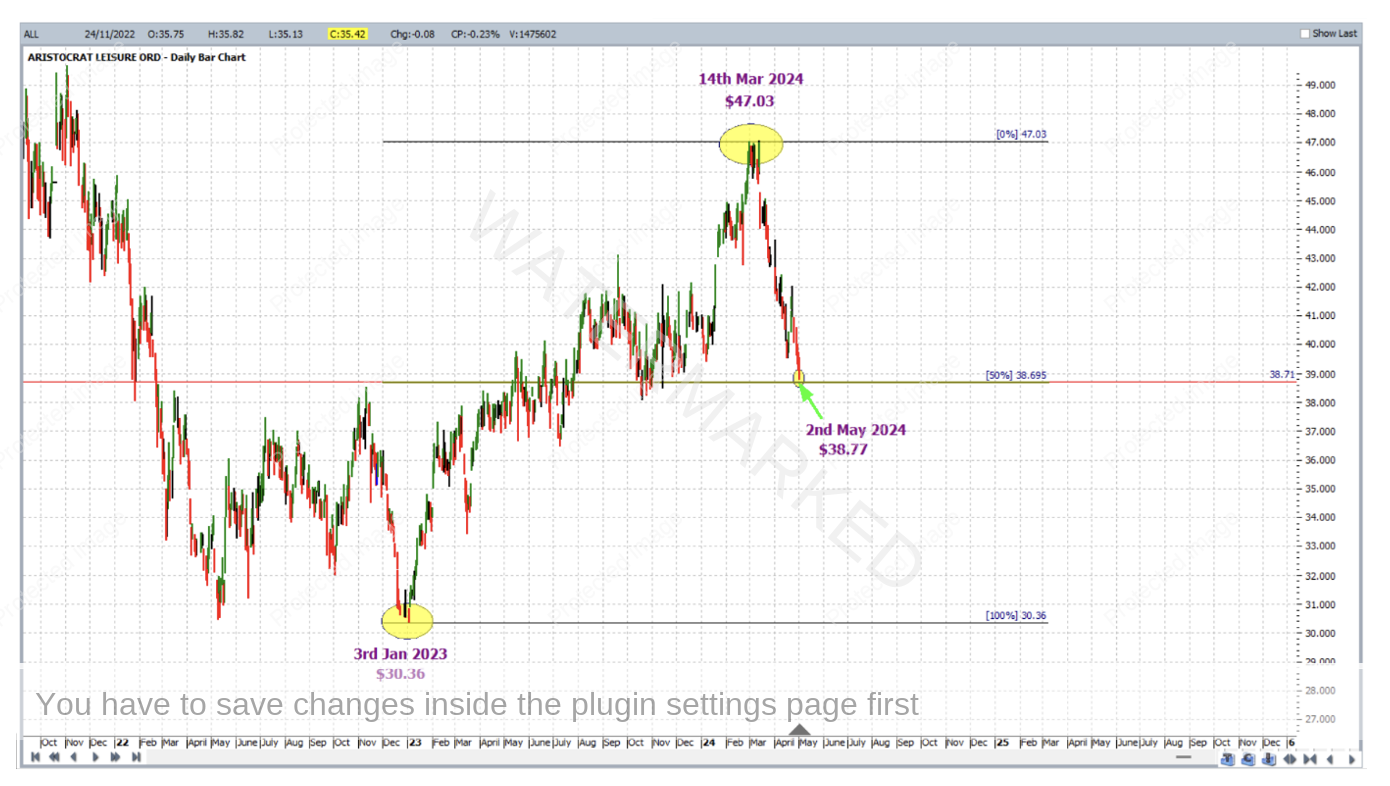
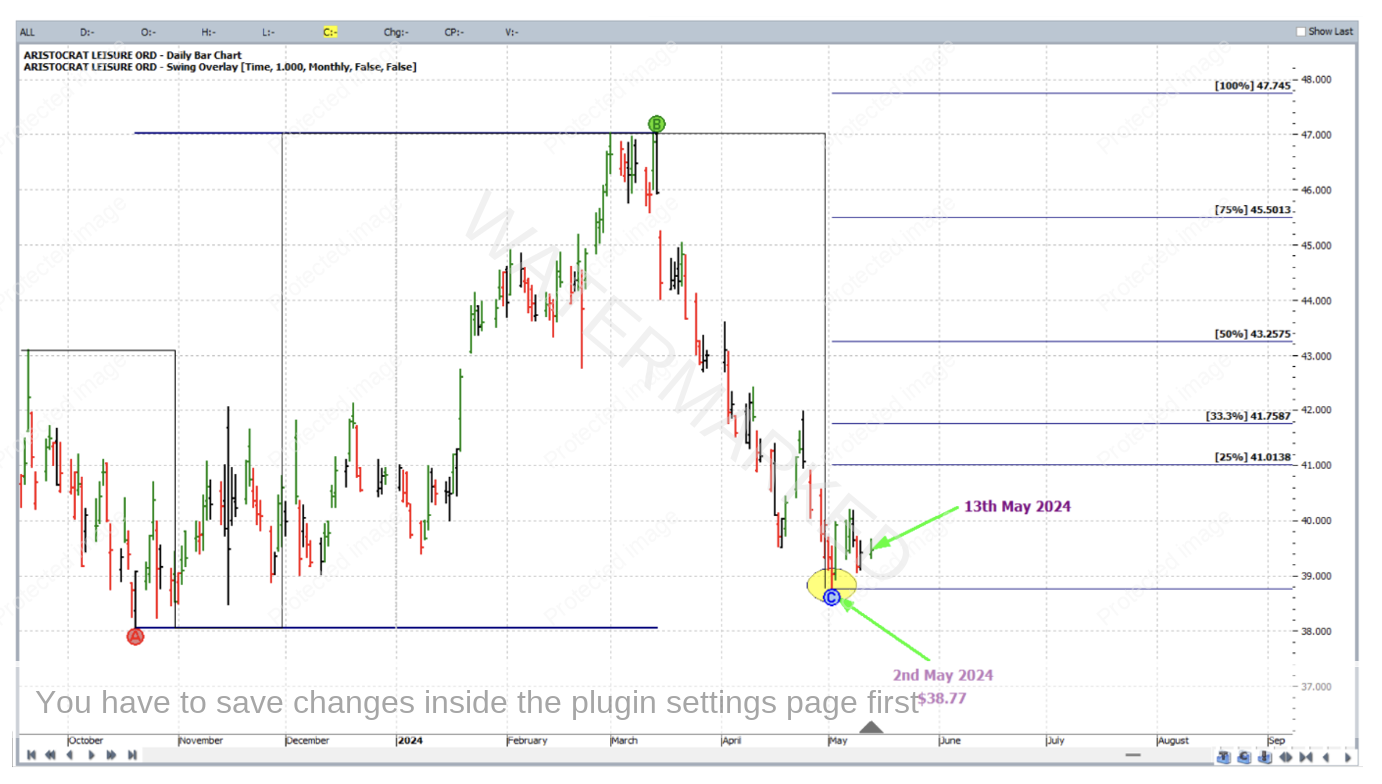
Before we get into the trade entry and execution, what were the three inputs to the price cluster that were brought together? First of all, the simplest and the strongest (hence a good leading indicator for a price cluster) was the 50% retracement on a Ranges Resistance Card applied to recent and significant turning points in the market. This resistance card was run from the 3 January 2023 low ($30.36) to the 14 March 2024 high ($47.03) and the resulting 50% resistance level came in at $38.70 rounded to the nearest point (1 cent or $0.01). This is shown below.
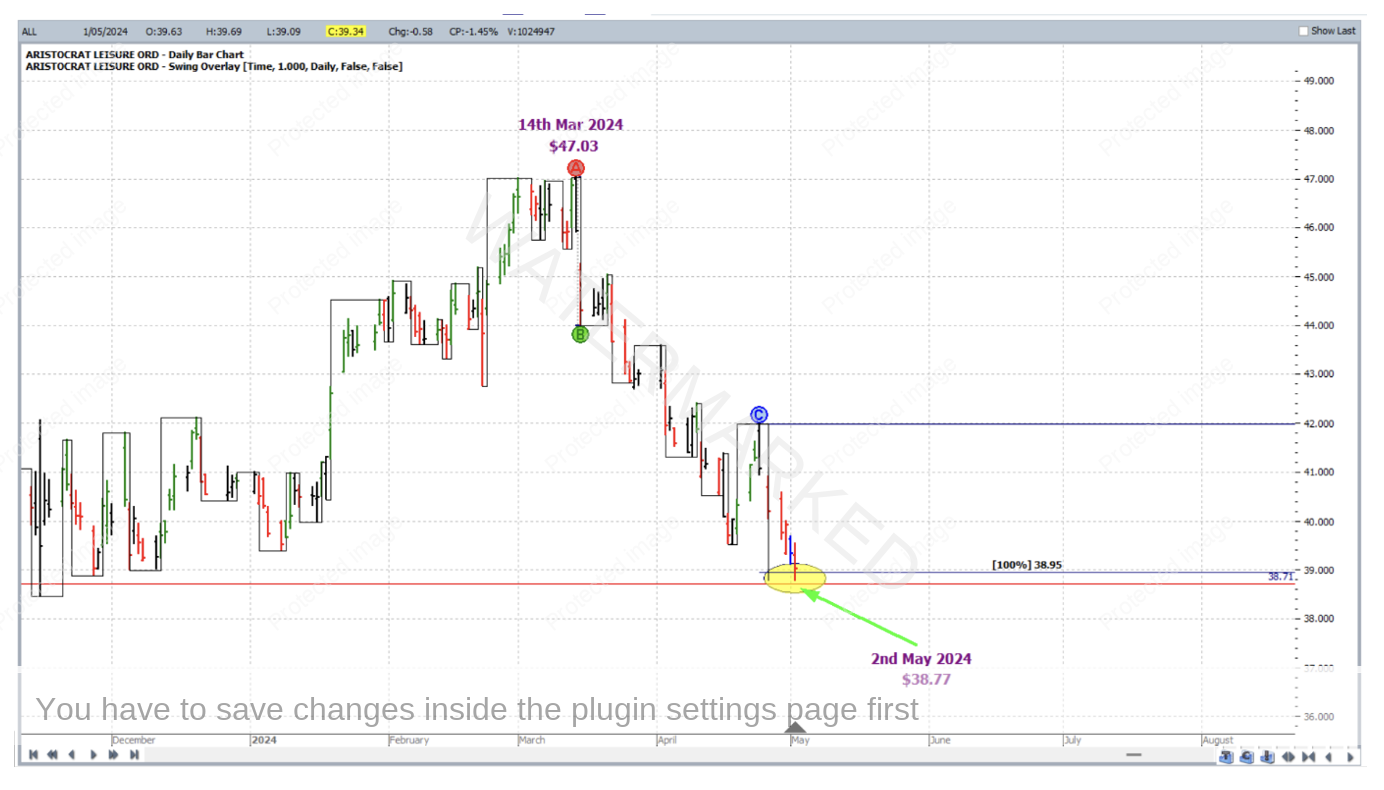
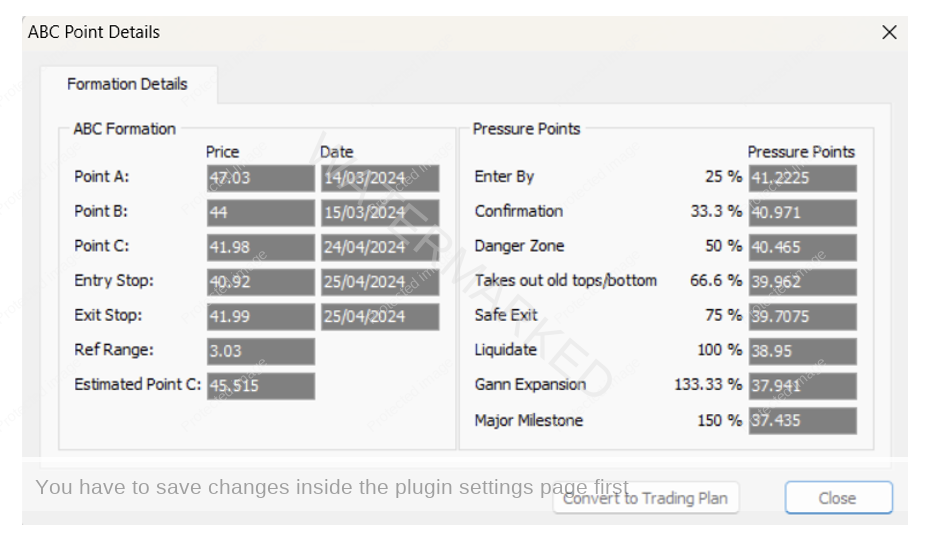
Next was an application of the repeating range, or ABC if you like, but done in the context of a First Range Out (FRO). The FRO itself was the first daily swing out of the 14 March 2024 high, with Point C then placed much further away on the most recent daily swing high before the potential 2 May 2024 low. The 100% milestone of $38.95 was the next input to our price cluster and this is shown below along with a screenshot of the FRO application’s Details box.
The third and final piece of price analysis for our stock was a bit simpler! Both David and Gann said that old highs become new lows. That said we note that the isolated 11 November 2022 high of $38.49 became a potential support level. This is shown below and we may also note that in early November of 2023 there were also a few minor lows very close to this level.
With enough reason to trade, we now look for an entry signal. This came by way of a first higher swing bottom, confirmed on 13 May 2024 long ALL $39.63 with initial exit stop at $39.03; reference range used was the last monthly upswing, with the trade to be managed as though in a large ABC.
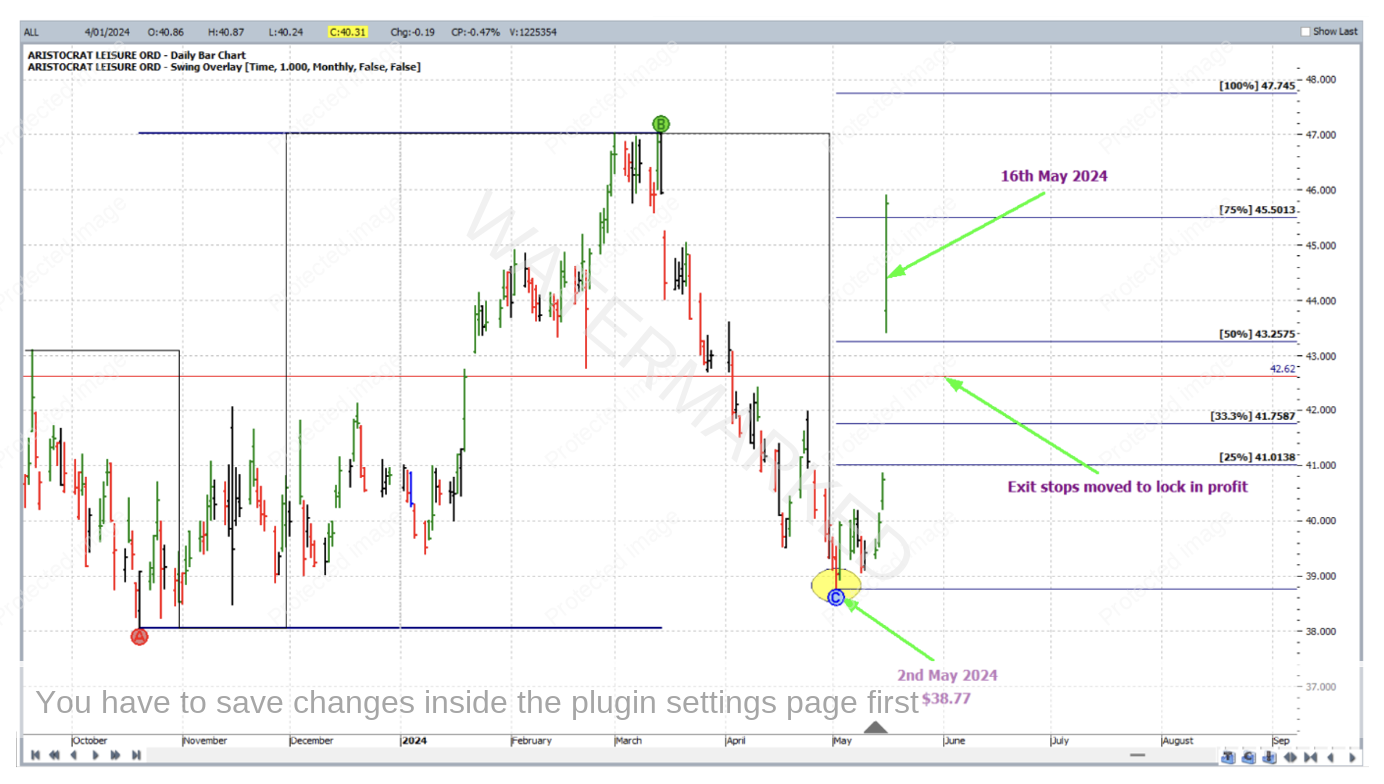
On 16 May 2024 with a very strong gap up/up day, the market broke the 50% milestone, then the 75% milestone, so within one day, stops were moved to break even, and then to lock in profit at 1/3 of the average weekly range below the 50% milestone. This was roughly 63 points (based on the last 60 weekly bars).
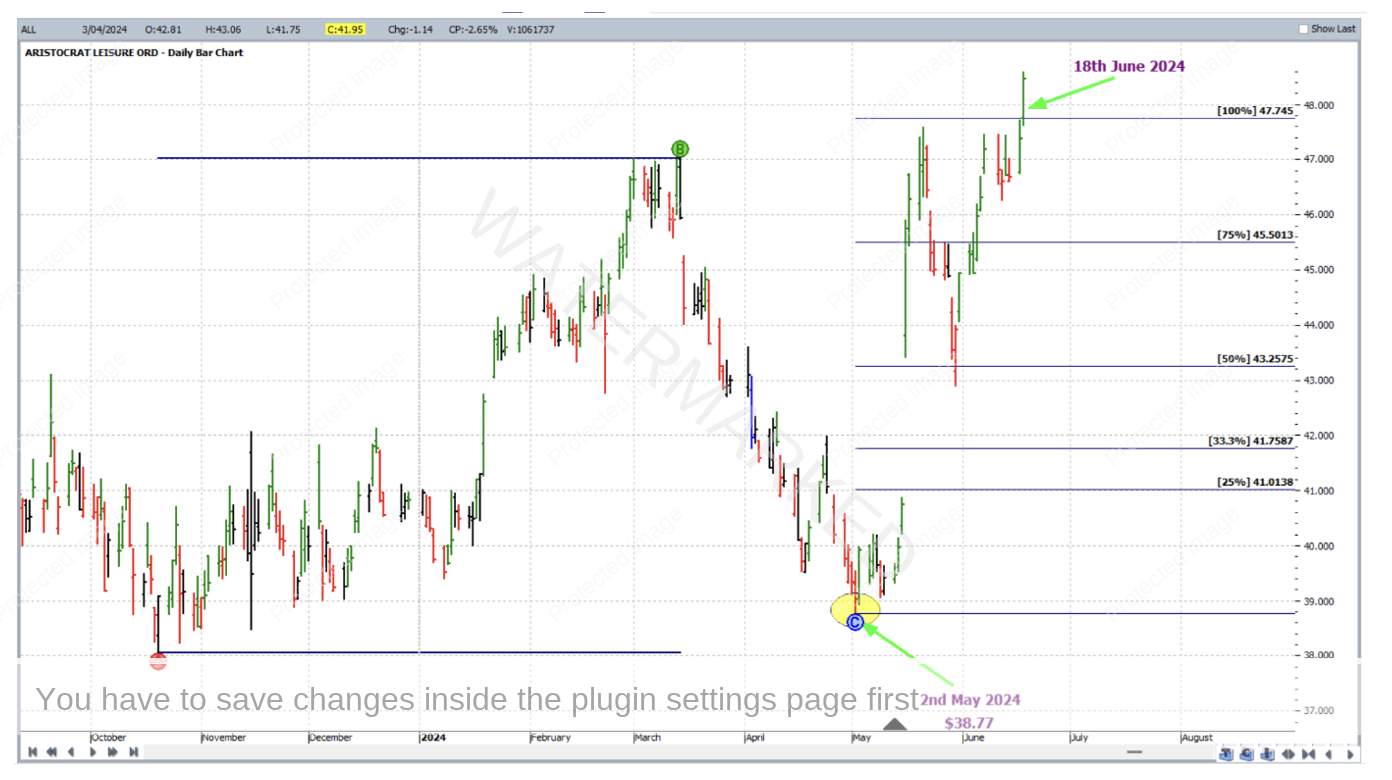
Then on 18 June 2024 the market reached the 100% milestone and the trade was closed at $47.74.
Now for a breakdown of the rewards:
Initial Risk: 39.63 – 39.03 = $0.60 = 60 points (point size is 0.01)
Reward: 47.74 – 39.63 = 8.11 = 811 points
Reward to Risk Ratio = 811/60 = approximately 14 to 1
If 5% of the account size was risked at entry, the growth in account size from this trade alone would be as follows:
14 x 5% = 70%
That’s a 70% increase to the size of a financial asset (the trading account) within two months.
With 5% of a $10,000 account risked at entry, the reward in Australian Dollars would be:
14 x $500 = $7,000
Obviously it’s too late to actually profit from this particular case study as the horse has already bolted, so how can this hindsight be of any use? Practice reproducing the charts of a case study like this, then, as David always said, hindsight becomes foresight.
Work hard, Work smart.
Andrew Baraniak