Burn the Midnight Oil
It’s that time of year again when the last articles are published, and we say goodbye to 2022 and prepare for 2023. Diligent time spent reviewing 2022 and planning out 2023 is a major part of December for me. It means I’m on the front foot and working out what areas I want to grow and pursue in the following year.
Part of having next year’s setup is identifying the big trading opportunities well in advance and tracking them as they unfold. If you have a Classic Gann Setup in your sights, then you also have the ability to stalk a trade in the direction of the trend and then potentially trade out of it.
As Ultimate Gann Course students, we have the wonderful technique called ‘Position of the Market’ at our disposal. Combining the lessons of the Active Trader Program with Sections of the market is a powerful combination. Markets don’t always follow 3-4 Sections but it’s a great structure to work with, when sections are indeed working!
Let’s take Crude Oil for example and the big picture quarterly swing chart. After a very strong run out of the 2020 low, the quarterly swing chart has turned down.
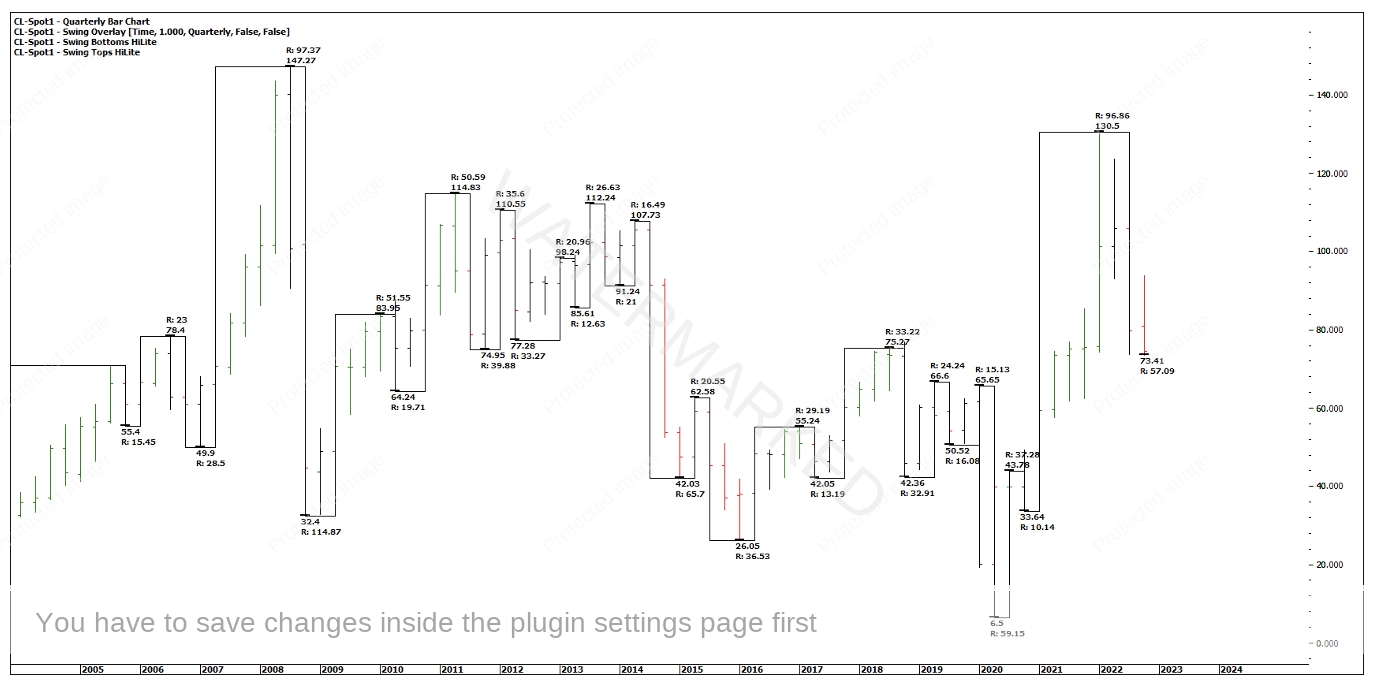
Chart 1 – Quarterly Swing Chart
If sections are working, we could reasonably expect to see 3-4 monthly sections within this quarterly range. Looking at 2022, with the monthly turning points on, there was a big First Range Out from 7 March into 11 April, followed by a second section down from 14 June into 26 September. This monthly swing was made up of 3 weekly swings.
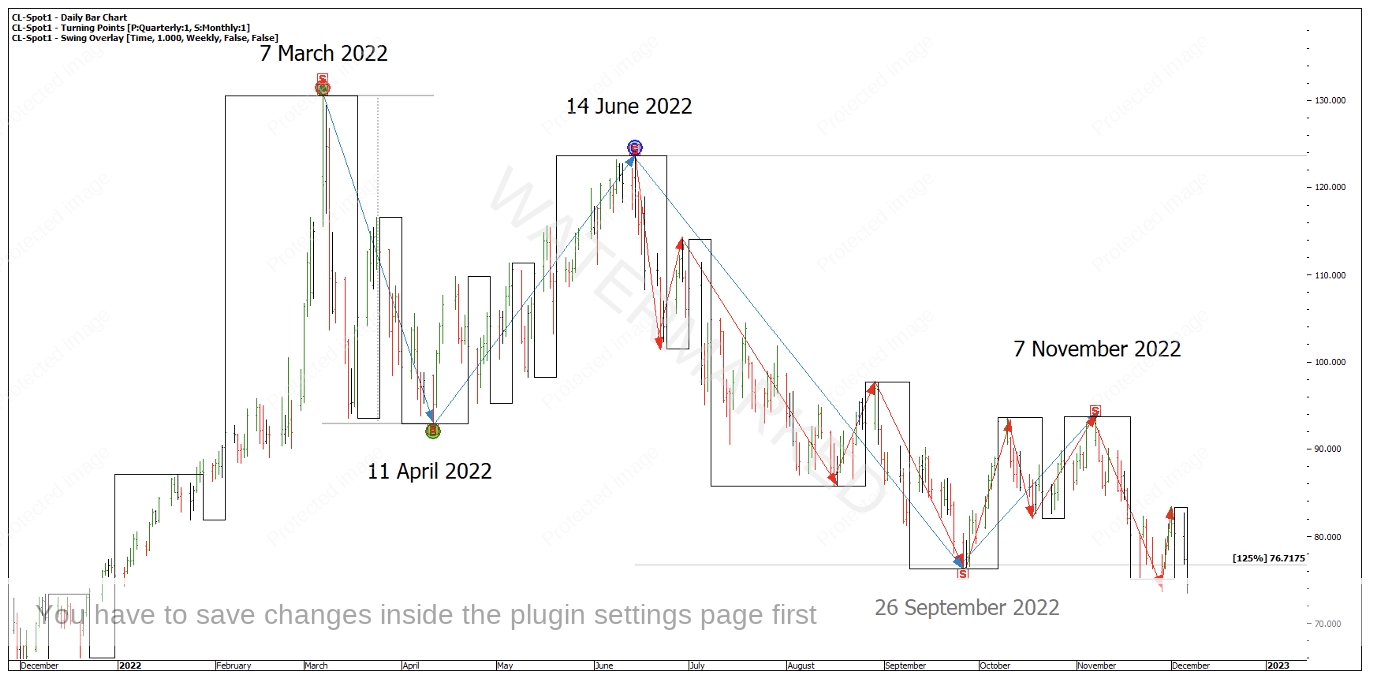
Chart 2 – Sections of The Market
I think it’s fair enough to say that the sections seem to be working. On a simplified view, the monthly swing overlay shows Oil to be in a 3rd monthly section down.
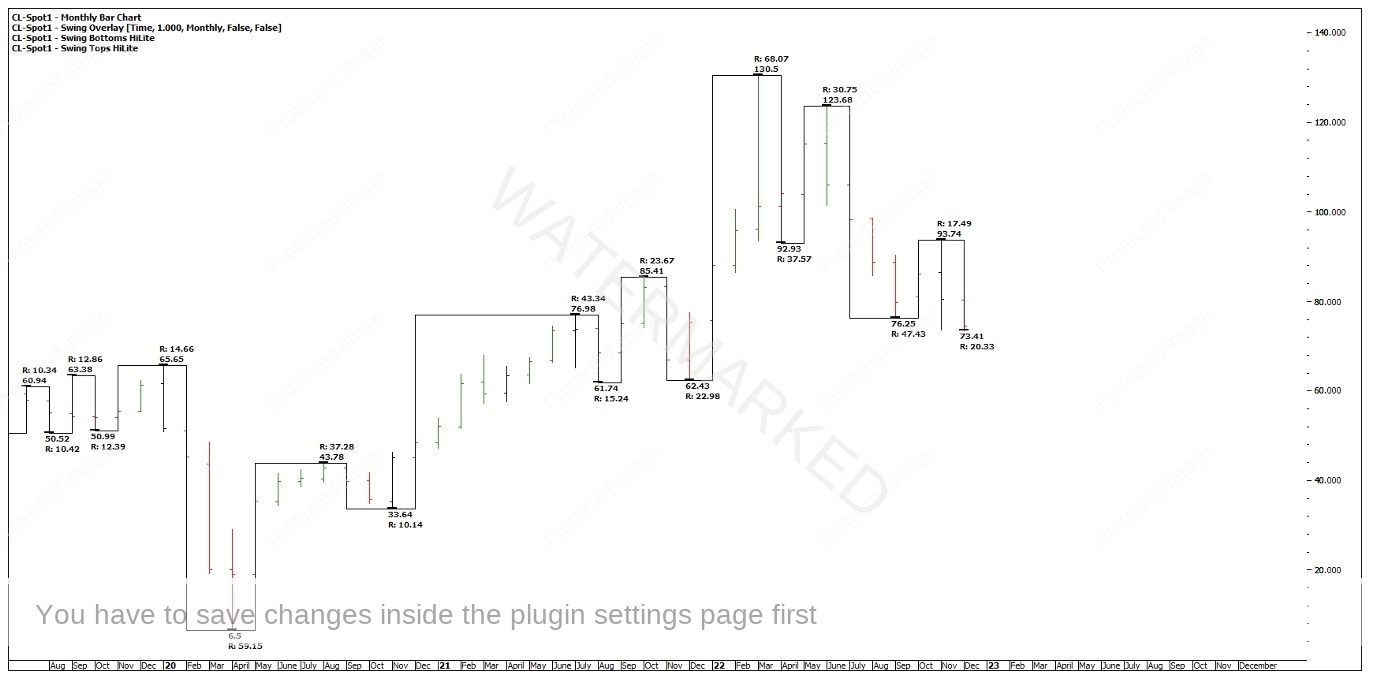
Chart 3 – Monthly Swing Chart
Now that I have an idea of the bigger picture on Oil, I can start looking for support and resistance. Starting with the All Time Ranges Resistance Card, $76.88 could be an important support or resistance level going forward, especially if daily or weekly swings are made on or below this level.
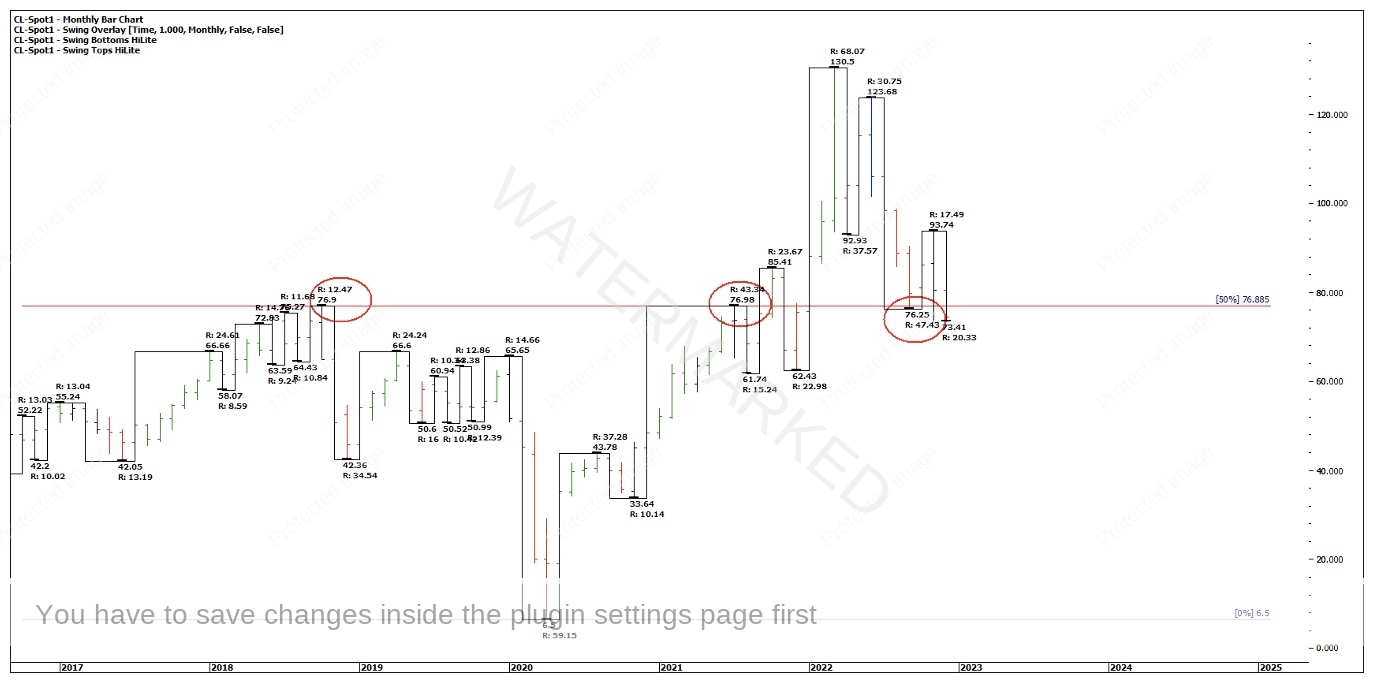
Chart 4 – All Time Ranges Resistance Card
Next, we have the recent major Ranges Resistance Card.
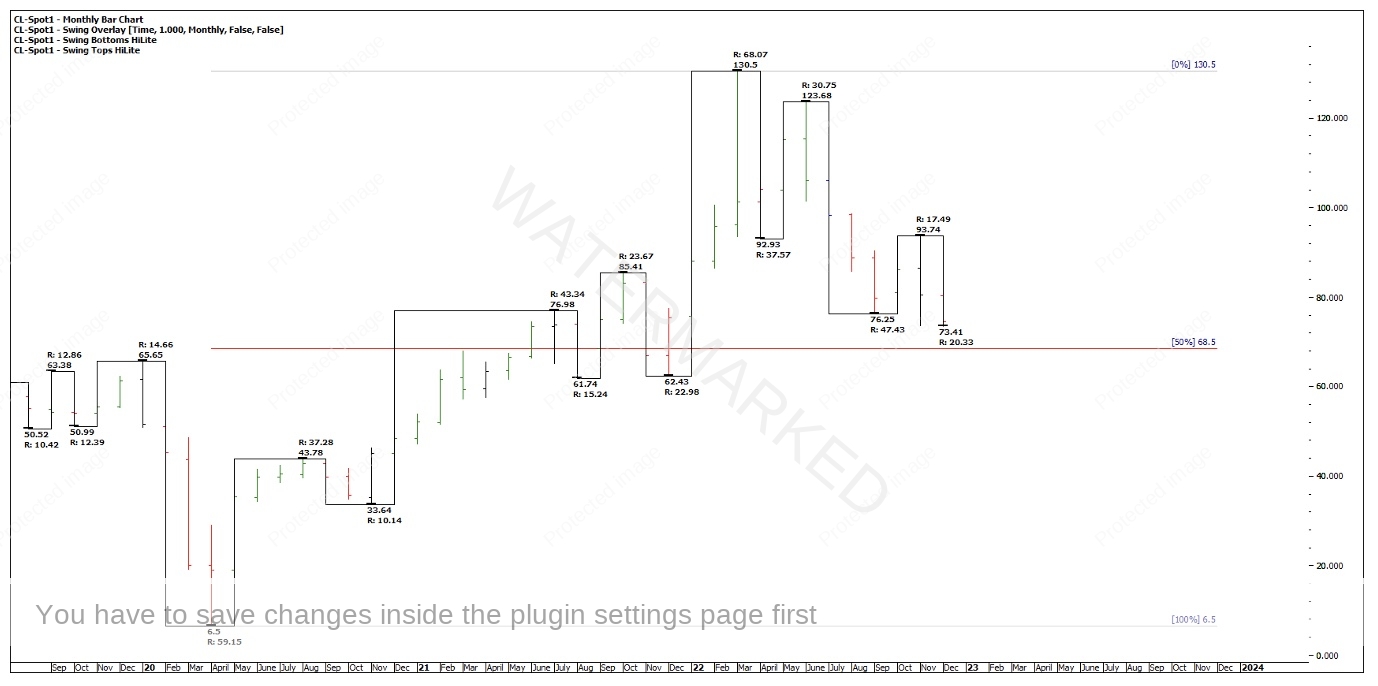
Chart 5 – Major Ranges Resistance Card
We can now start layering on the monthly First Range Out (FRO) milestones. Interestingly the 150% and 200% also line up with resistance card levels.
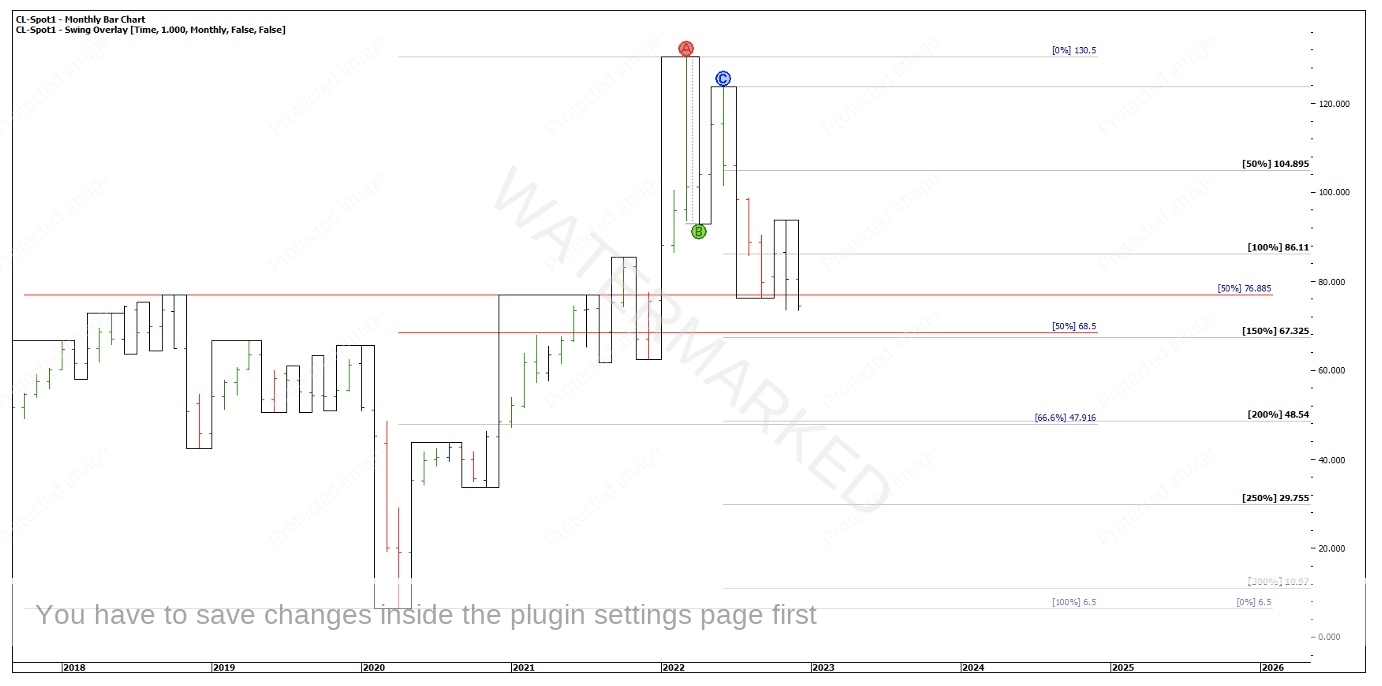
Chart 6 – First Range Out Milestones
And now the monthly swing range milestones.

Chart 7 – Current Swing Range Milestones
Dropping down to the weekly swing chart, we can run our FRO milestones. None of these really cluster with any other price pressure points so perhaps this is an indication we need to be watching for more sections to unfold.

Chart 8 – Weekly First Range Out Milestones
We can also run speed angles off a previous section.

Chart 9 – Speed Angles
We can also have our Time by Degrees and some basic Time Trend Analysis.

Chart 10 – Time Trend Analysis
This chart has as much on it as I can handle but it does a great job of showing us the higher probability areas of support and resistance.
The market may not turn at one of these levels, but the important thing is, if it does, you’ll be ready!
Markets have all sorts of ways of throwing you curve balls. On top of that, we need to keep check of our emotions at the same time.
I’ll leave you with one last chart of the SPI and a recent setup that provides a price cluster 11 points apart. If you’re really keen you might also like to have a look at the 4=hour FRO of the last daily swing and see the relationship it had with the final 4-hour swing into the top. Hint, 3 points.

Chart 11 – SPI Cluster
Again, if this is a weekly B-C retracement we could reasonably expect to see daily sections within it. Although, what if this is a new A-B move? And we should always be on guard for a sideways choppy market!
Wishing you and your family and friends all the best for the Christmas and New Year, and I’m excited as to what 2023 has in store for us all!
Happy trading,
Gus Hingeley