But I Missed the Top – Part 2
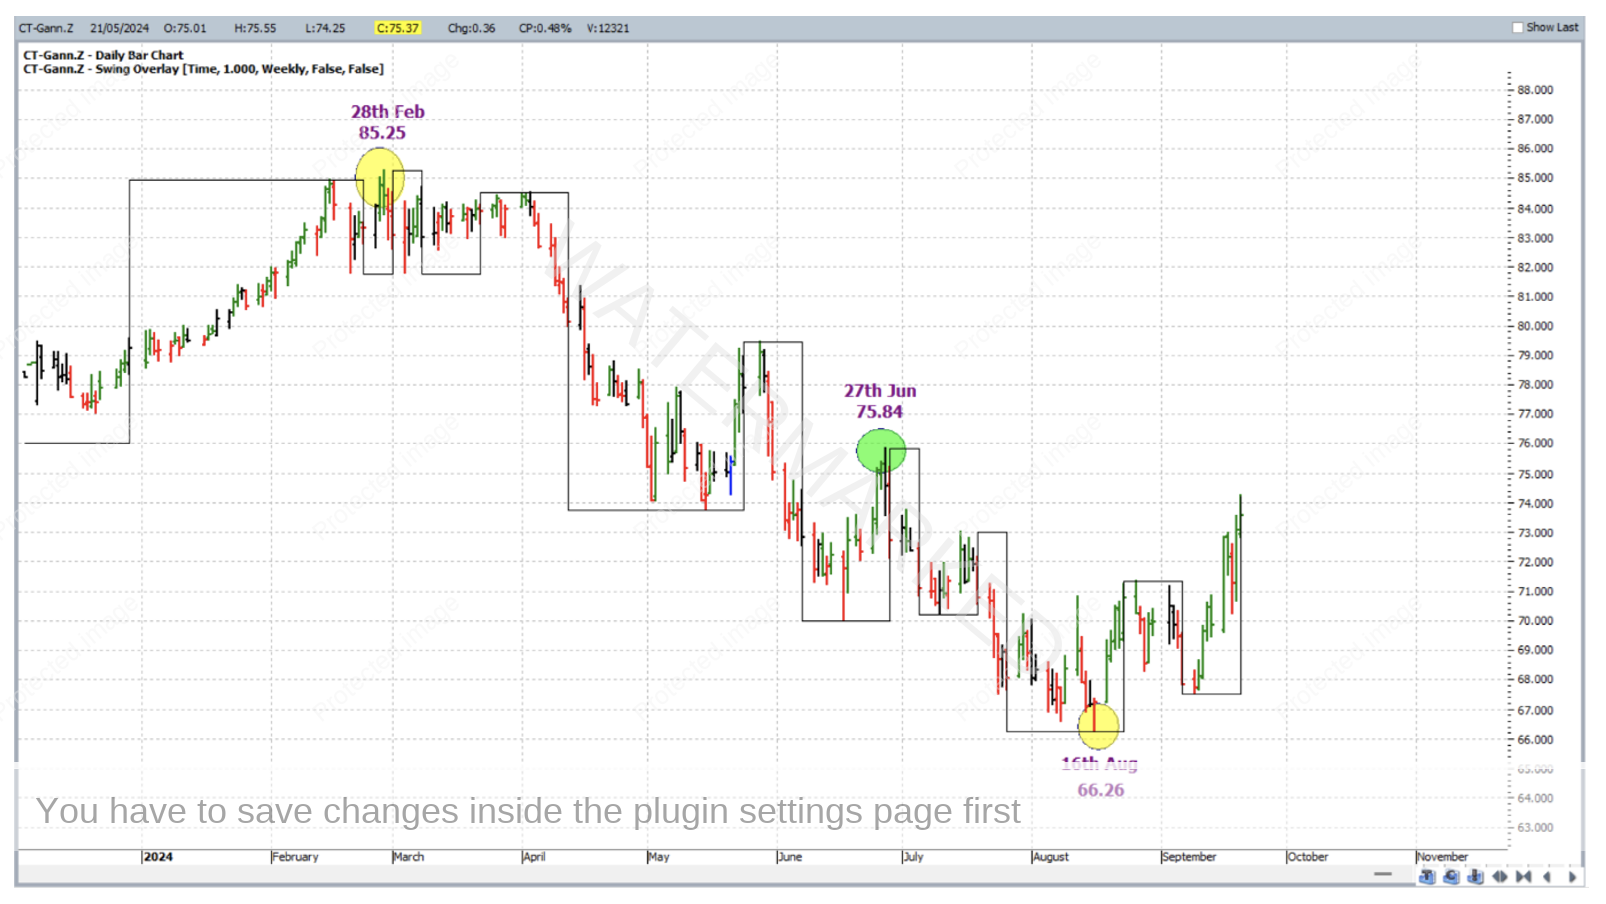
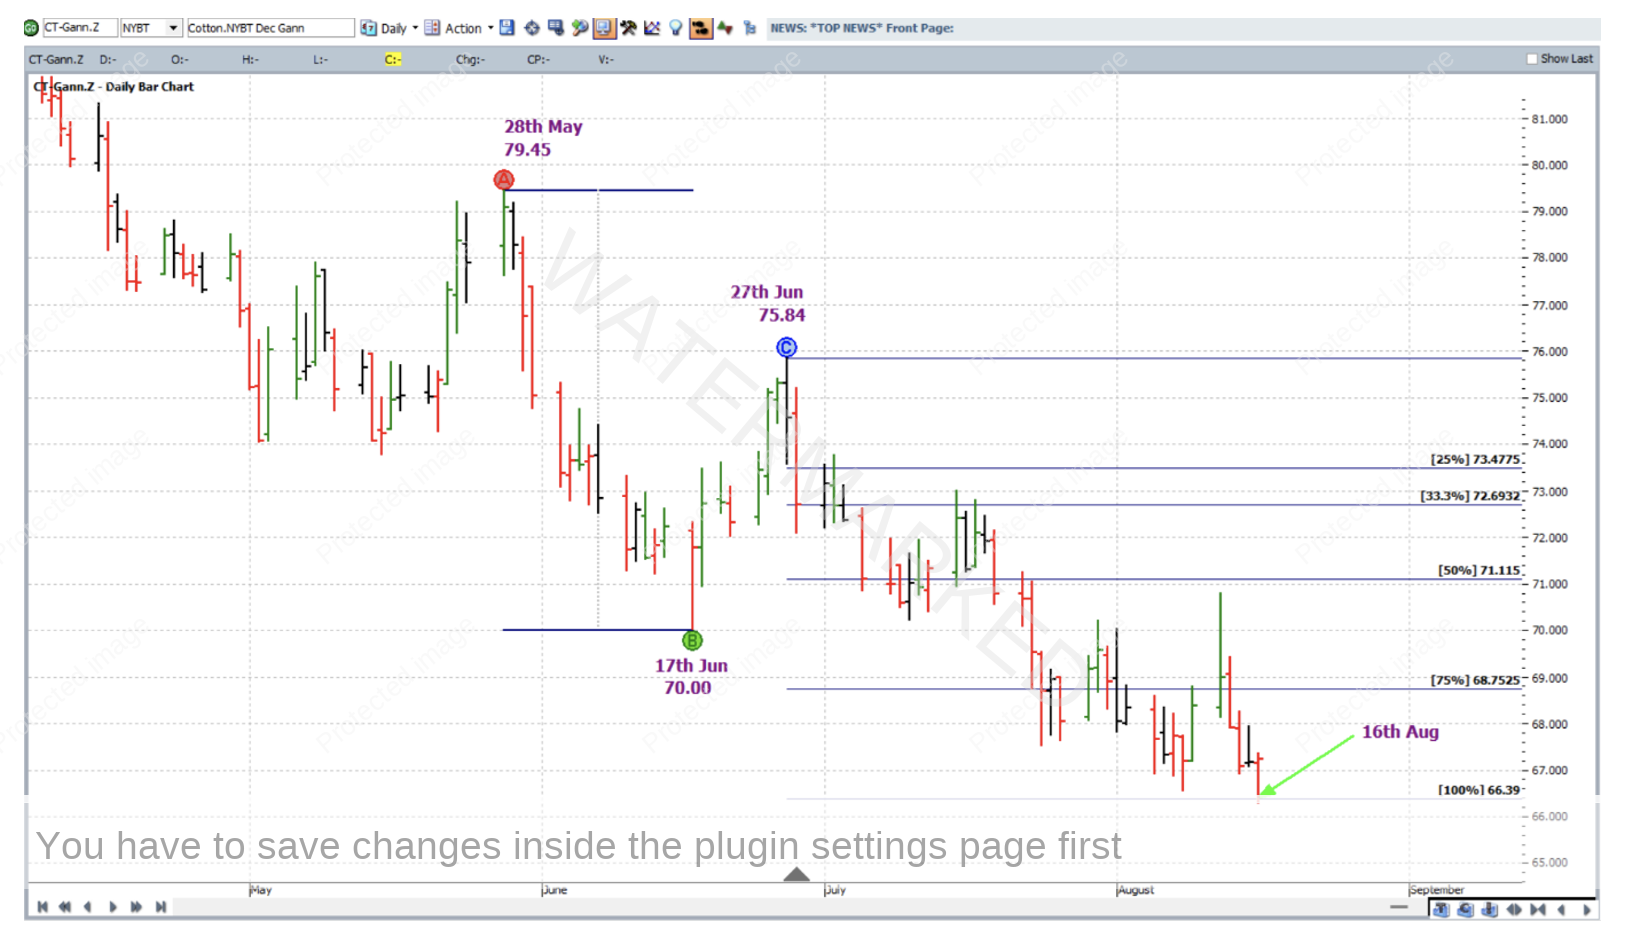
If you’re saying that, it’s not too late! Last month’s article was a reminder that if you missed getting on board at a major turn, there can still be good opportunities to trade a market as a big move unfolds. This month’s article conveys that sentiment again but this time with a case study from the Cotton futures market. In particular we take a look at Cotton’s December contract. Its daily bar chart below (continuous chart symbol CT-Gann.Z in ProfitSource) shows the bear market from the 28 February 2024 top (85.25 cents per pound) down to the current low of 66.26 on 16 August 2024. While it would have been nice to be short from that top, hi-lighted in the middle of the run down (in green) is the 27 June 2024 weekly swing chart top (75.84), and this article discusses why and how that intermediate top (an “in between top” if you like) could have been traded down to the 16 August 2024 low.
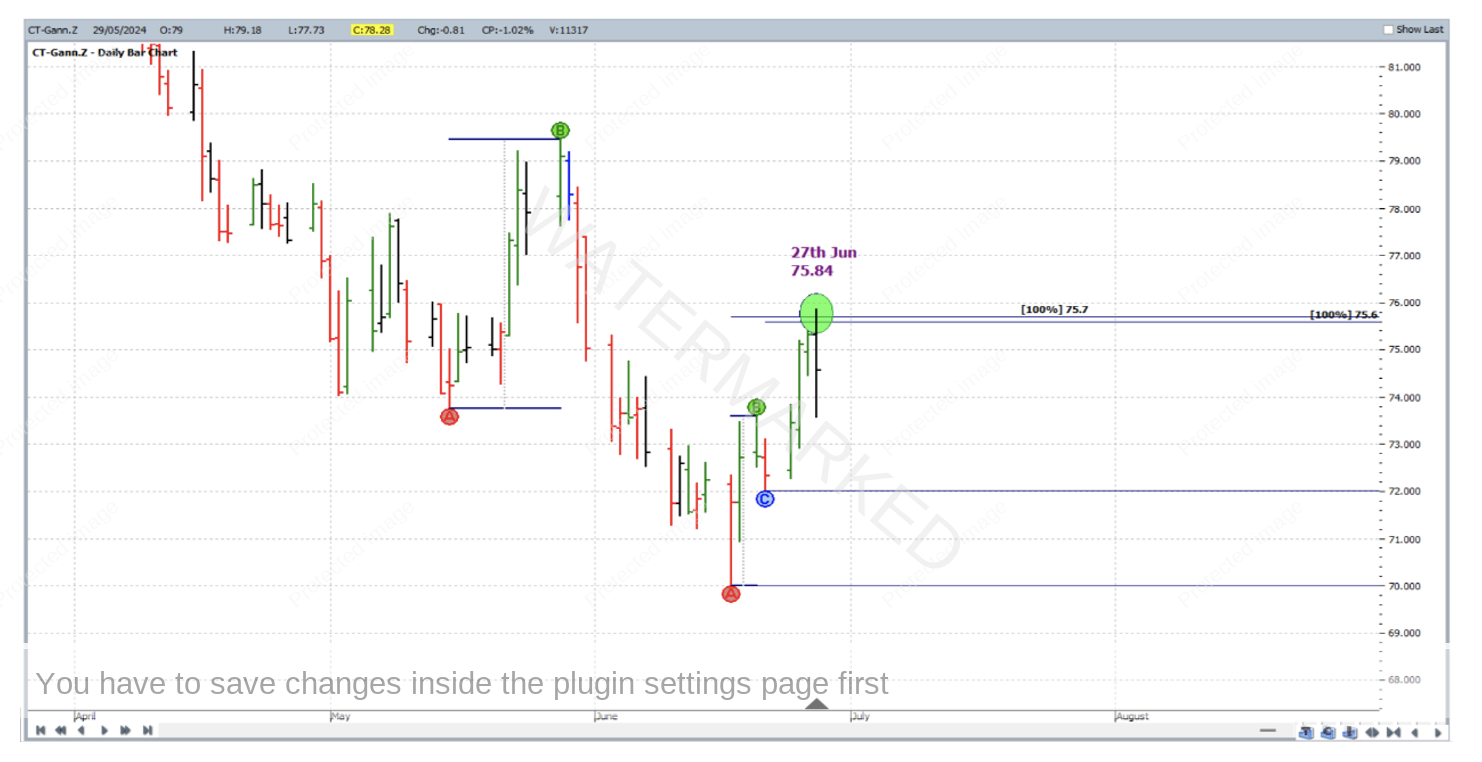
Zooming into the market action that lead into late June, we can see that two applications of the ABC pressure points tool (one based on swing highs and lows from the weekly swing chart, the other based on swings from the daily chart) had their 100% milestones clustering closely – within 10 points of each other at 75.70 and 75.60 respectively. This price forecasting is shown below on the same chart but in Walk Thru mode.
Points A, B and C in the chart above were placed as follows:
Weekly Chart
Point A 15 May 2024 low 73.75
Point B 28 May 2024 high 79.45
Point C 17 June 2024 low 70.00
Point D (100% milestone) 75.70
Daily Chart
Point A 17 Jun 2024 low 70.00
Point B 20 June 2024 high 73.59
Point C 21 June 2024 low 72.01
Point D (100% milestone) 75.60
So that’s two reasons to look out for a turn, but what else was there? The weekly trend was down but were there any other price forecasting factors to support the evidence found already? Let’s dive into some analysis on the 30 minute bar chart and see.
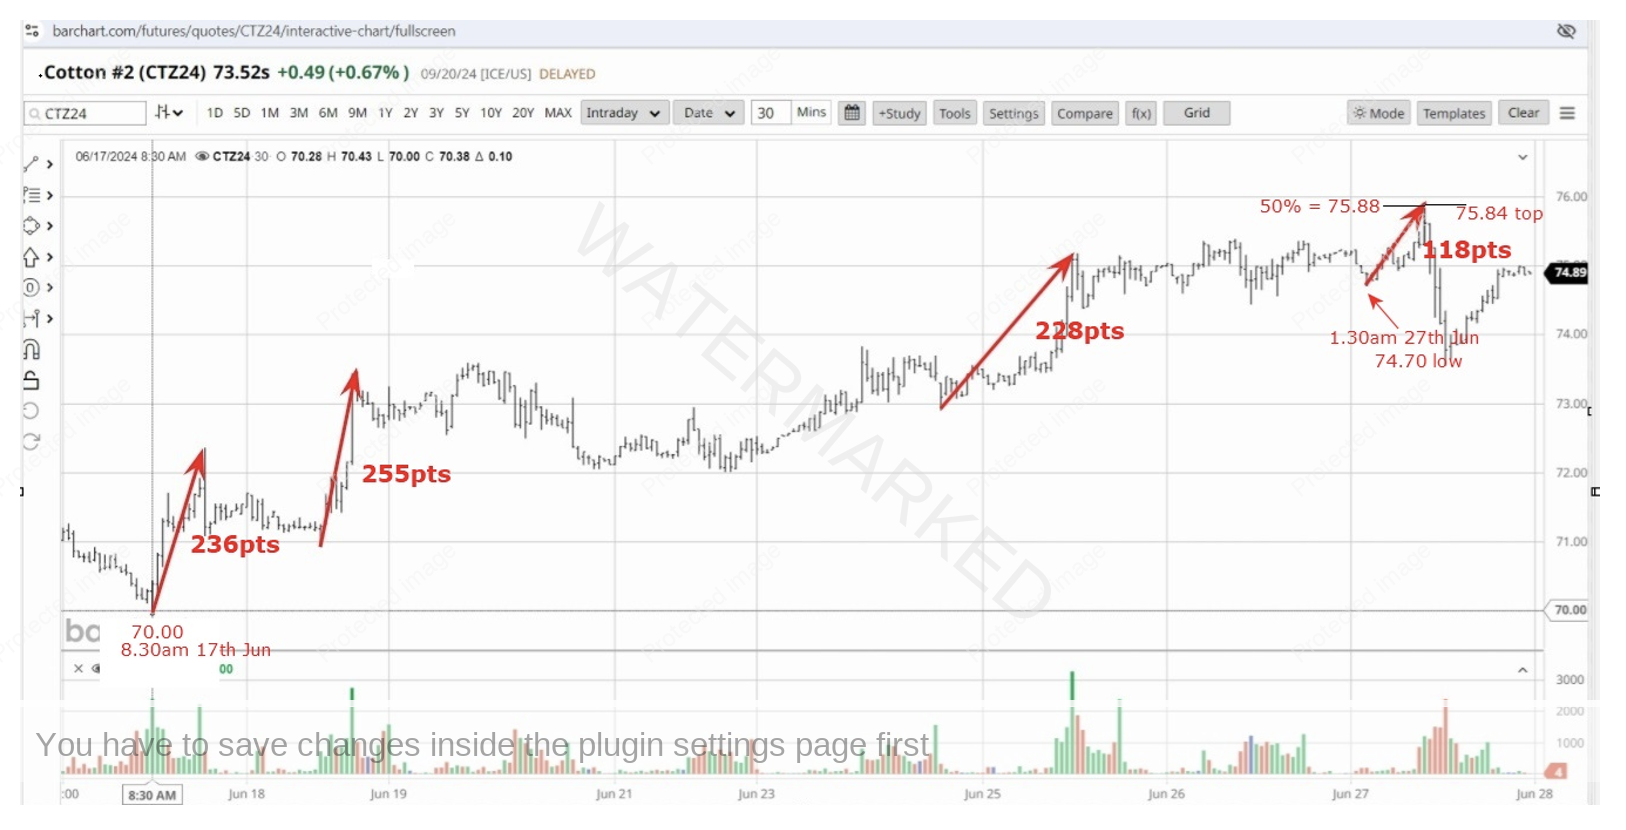
From the low of 70.00 on 17 June 2024 8.30am Eastern Time, a very clear First Range Out of 236 points (point size in this market is 0.01) ran up into the 8pm high of 72.36 on the same day. This FRO proved itself as useful a few times during the run up to the final top of 75.84; this is shown below in the chart from barchart.com and we note finally that 50% of this FRO (118 points) when projected from the 27 June 2024 1.30am low of 74.70 gave 75.88, which was the third input to the price cluster.
To summarise the chart above, Points A, B and C of the FRO application were placed as follows:
30 Minute Chart
Point A 17 June 2024 8.30am low 70.00
Point B 17 June 2024 8.00pm high 72.36
Point C 27 June 2024 1.30am low 74.70
50% Milestone 75.88
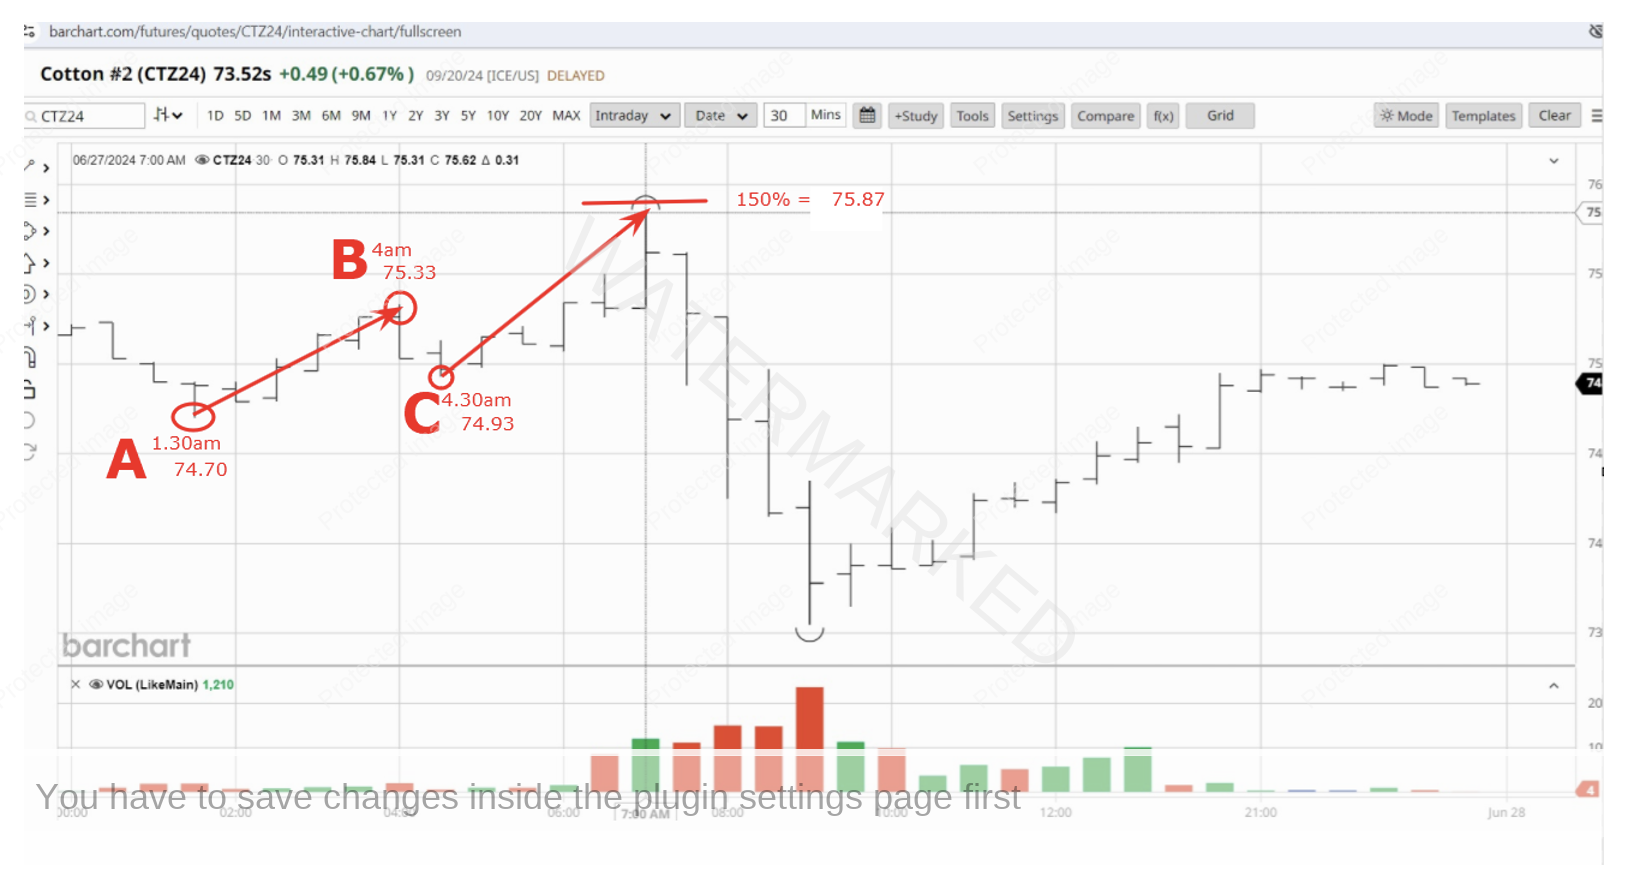
While we’re at it, there was more analysis from the 30 minute chart that gave a fourth input to the price cluster. Zooming further into the 30 minute bar chart for market action on 27 June 2024, there was another application of ABC Pressure Points with the 150% milestone coming in at 75.87; this is shown below.
To summarise the chart above, Points A, B and C of the Repeating Ranges application were placed as follows:
30 Minute Chart
Point A 27 June 2024 8.30am low 74.70
Point B 27 June 2024 4.00am high 75.33
Point C 27 June 2024 4.30am low 74.93
150% Milestone 75.87
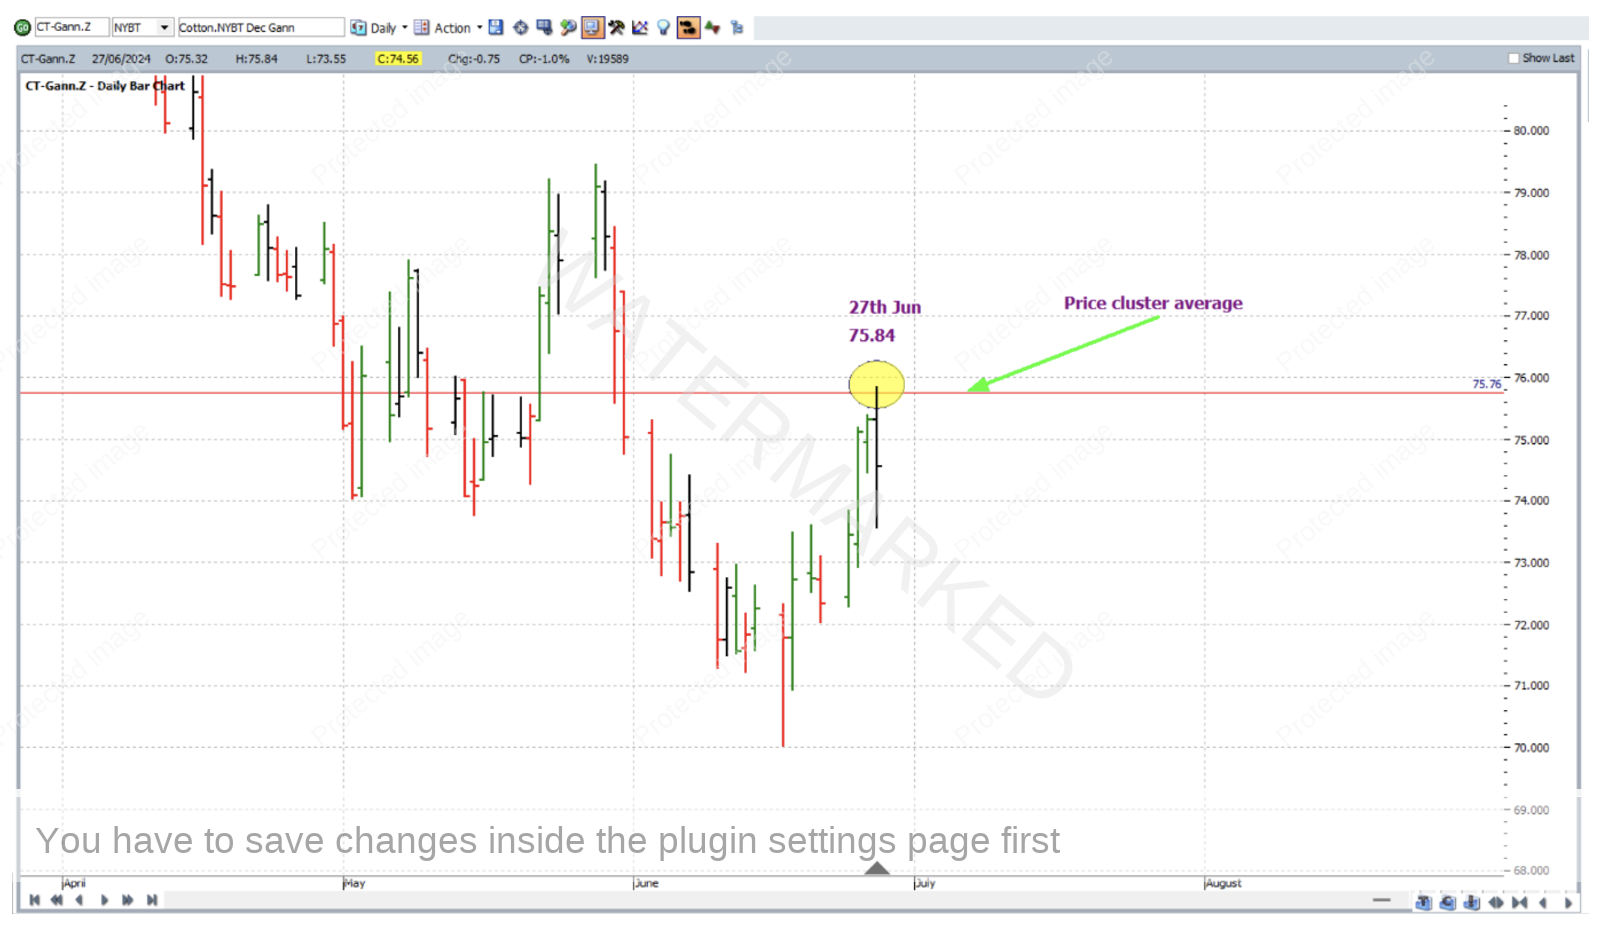
To summarise the price cluster, the four main inputs (75.70, 75.60, 75.87 and 75.88) were very narrowly spread from one another, and averaged out at 75.76; with the final top for 27 June 2024 at 75.84 only false breaking that level by 8 points – a relatively small error in relation to the size of an average daily bar in this market. Back to ProfitSource and this is shown in the chart below in Walk Thru mode.
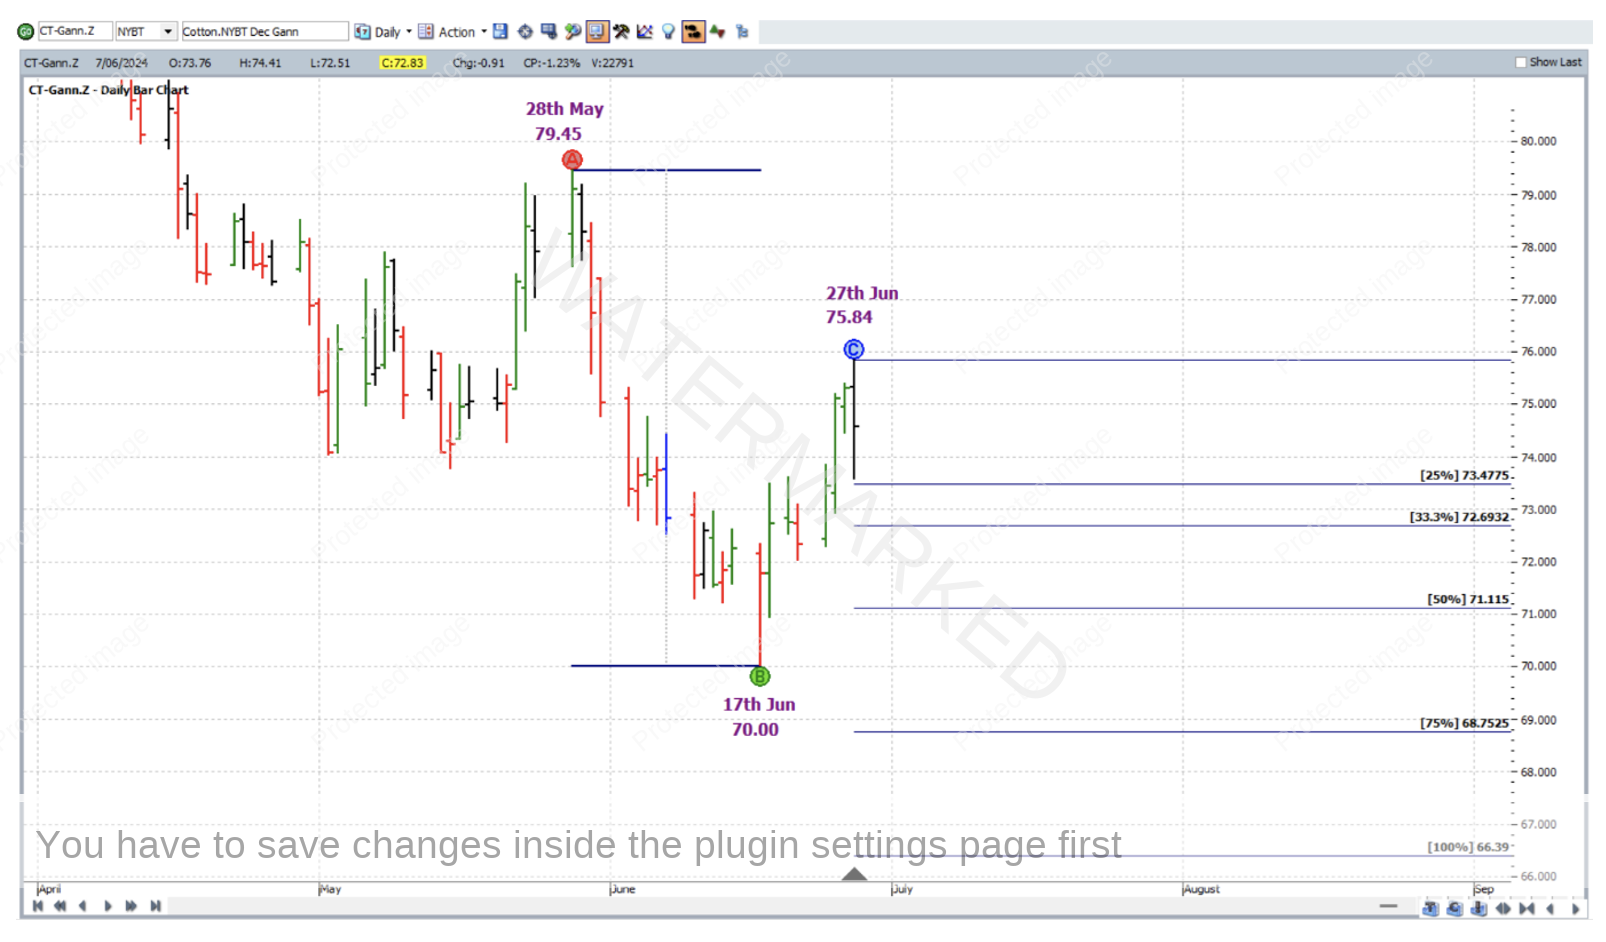
As for trade entry, as the 30 minute swing chart turned down from the 75.84 top, you’d be short December Cotton at 75.30 with initial exit stop at 75.85; the trade then to be managed Currency style as though in a normal weekly ABC short trade, with Points A, B and C placed as follows:
Point A 28 May 2024 high 79.45
Point B 17 June 2024 low 70.00
Point C 27 June 2024 high 75.84
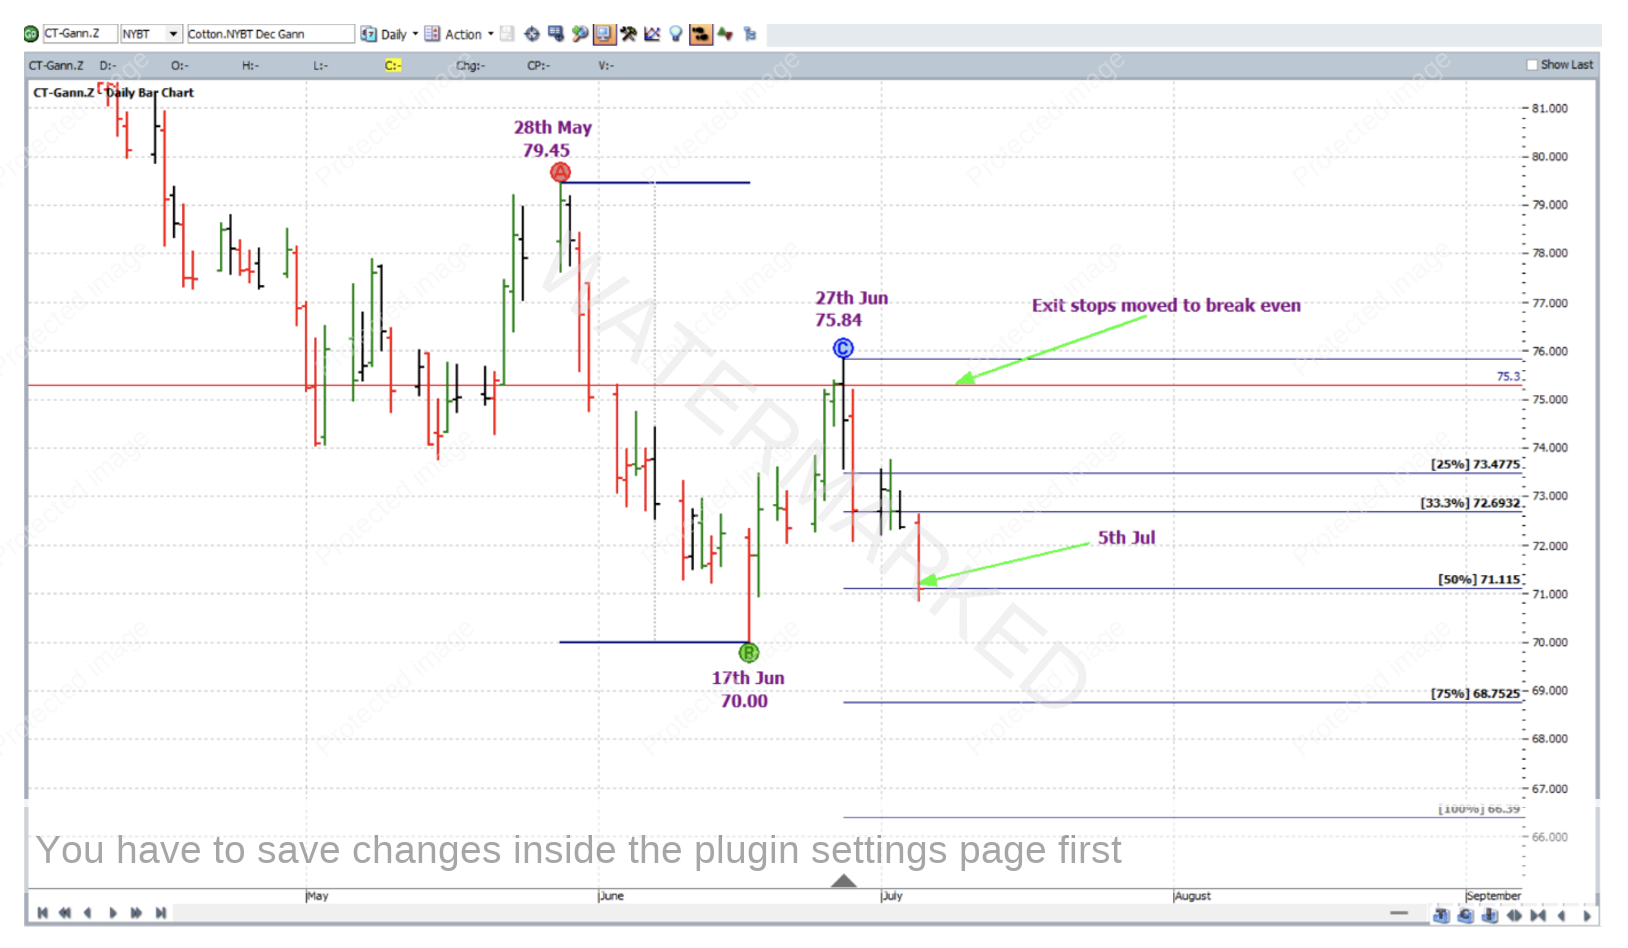
On 5 July 2024, the market reached the 50% milestone and exit stops were moved to break even.
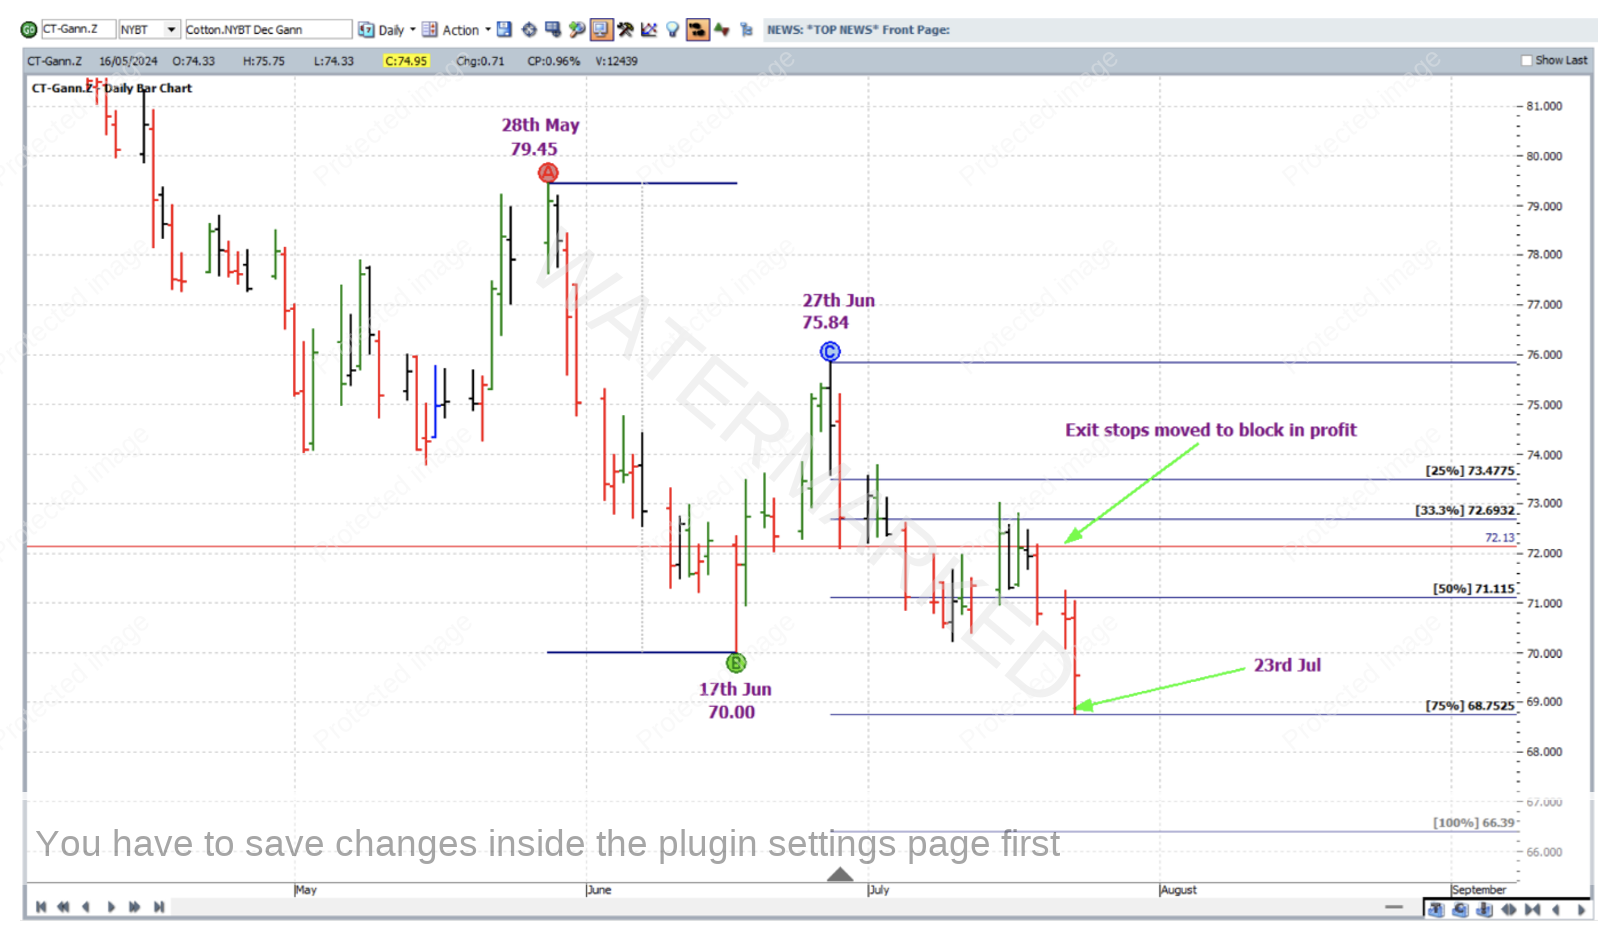
On 23 July 2024, the market reached the 75% milestone and exit stops were moved to one third of the average weekly range (approximately 102 points based on the previous 60 complete weekly bars) above the 50% milestone to lock in some profit.
On 16 August 2024 the 100% milestone was reached and profits taken at 66.39.
Now to break down the rewards. In terms of Reward to Risk Ratio:
Initial Risk: 75.85 – 75.30 = 0.55 = 55 points
Reward: 75.30 – 66.39 = 8.91 = 891 points
Reward to Risk Ratio = 891/55 = approximately 16 to 1
According to the ICE website, the contract specs for Cotton futures say that each point of price movement changes the value of one futures contract by $5 USD, so in absolute USD terms the risk and reward were:
Risk = $5 x 55 = $275
Reward = $5 x 891 = $4,455
At the time of taking profits, the reward in Australian Dollars was approximately equal to $6,700.
If 1% of the account size was risked across the space of the 30 minute bar at entry the percentage change to the account would be as follows:
16 x 1% = 16%
Work hard, work smart.
Andrew Baraniak
