Can We Trust the Banks?
The headline of this article I must admit is misleading, you may be wondering If I have completely travelled to the dark side of financial market noise makers diving into a current conspiracy theory that banks are here to transition us all to the new world order. It’s nothing as sinister as that. Now that you have got this far into this article my recent experience from banks as a consumer is a poor one as I have seen my closest branches close and the treatment of cash as a rare commodity is worrying.
We do need to consider that banking is and will continue to undertake transformation as we all look to do as much online as possible. Maybe cash will become a relic of the past, but I still like to dabble in it and am currently enjoying numismatology with my youngest son. It’s amazing what the right note or coin is worth to collectors.
Better still rather than worrying about banks and their service, we can trade them for our returns and feel somewhat better if we must deal with them, knowing we are in front. In many ways its like paying too much for petrol at the pump, if you are making money off the commodity then the pain at the pump is lessened, but I digress.
If I was starting out again in the markets, what would I tell my myself if I had the chance? Simply it’s the value of being a specialist, doing simple things well that are repeatable is a somewhat boring but profitable pursuit. If I think of Gann’s writings he discussed so much and so many techniques. The 50% rule sticks to my mind as a simple skillset, and we can expand this to include the value of pressure points (both retracement and extension). If I think of David Bowden in the price courses, it would have to be double bottoms and double tops (this can be expanded to include triple and quadruple variations as identified).
In all the noise and confusion of markets currently if we can find simple, high probability patterns that have defined trading rules, we can create an edge over the market. If we examine CBA.ASX, the Commonwealth Bank stands as Australia’s largest and there are countless examples of people covering this stock for guidance. We must certainly agree that the participants of this stock range from mum and dad investors to institutional exposure so it’s not a market that would be easily controlled by a handful of participants.
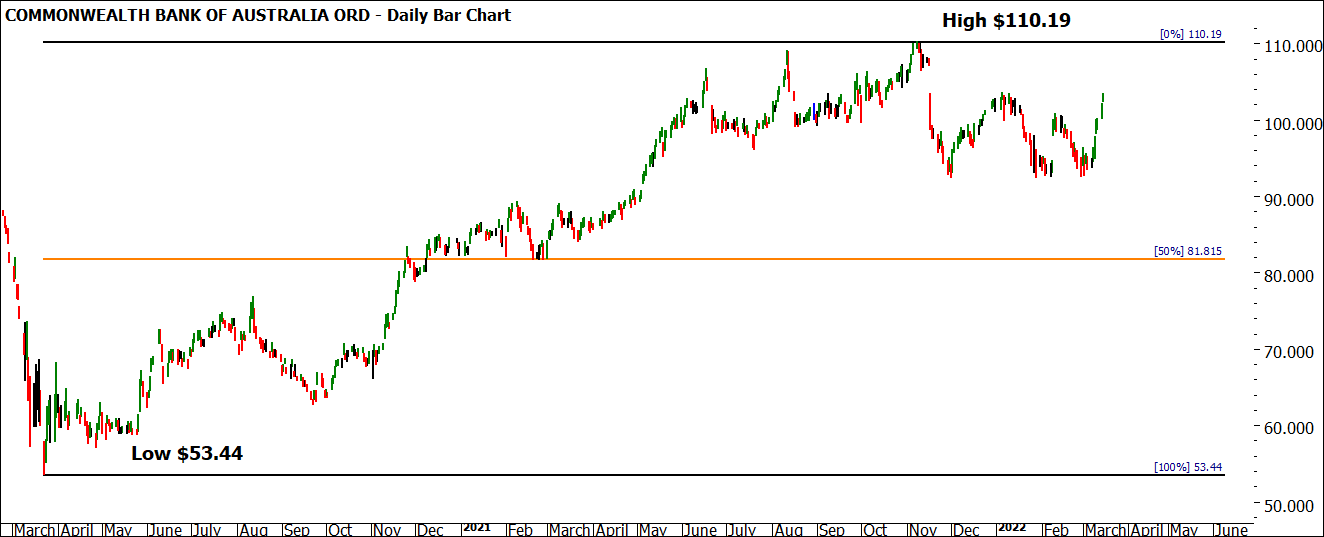
Chart 1 shows the last two years of price action as this stock nearly doubles post the COVID low of March 2020. The trend was of course very strong, the best trades were on the long side and it’s worth noting the 50% level of that range was important on the way up even before the eventual high came in.
Chart 1 – Daily Bar Chart CBA
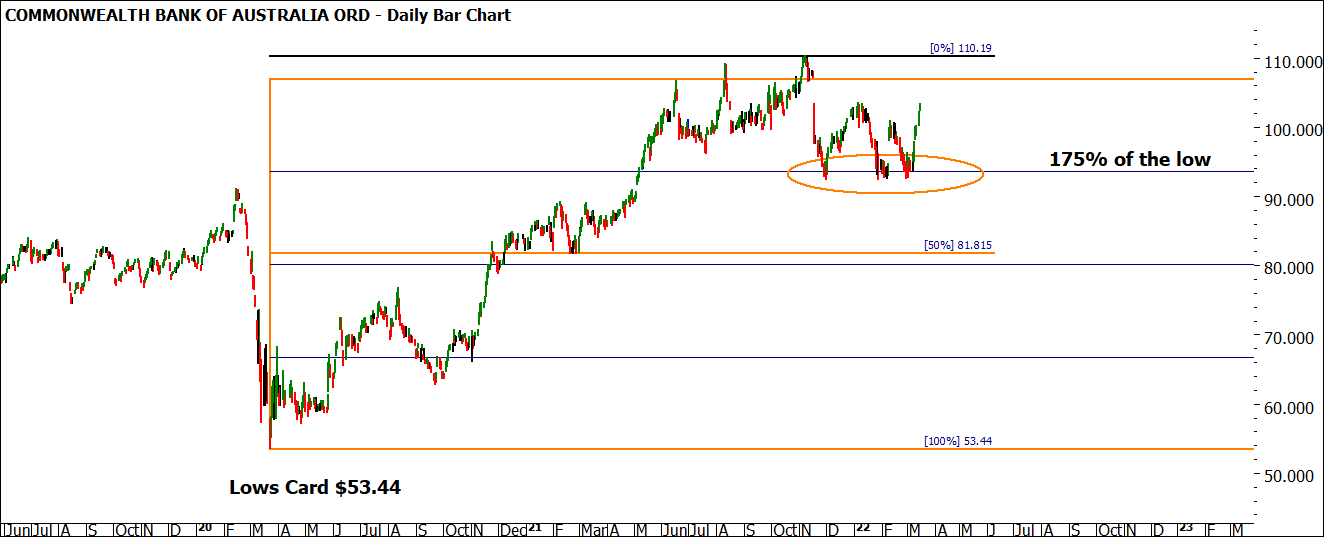
In 2022 there should be a pattern that stands out as being straight forward to identify and that is the multiple bottoms at $93. Chart 2 shows the lows in question and as an overlay the 2020 Lows Resistance Card. 175% of the low is acting as support on the triple bottoms as another sign of strength.
Chart 2 – Daily Bar Chart CBA
There are other lows that assist in this discussion which include the GFC Low and also the All-Time Low of $5.77. If we look at multiples, we can see 16 x $5.77 lines up very nicely with the triple bottoms of 2022.
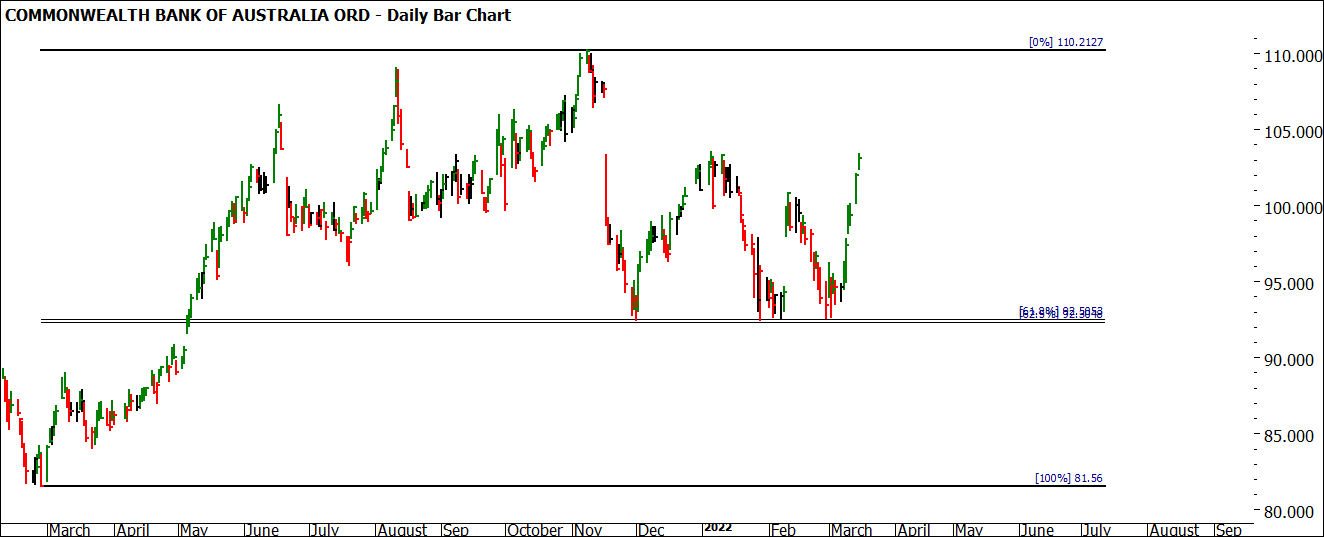
Chart 3 gives us not quite the 50% level (which would have made this setup Classic Gann, but an acceptable retracement back to 61.8% or 62.5%, take your pick).
Chart 3 – Daily Bar Chart CBA
So, if we can define and specialise in a pattern and be patient enough to watch them come around, we can get in front of the market in terms of returns. Many might be asking could we have been long from the January low as this would have been a double bottom at the time. The answer is yes, and a discussion as to why early March was a better place to be long than late January lies within David’s time lessons and specifically Time by Degrees for those familiar with its use.
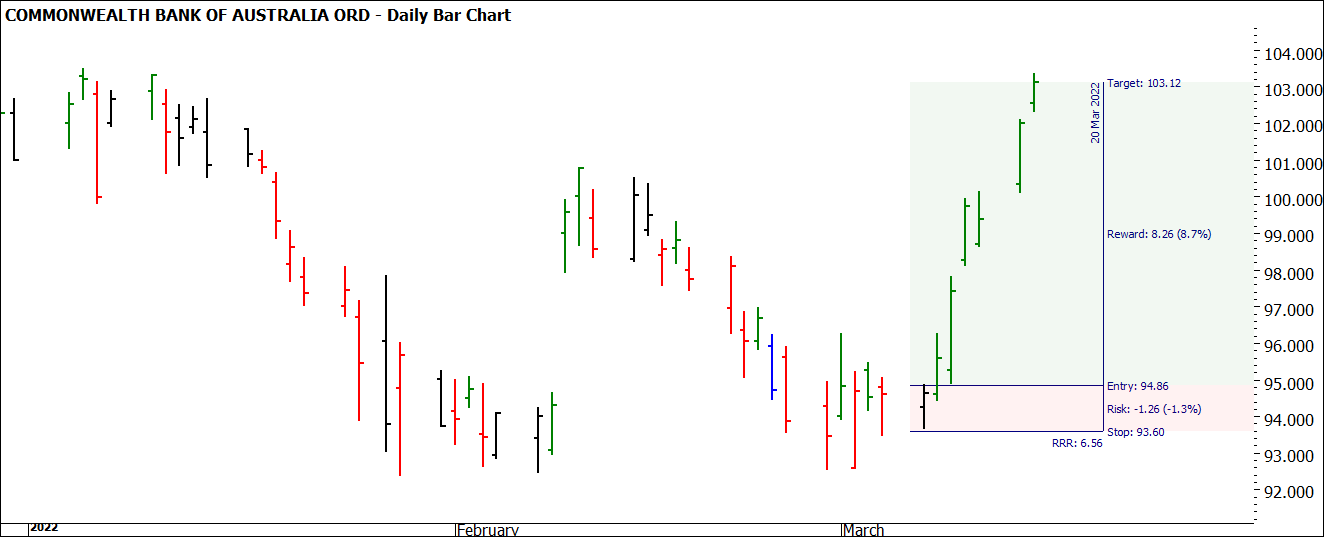
The easiest and most conservative entry was available as the market broke above the inside day of 7 March 2022 as the swing chart turned up. In this case you may have run stops below the swing bottom, however, the inside day can offer a smaller risk proposition if we hide our stops below the low of that day.
At the time of writing, we see in Chart 4 a 6.5:1 Reward to Risk Ratio is in play at the current close with more potential for upside.
Chart 4 – Daily Bar Chart CBA
The possibility of using David’s 200% rule to project a target encourages us to think there could be more in this, but as it stands now the risk of $1.26 per share (or CFD) to a theoretical return of $8.26 per share (or CFD) should motivate you to specialise in simple patterns. If you can lock in these types of returns, then trusting the banks into the future may be the least of your concerns.
Good Trading
Aaron Lynch


