Chart Re-Creation Exercises
One of the best ways to learn how to get the most out of your software
is to practice recreating charts…
I will start this month’s article with a simple quote or saying which we’ve all heard someone else say untold times before – “oh that…., I know how to do that….it’s easy!” Easy for the other person to say you’re thinking – so you say back – “yeah right – only because you already know how!”
Have you ever felt that way in a conversation about ProfitSource? If so, read on – things are about to change!
Ok so now you have ProfitSource installed, you can open a chart, create a Quote List and maintain data – but what about the big thing – our analysis? This article can help!
As a Safety in the Market student there was one thing, which above all, helped me the most when it came to learning how to use ProfitSource. And this was re-creating charts. Lots of them in fact. Which charts? The examples we see in SITM newsletter articles, course manuals, and webinars. So what this article will do is take you through a full example of a “chart re-creation”.
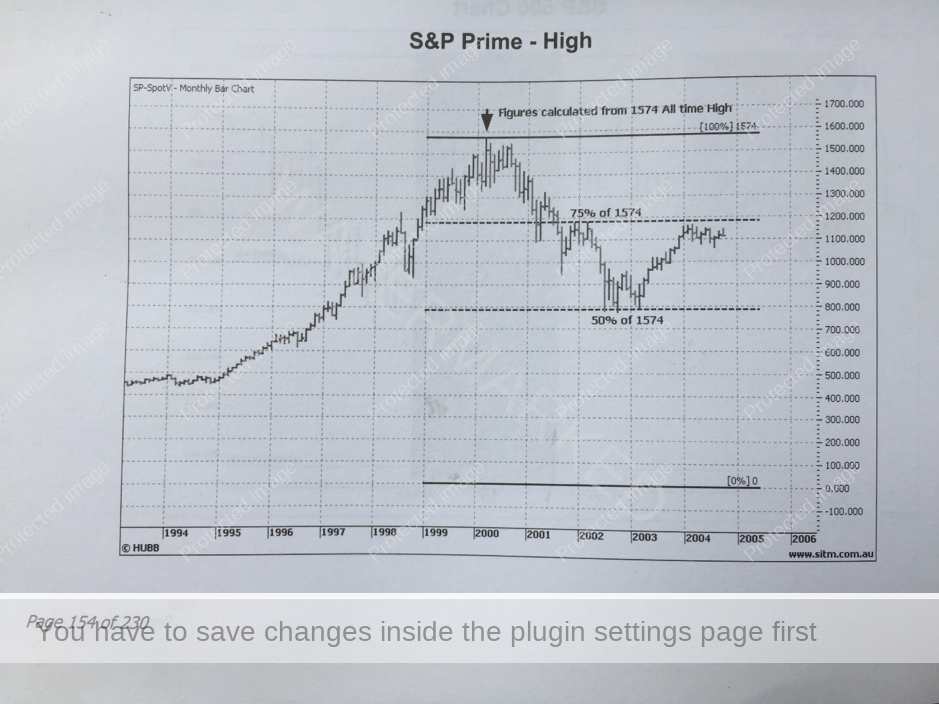
Here is an example of a Highs Resistance Card applied to a chart. You will find it on page 154 of your Number One Trading Plan manual. It is applied to the S&P 500 futures contract chart (symbol SP-SpotV in ProfitSource).
Our goal here is to re-create the above chart, as an example exercise to the best of our ability. Read this article one step at a time, following my instructions directly, applying them in your own ProfitSource installation. Start by doing the following:
- Open ProfitSource
- Charts -> New Price Chart -> Enter SP-SpotV and click OK
Now that you have the chart open, hit the plus “+” key twice in order to change from the daily bar chart to the monthly bar chart.
Left click and drag the chart so that the year 2000 high for this market (a price of 1574) is well and truly centred in the chart space.
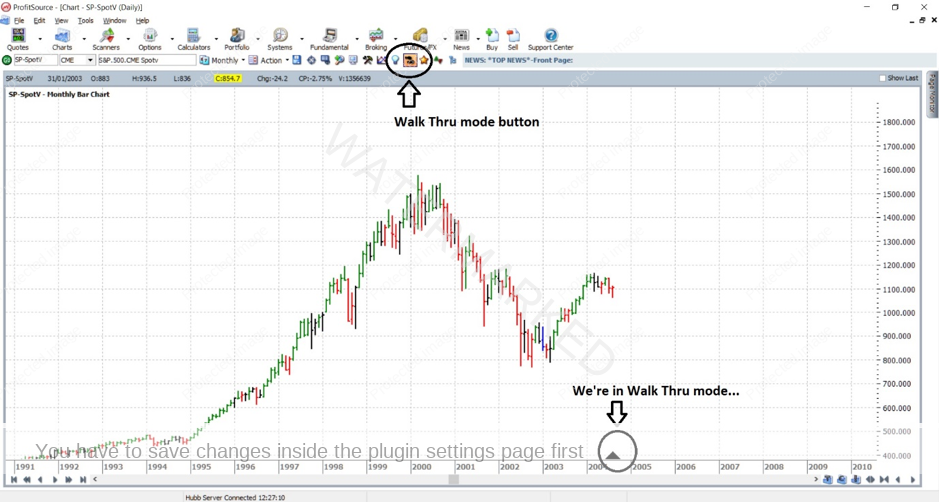
Click on the Walk Thru mode button – this is located in the toolbar above the chart. Apply the start of Walk Thru mode to anywhere in late in 2004 – with another mouse click in line with somewhere in 2004 on the time axis – just so that the amount of data in your chart matches what is in the chart from the manual. Remember – we are trying to get a close match, and make our chart look like the one in the manual. Pinpoint perfection is not the goal – just get it close. If you have done everything right so far, the chart below is what you should see, excluding a few comments about the Walk Thru mode.
(By the way, make sure you have a similar price scale – you can adjust this by left clicking on the price scale itself, then mouse drag up and down until you can see a price of 0)
So now the chart is ready to go. Let’s apply a Drawing Tool and some text features to complete it…
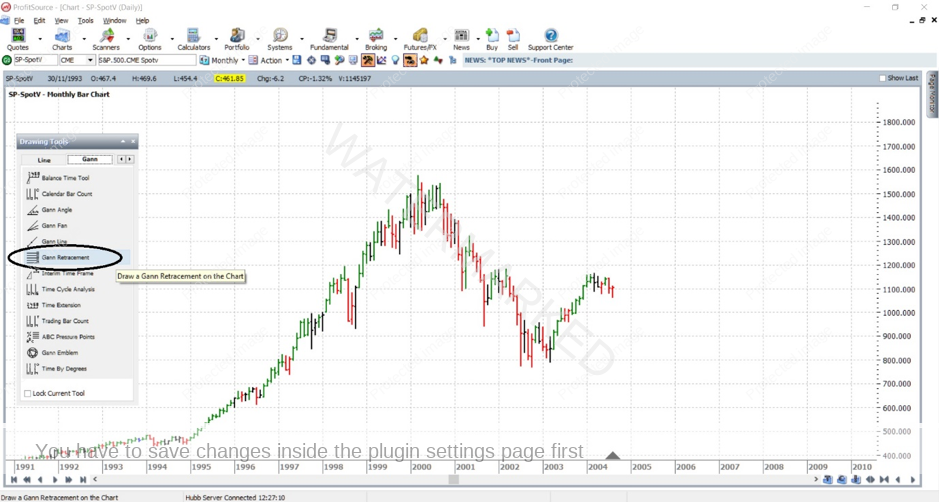
Click on the Drawing Tools icon in the toolbar above the chart space. Then click on the Gann tab, and left click on the Gann Retracement tool – this is what we will be using to apply the Highs Resistance Card to our chart. From this point onwards in the article I will refer to this as our “Resistance Card”.
Now that you have selected the right tool, apply it to the chart as follows:
First left mouse click (somewhere above and to the left of the 1574 high on the chart) – this will initially fix the top left corner of the resistance card to the chart.
…then drag the mouse towards the bottom right of the chart, and then…
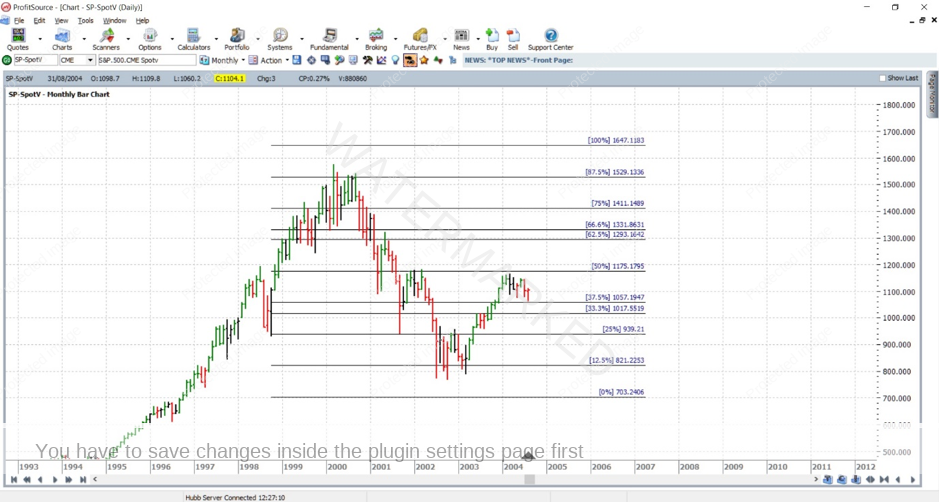
a second left mouse click will fix the bottom right corner of the resistance card to the chart. If you have done everything right to this point, you should see something like the following:
Now that the resistance card is on the chart, the next thing you should notice is that we have not in any way fine-tuned its settings to the correct price (high of 1574), nor to the same format as the chart we are trying to re-create. And of course, there are probably way more resistance levels on our card than the one in the chart from the manual (although this can be subject to your Gann Retracement tool default settings if you have changed these prior to reading this article). So what do we do next? We double click anywhere on the Resistance Card and this will bring up its Properties box – this is where we can do the fine-tuning.
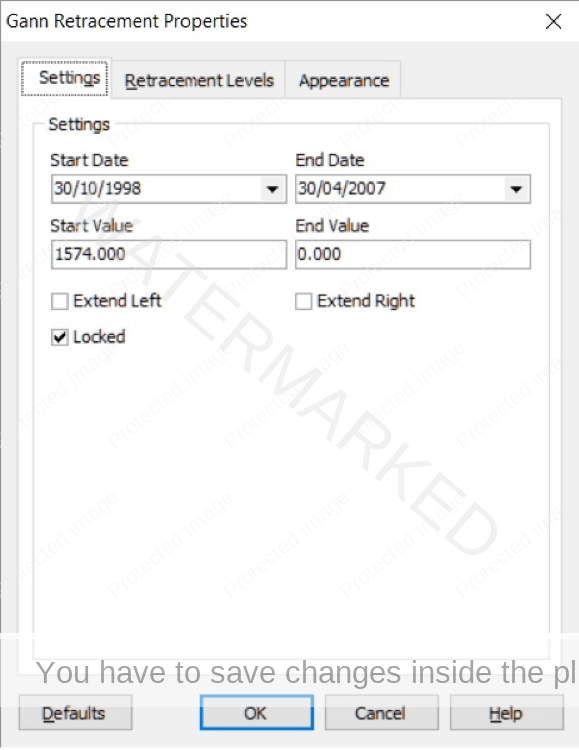
By default, the Properties Box will open to its Settings tab. It is here that we lock in the prices and dates so that the corners of our Resistance Card are placed on the chart where we want them. Being a Highs Resistance Card, I have set the Start Value to a price of 1574, and End Value to a price of 0; dates I will leave up to you, but choosing a Start Date somewhere in 1998 and an End Date somewhere in 2007, for example, will make sure that we cover enough market action to make our chart look like the one in the manual. See below for an example of what you want to see thus far (by the way, for this exercise, it is a good idea to also make sure we check the “Locked” box – just so we don’t accidentally move the chart around later on).
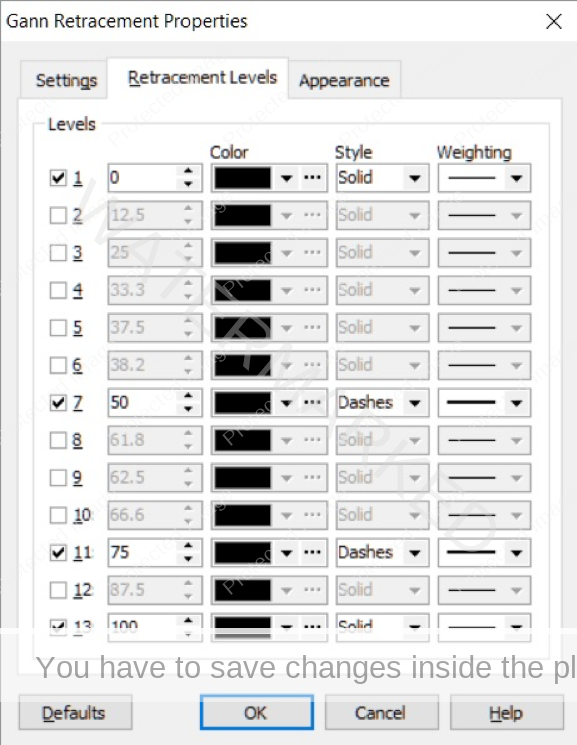
Before clicking OK, we need to make some adjustments in another tab – the “Retracement Levels” tab. Once you are there, the first task is to uncheck all but the 0%, 50%, 75% and 100% resistance levels – i.e. to the same as those shown in the manual’s chart (remember this article is about re-creating what you saw in the manual). And while we’re at it, let’s practice a little formatting. Change the “Style” from Solid to Dashes, and for “Weighting” use the little drop-down boxes to display a nice thick line – like the ones in the manual’s chart, which are thicker than the ProfitSource default.
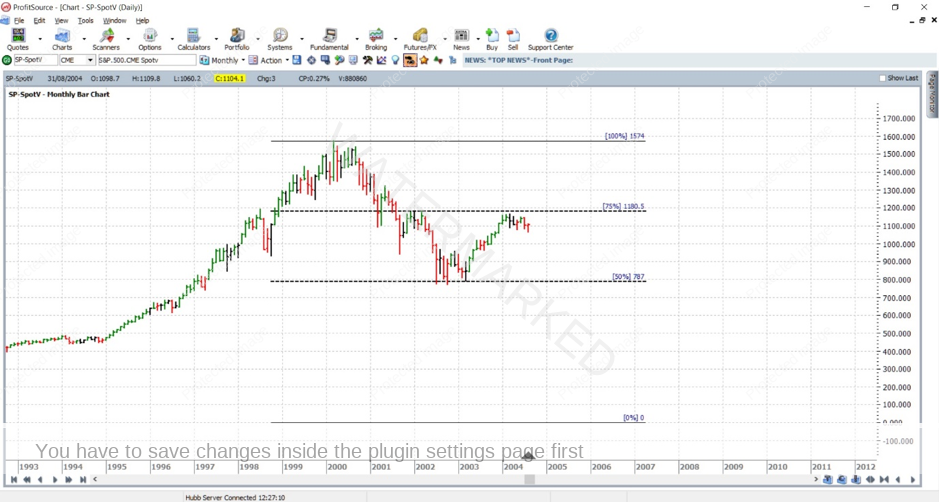
We are now finished with the tabs and their settings. Click OK, and you should see a chart which is progressing nicely – its corners locked into the right place (remember if you can’t see the 0% resistance level, left click on the price scale then mouse drag up and down until you can see a price of 0).
If all has gone well to this point – you’re doing great! Now for a few easy labels… Again click on the Drawing Tools box, but this time go to its Line Tab, and select Text.
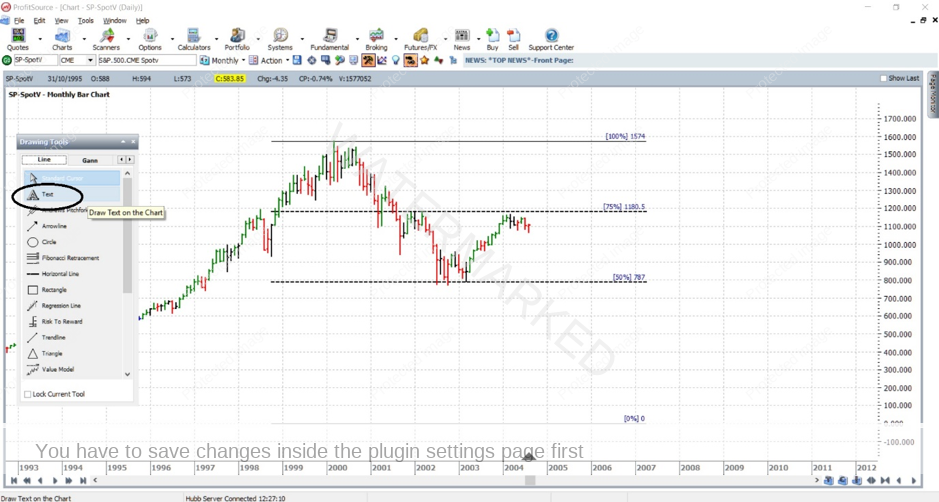
Then we apply this to the chart by clicking somewhere above the 100% resistance level – and start typing: “Figures calculated from 1574 All-Time High”
Simply hit the return key after you have added a label.
Likewise, create the two other labels and place them accordingly:
“75% of 1574” and “50% of 1574”.
You should see the following:
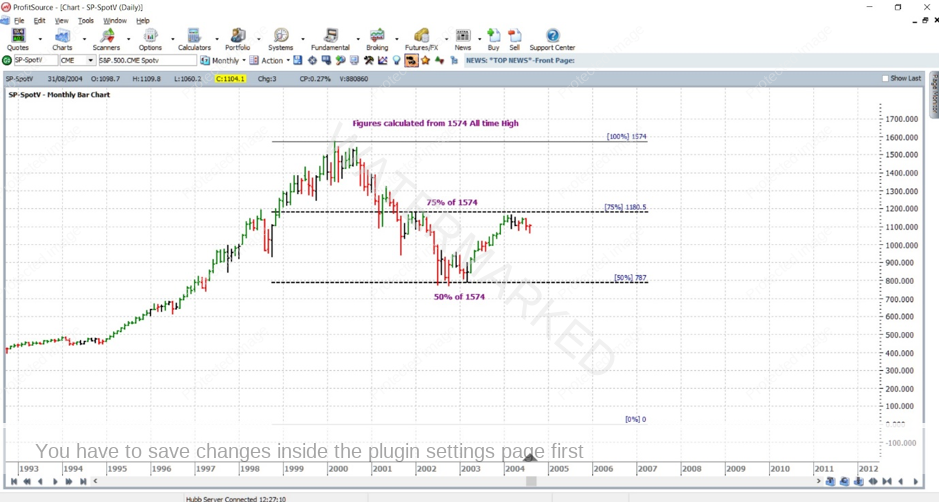
Note that the text we type can also be formatted to your desire – size, colour etc – I will leave this for you to try – simply double click on your chart’s text and go into Properties and have a play with it!
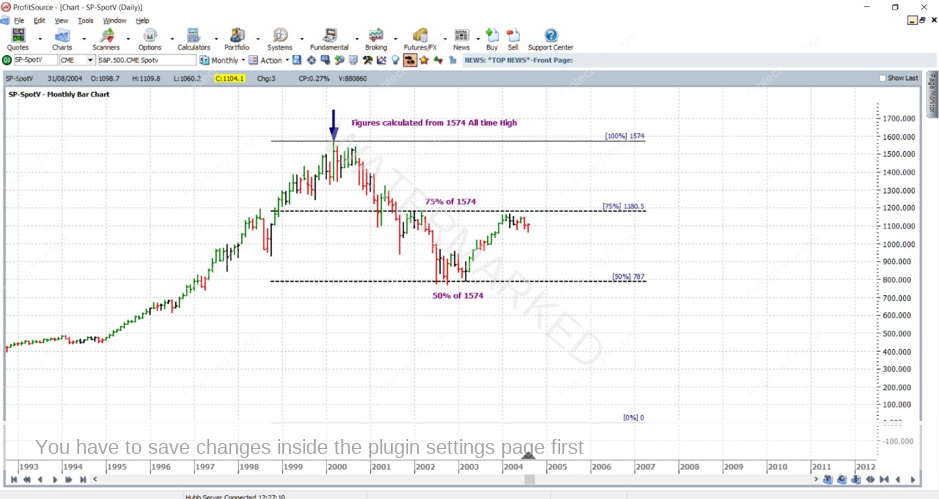
One more thing left to add – a simple arrow. Go back to the Drawing Tools box, select the Arrowline tool. Go ahead and apply a small arrow to help label your own chart as in the manual. See below. An arrow’s format and appearance can also be adjusted by going into its Properties – double click on the arrow and try it. Feel free to play with different formats, colours, defaults etc. After you have finished with that, here is what you will ideally see:
Hanging in there?! A long and tedious article I do appreciate – but we’re almost there – please bear with me! You have two tasks left:
- Save your work in ProfitSource (click on the Disk icon in the toolbar above the chart page OR select Action -> Save Chart Page).
- Send a screenshot to us at Trading Tutors (that’s right – this is homework 🙂 )
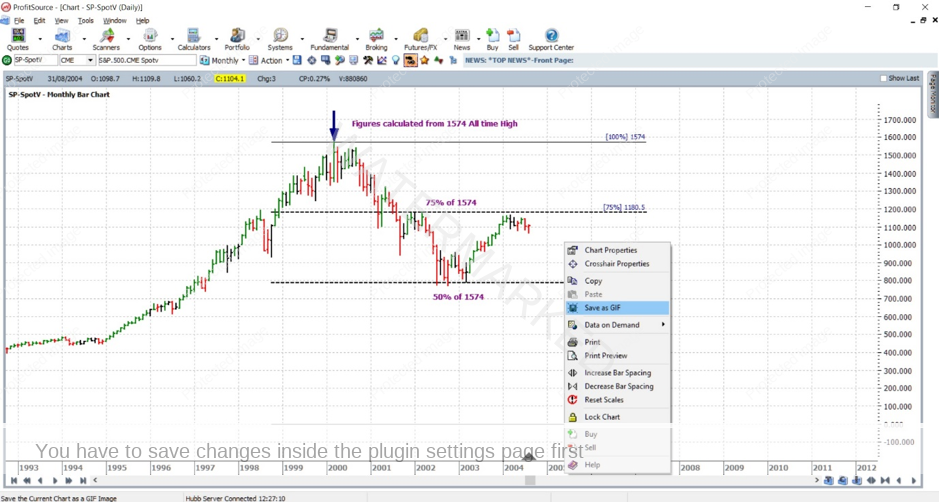
Right click on the chart and select Save As GIF. Save your GIF file in a known folder on your computer, and when you get a chance, email it to us at Trading Tutors. We are more than happy to take a look at your chart and provide any feedback.
And of course, if you get stuck anywhere along the way – try again – and if you still get stuck, drop us a line, we’ll be more than happy to help.
One final thing – remember the first one is always the hardest. Practice with more examples – send an original, and your attempt to recreate it – we’ll take a look. Work hard to get it right, and those that follow will become easy – easy because now you know how…
Work hard, work smart.
Andrew Baraniak
