Cocoa Continued
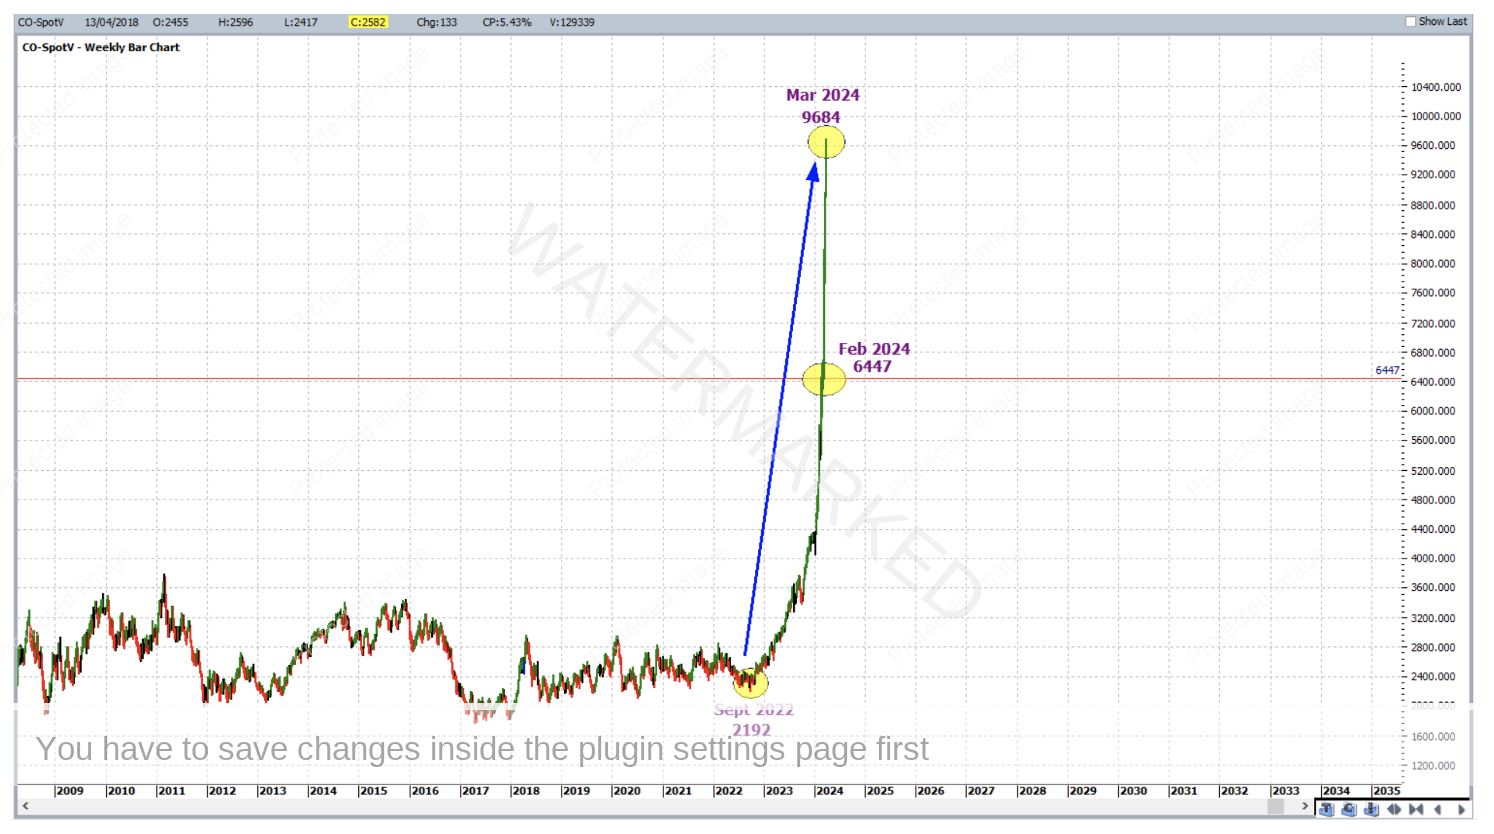
At the time of writing in March of 2024, the Cocoa futures market sits at a high of $9,684 USD per metric tonne. This is more than quadruple the value of the last major low in September of 2022. For reference purposes, Cocoa was discussed in last month’s article and at that time Cocoa had basically tripled its value since the same low. This is illustrated below in the weekly bar chart from ProfitSource, symbol CO-SpotV.
In other words, the upward run has continued which begs the question, what other opportunities have come about for the bulls, and how exactly? Before going into that, there is some general form reading to do.
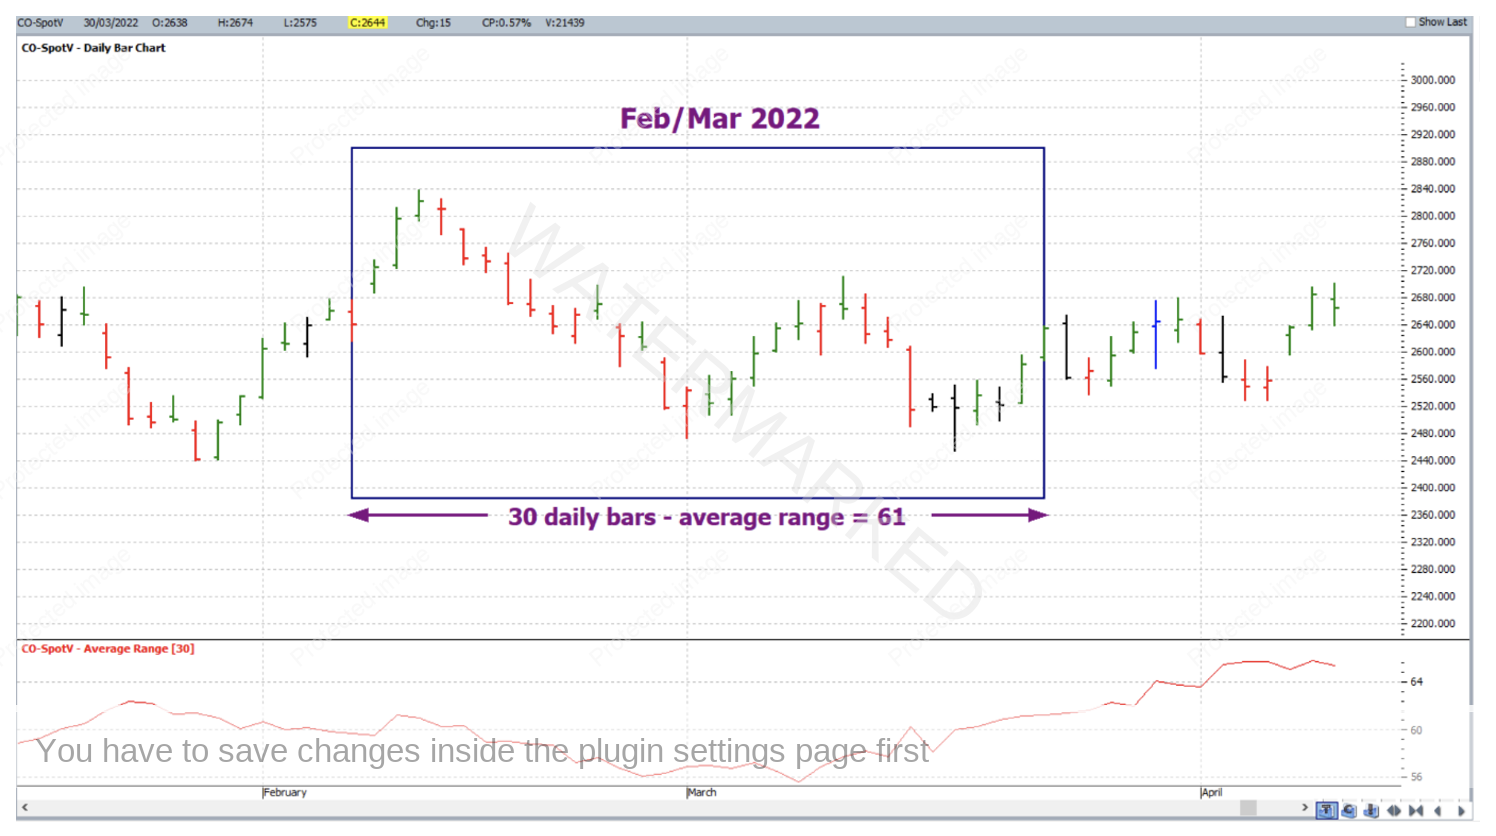
When a market like this gets going, the average intraday bar chart sizes become much larger than usual. To illustrate, let’s compare two different Cocoa charts, from two different periods. Firstly, below is the daily chart of Cocoa from February/March of 2022 – two years ago, well and truly before Cocoa made its breakout. As calculated by ProfitSource’s Average Daily Range (AR) indicator, the average size of 30 bars from that period was approximately $61 USD per metric tonne. This was a fairly typical daily bar size at the time, and with it still enough volatility for the odd high probability trade and enough strength in daily swing chart confirmation.
But what about now?
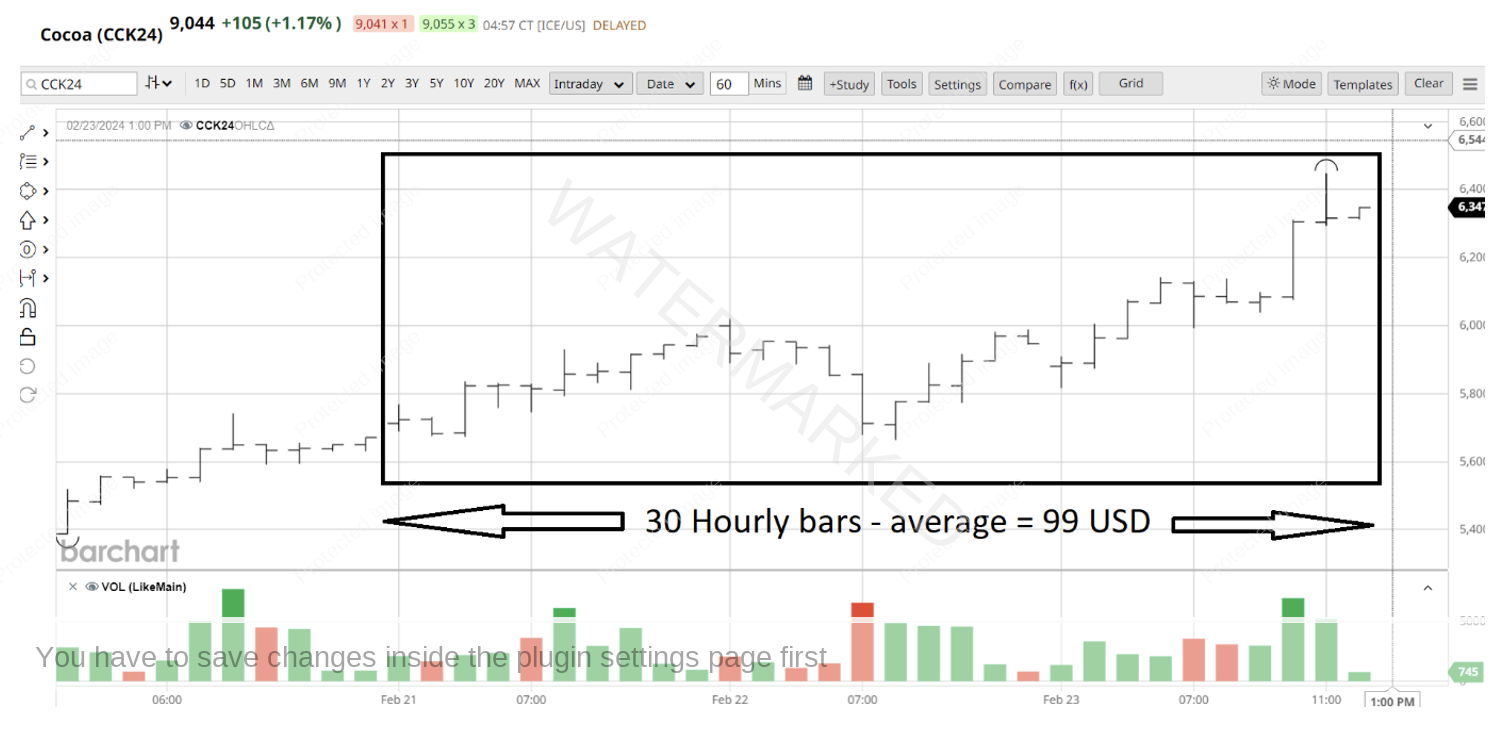
To get to the point, below is the hourly intraday bar chart of the May 2024 contract from barchart.com; for comparison purposes, this time 30 bars were also taken (from the week ending 23 February 2024) and their average size determined. This figure came in at $US99!
So with bars of this magnitude, the intraday chart of late has had basically the same if not more strength than the daily bar chart in times gone by. Therefore, intraday chart analysis and trade execution will be the dominant theme for the remainder of this article.
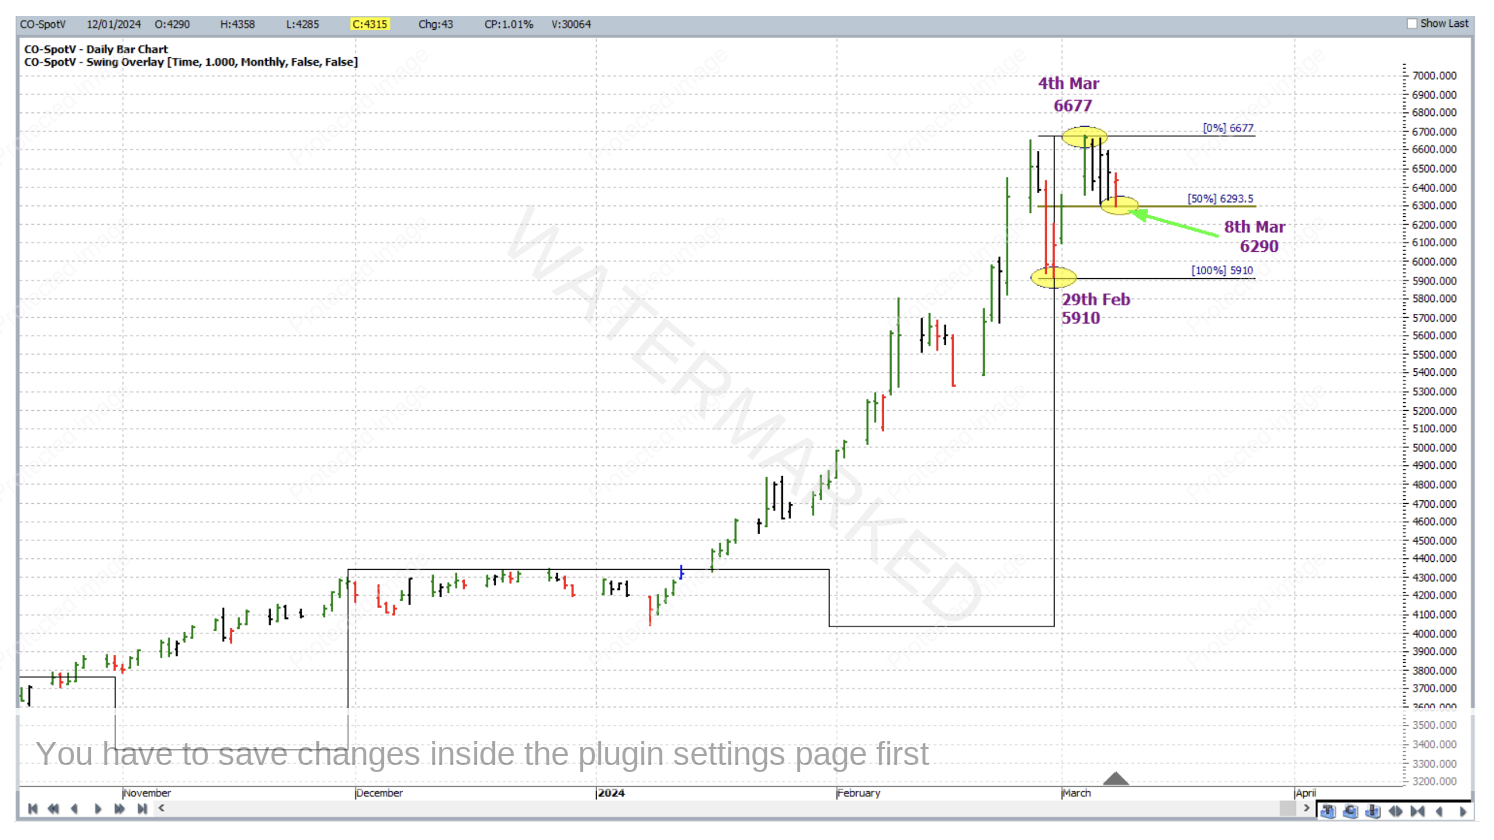
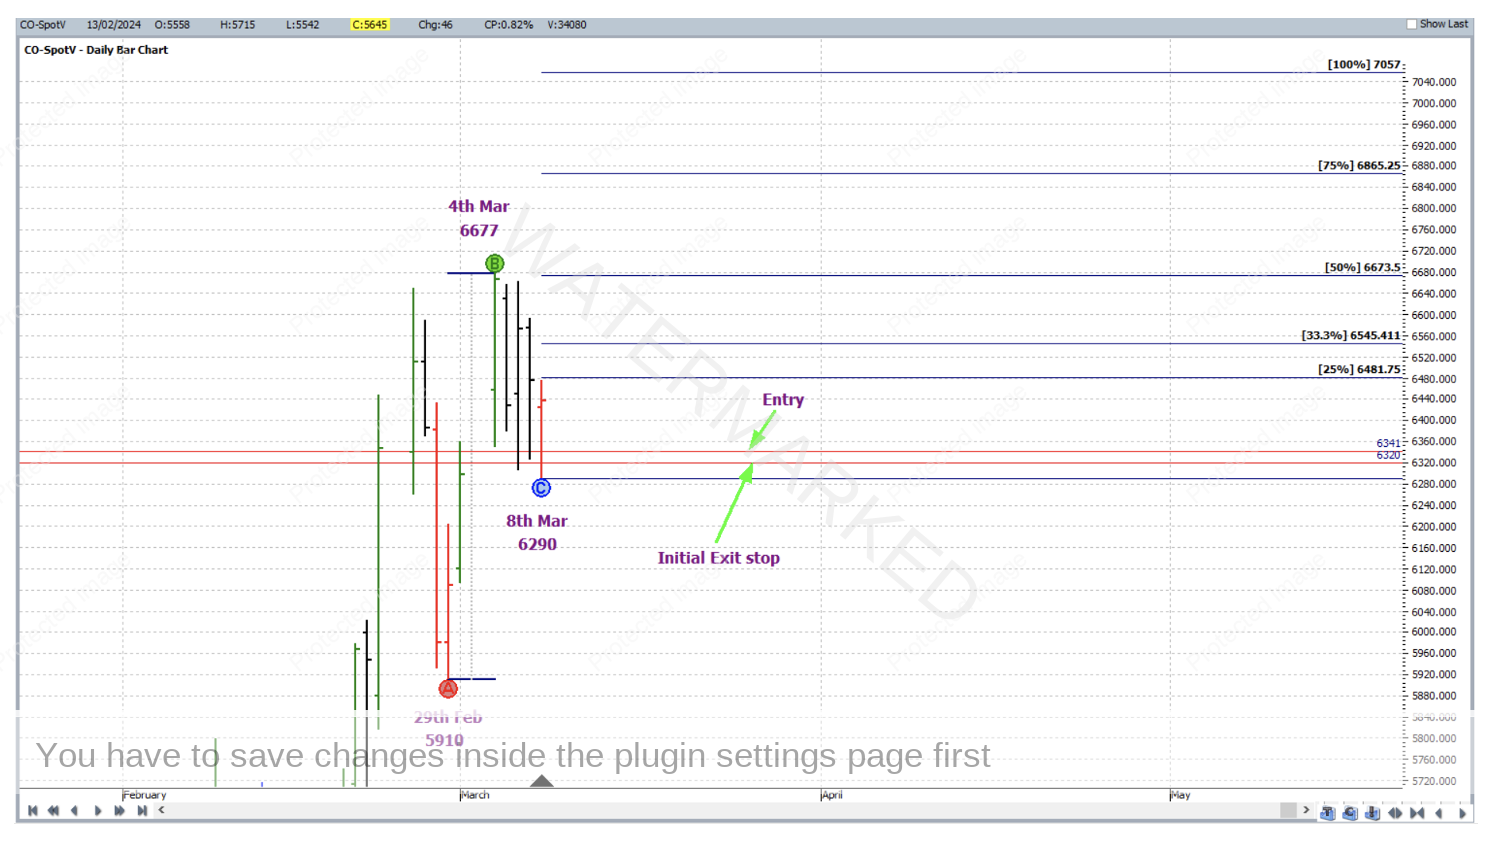
Now to the trade. Below is a screenshot where we go back to ProfitSource and zoom into the daily chart and outline two very simple pieces price analysis favoring the bulls for a long trade as at 8 March 2024.
The Ranges Resistance Card from the 29 February 2024 low (5,910) to the 4 March 2024 high (6,677) had its 50% resistance level at approximately 6,293. On 8 March the market lowed at 6,290 – only false breaking that resistance level by 3 points.
And in addition to that there was Major Trend Sympathy – i.e. the weekly swing chart trend was UP and in sympathy with any long trades as shown by the higher tops and higher bottoms on the weekly swing overlay.
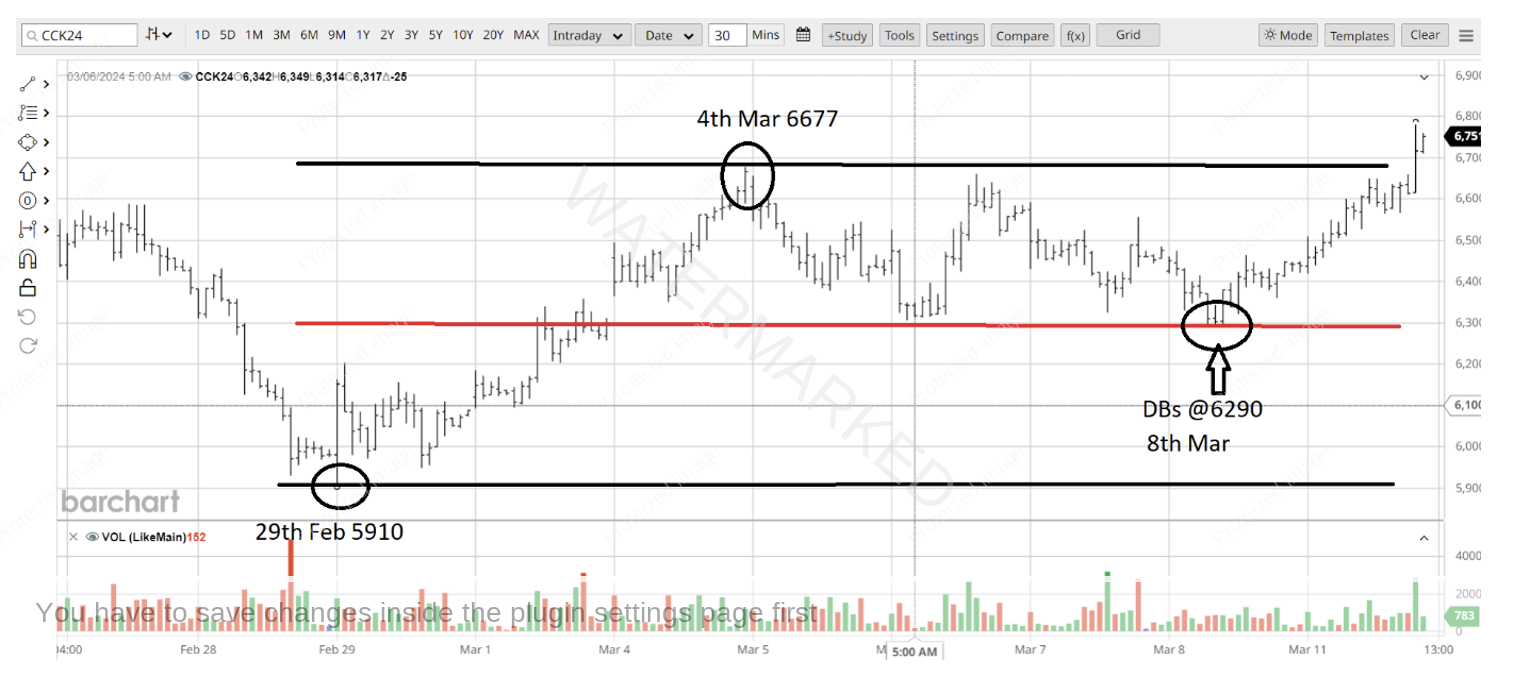
What else was there? Next back to barchart.com and zooming into the 30 minute bar chart to recreate the Ranges Resistance Card from above but this time drawing attention to two exact double bottoms at the 6,290 level.
Without any further analysis, after the double bottoms, a first higher swing bottom entry signal on the 5 minute bar chart had you long Cocoa at 6,341 with an initial exit stop at 6,320 at 8.05AM Eastern Time, 8 March 2024.
For trade management, the last daily up swing was chosen as reference range, with Points A, B and C placed as follows:
Point A: 29 February 2024 5,910
Point B: 4 March 2024 6,677
Point C: 8 March 2024 6,290
Both the entry price an initial exit stop loss are shown on the chart below.
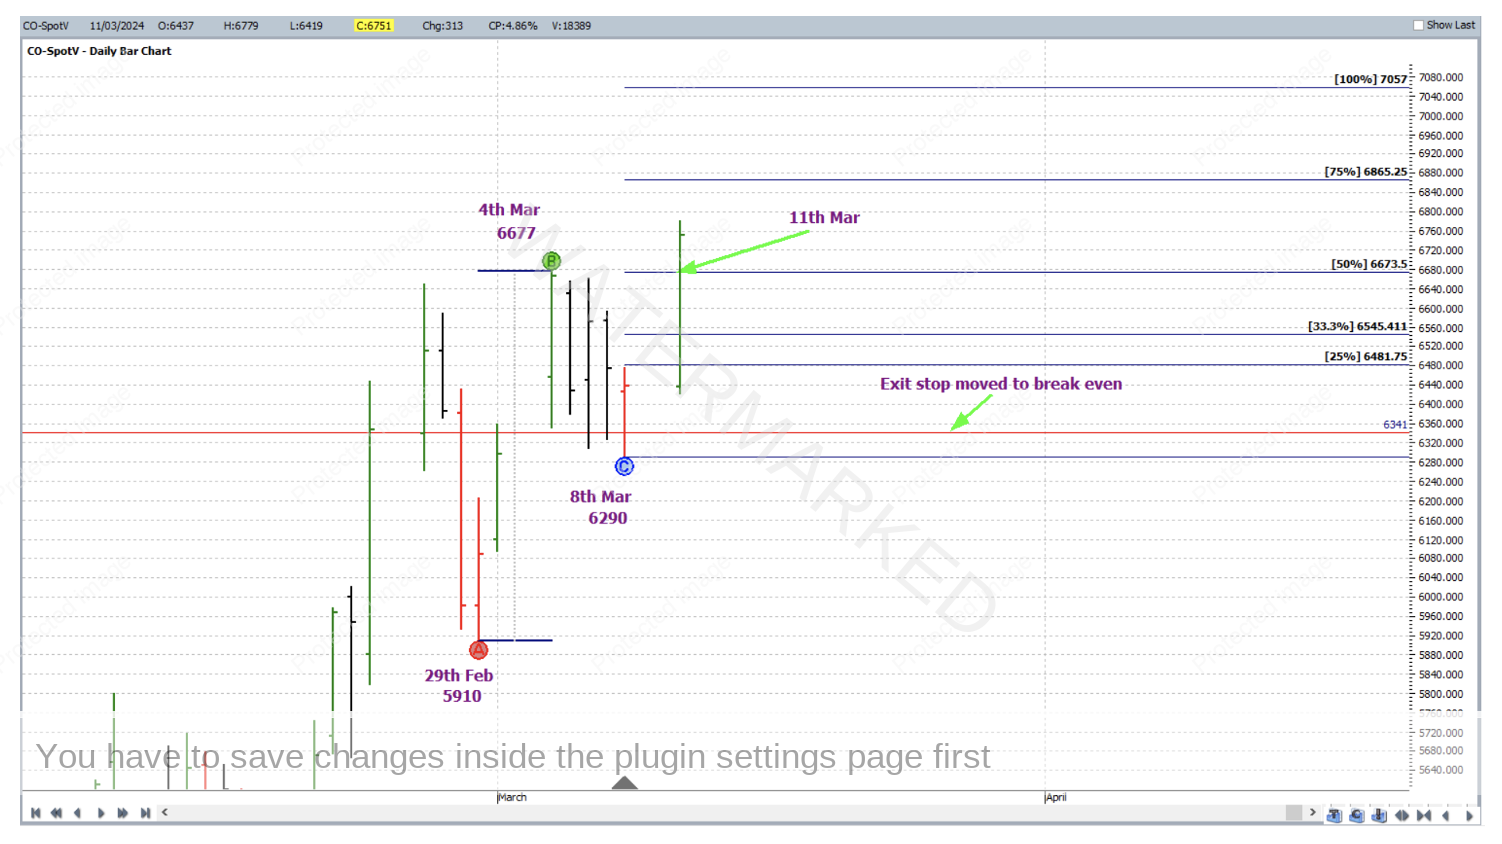
Stops were managed currency style as though now in a standard ABC trade. On 11 March 2024, the market broke through the 50% milestone and stops were moved to break even.
Then only a day later, on 12 March 2024, the 100% milestone was reached and profits taken.
To break down the rewards first of all let’s take a look at the Reward to Risk Ratio:
Initial Risk: 6,341 – 6,320 = 21 = 21 points (point size is 1)
Reward: 7,057 – 6,341 = 716 points
Reward to Risk Ratio = 716/21 = approximately 34 to 1
Assuming that 1% of the account size was risked across the range of the 5 minute bar at trade entry the gain in account size would be as follows:
34 x 1% = 34%
For any financial asset (whether it is a trading account or not!) to increase in value by 34% in as little as two business days is an outstanding performance to say the least.
Each point of price movement changes the value of one Cocoa futures contract by $10USD, so in absolute USD terms the risk and reward for each trade of the contract was determined as:
Risk = $10 x 21 = $210
Reward = $10 x 716 = $7,160
This reward was equivalent to approximately $10,830 AUD at the time of taking profit. As previously mentioned, one can also access this strongly trending market via CFDs where much smaller minimum positions sizes are available.
When a commodity like this breaks into fresh highs, with very little technical overhead resistance in the way, the bulls should be looking for reasons to get on board.
Work hard, work smart.
Andrew Baraniak
