Cocoa – Sticking to the Plan
Well, what a year it has been! We’ve seen some good volatility in just about all sectors of the market, especially some of the commodities. Like last month, this month’s article focuses on a high probability setup and uses the intraday chart for an entry. This time it is for the Cocoa futures market, and the example demonstrates the reward of being disciplined enough to stick to the same trading plan. And as a direct result, this month’s article has quite a similar format to the last.
The opportunity for the trade came during late October and early November of this year and the instrument used was the December 2020 Cocoa futures contract. This time it was a short trade out of the 26th of October top, and like the example for Sugar futures last month, a very high reward to risk ratio was available for the prepared and disciplined trader.
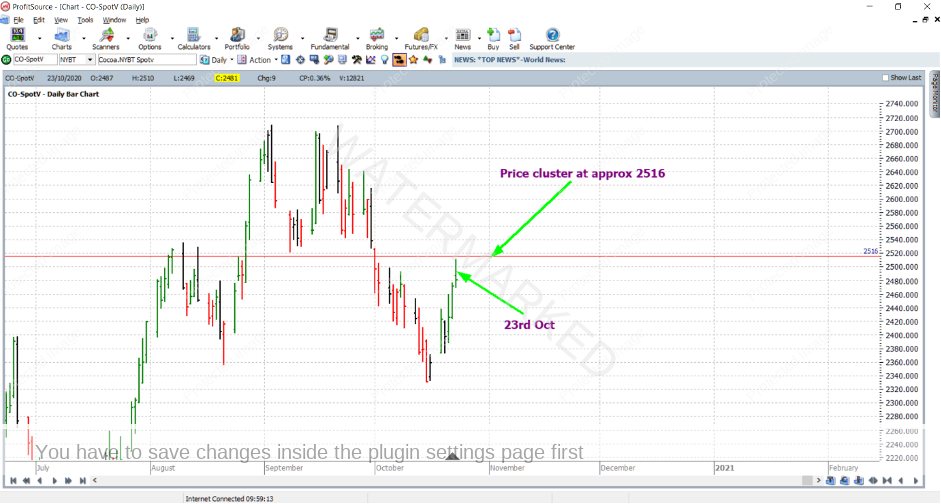
As technical traders of course we need to identify technical reasons for us to enter the market and take a trade. For our case study this month, the first reason was very simple – it was a short trade which was taken with major trend sympathy. In other words, the weekly swing chart had confirmed lower tops and lower bottoms, so the weekly trend was already down. This of course meant that a short trade was not taken against the existing major trend. As for the next three reasons to take the trade, it is your homework to find them. Go to the continuous chart in ProfitSource for Cocoa futures (CO-SpotV) and use your Price Forecasting skills to look for three other strong price reasons to take the trade. The hint is that three of these reasons averaged out at a price of 2516 USD per metric tonne, using price data leading up to the 26th of October. Have a go! As usual, you’re more than welcome to send us your analysis, and we’ll be happy to give some constructive feedback.
A few days before Monday the 26th of October 2020, the Cocoa market was moving up towards the price cluster at 2516. On Friday the 23rd, the market stopped just shy of the price cluster.
So with a good routine in place for your Price Forecasting, and a trading plan ready, this market was worth zooming in on for the next trading session – that of Monday the 26th. See the ProfitSource chart below.
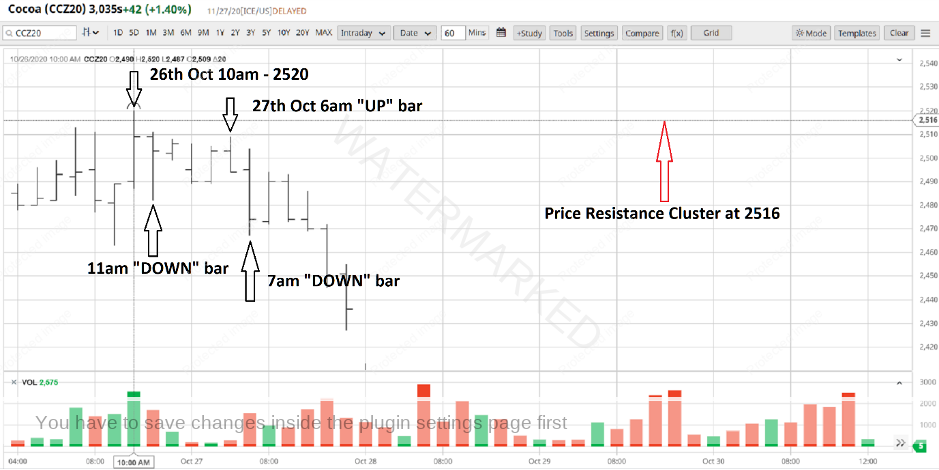
But, specifically, what do we mean by “zooming in”? In this case, we zoom in to the intraday chart. Let’s go to barchart.com and take a look at the hourly bar chart. Here is what you would have been looking for:
If you look closely at the chart above, you can see that the actual top came in at price of 2520 – at the high of the hourly bar of 10am (New York Time) on Monday the 26th of October. This was only 4 points past the price cluster at 2516 – a tolerable amount of error in this market. This would have had you on alert for an entry signal. But what entry signal?
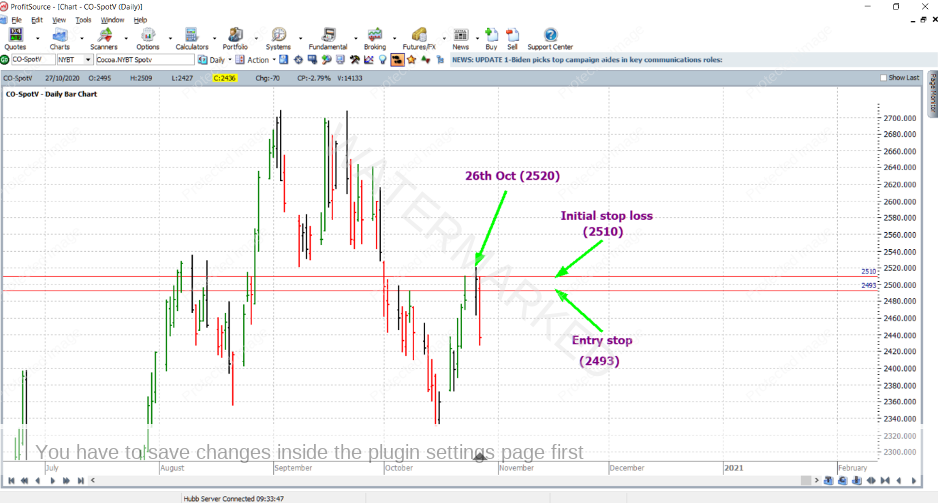
The 11am bar was a down bar, turning the hourly swing chart down, confirming a top in the hourly swing chart. Then the hourly swing chart pointed down until 6am on the 27th – when an up bar turned the hourly swing chart up. And then, in anticipation of a down bar for the next hourly bar, we’d have our entry stop 1 point below the low of the 6am bar (at 2493), and initial stop loss 1 point above its high (at 2510). In other words, you’d be anticipating a first lower swing top entry on the hourly chart. And this entry signal was triggered when the next hourly bar (7am for the 27th of October) was a down bar, confirming the first lower swing top in the hourly swing chart.
Note that through all of this, initiative and foresight with the hourly bar chart was required. The complete end of day daily bar for this market for Monday the 26th of October had not been finalised until after the intraday chart entry was triggered. As previously mentioned, this means that the trade is more aggressive, but worth the risk if the analysis is strong enough.
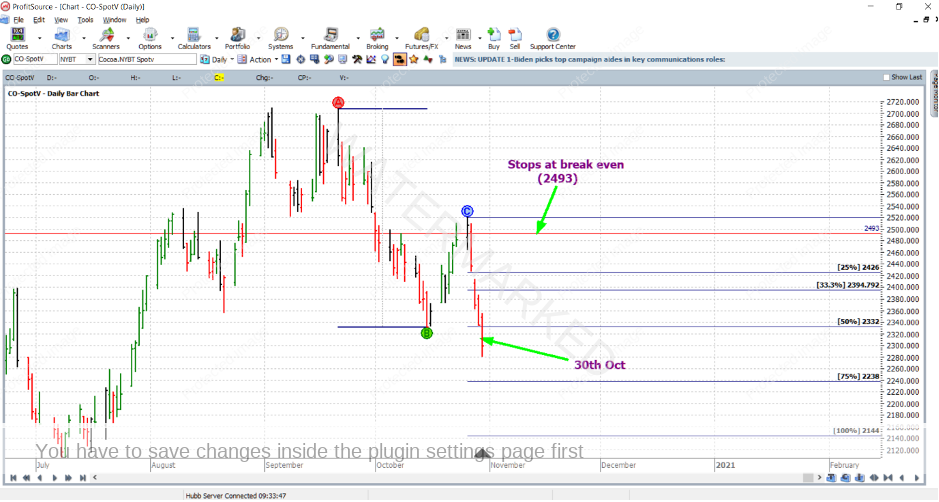
Now that the trade entry has been discussed, we’ll zoom out to the daily bar chart in ProfitSource – with Walk Thru mode up until the 27th of October. As shown below, entry was achieved quite close to the high of the 26th.
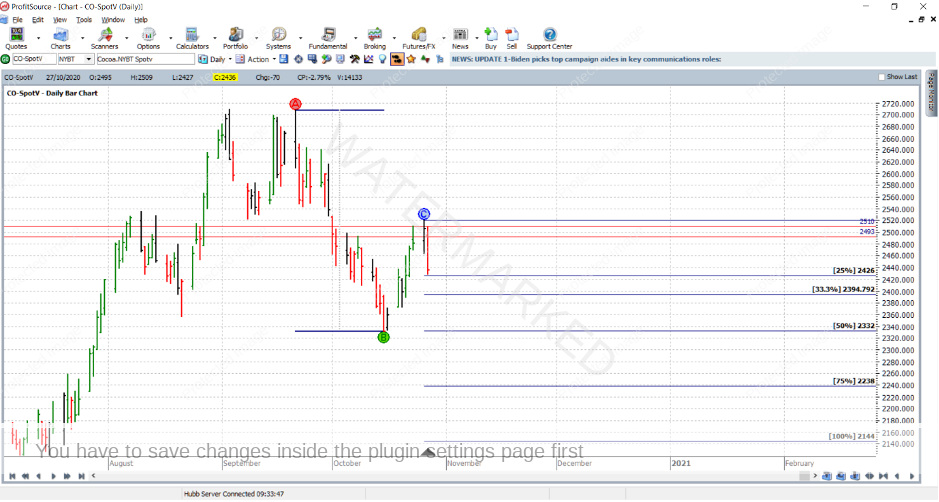
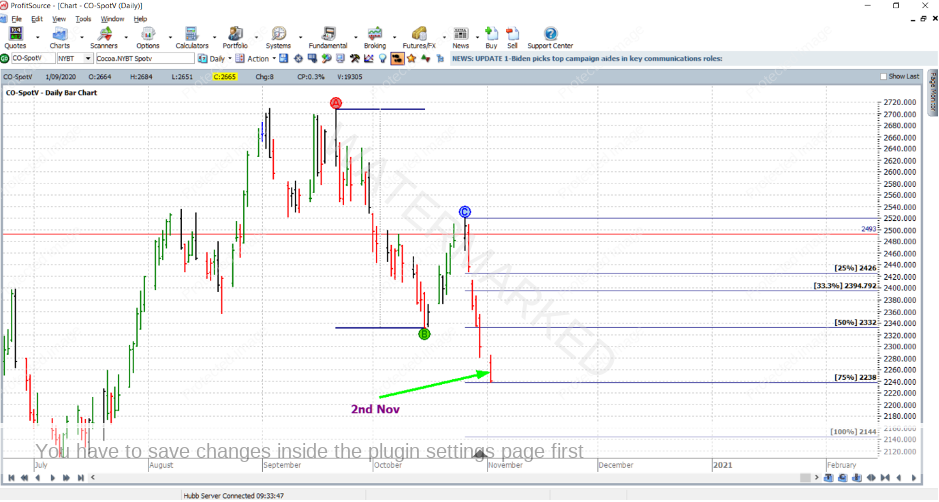
And now to the management of the trade. Let’s simply reuse the Trading Plan from last month’s article. If you recall, this simple plan was based on the weekly swing chart, and aims to take profits at 75% of the last weekly swing in the same direction. It instructs us to move stops to break even after the market reaches the 50% milestone of the same previous weekly swing chart range.
Now using Walk Thru mode in ProfitSource, let’s step forward three trading days to the 30th of October. On this day the market cleanly broke through the 50% milestone, and as it did, exit stops, according to the trading plan would be moved to break even.
Then it only took one more trading day. On the 2nd of November, the market reached the 75% milestone and broke it by a mere point! The trade exit was at 2238.
Now for some calculations on the returns that could have been made on such a trade. There are a few ways to do this. First of all, in terms of the reward to risk ratio:
The initial risk: 2510 – 2493 = 17 points
The final reward: 2493 – 2238 = 255 points
And therefore, the reward to risk ratio was 255/17 = 15 to 1.
Next, we can observe our reward in absolute dollar terms, and there are a few pieces of information that we need for this. Cocoa futures are traded through the ICE Exchange. If you go to the contract specifications on their website, you will find that each point of price movement changes the value of one Cocoa futures contract by $US10. So, the dollar risk (USD) and dollar reward (USD) for each contract of the trade were:
Risk = $10 x 17 = $170
Reward = $10 x 255 = $2,550
Now let’s say that you had a $10,000USD account, and were prepared to trade 2 contracts. The risk in USD would be $170 x 2 = $340 or 3.4% of the account (less than the risk for a standard end of day chart entry at 5% risk). So with two contracts traded, the reward would in USD would be:
2 x $2,550 = $5,100
And then, given the Australian Dollar – USD exchange rate at the time of taking profits, your final reward in AUD would approximately be $7,255.
Finally, let’s determine the reward in terms of a percentage gain in account size. With a risk of 3.4% of account size at trade entry, the percentage gain on account size after the trade was closed would be calculated as follows:
Reward to risk ratio x % risk = 15 x 3.4% = 51%
Work hard, work smart.
Andrew Baraniak
