Coffee’s Back!
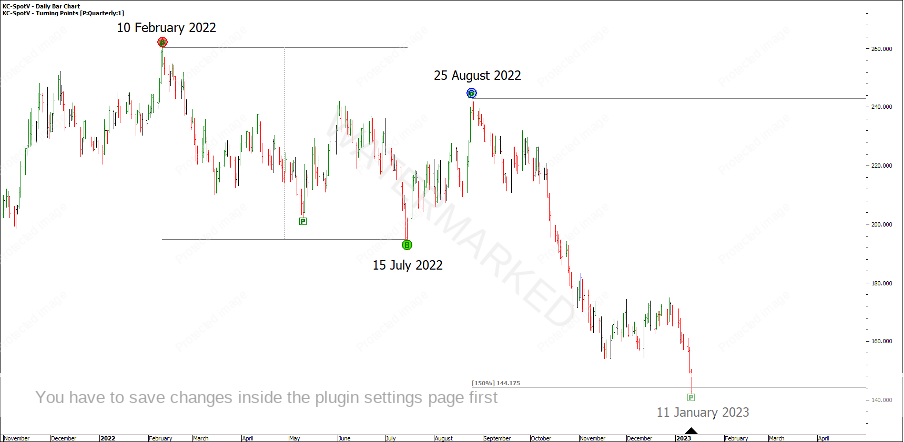
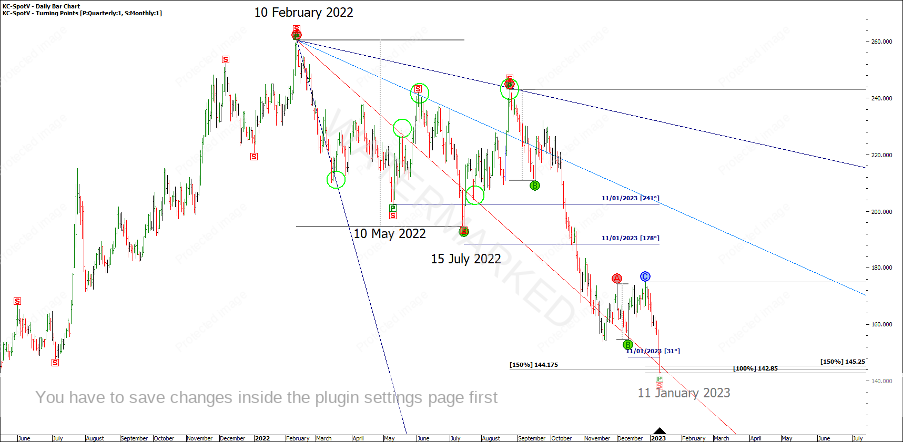
To kick off 2023 I’ll explore a recent setup on Coffee. David tells us that “it is from yearly or seasonal ranges that you get the ability to call the big moves”, and this is another great example of that. Using the Quarterly ABC milestones, the 150% level gives a price target of $144.17. This is shown in Chart 1 below.
Chart 1: Quarterly ABC Milestones
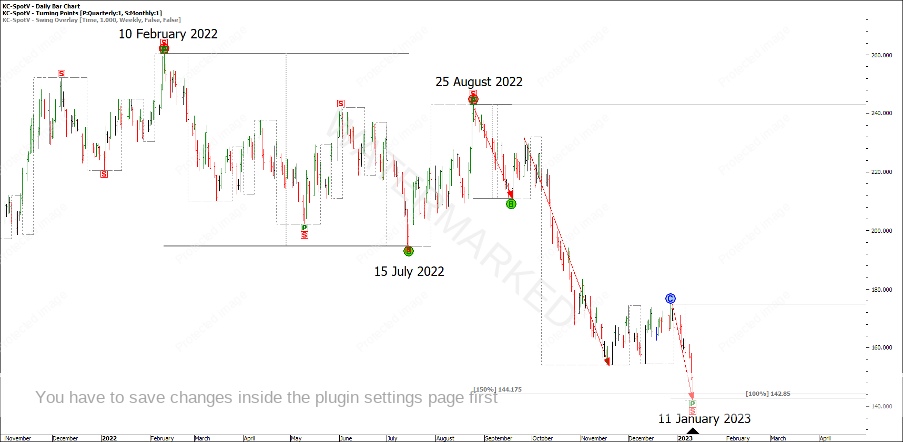
Adding on the monthly turning points and the weekly swing overlay, this last monthly swing down showed us a good example of Sections of the Market and why it is so important to watch for it, with three weekly swings and the First Range Out repeating 100% from the weekly section 2 top at $142.85.
Chart 2: Monthly Swing Sections of the Market
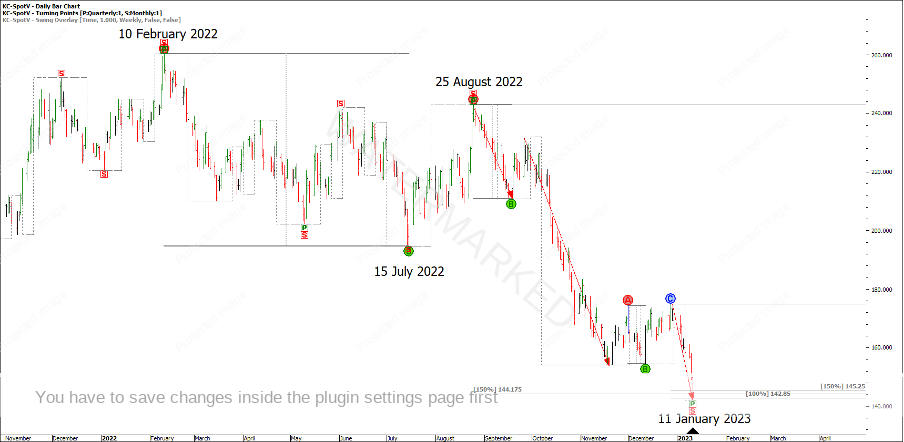
Looking for a third part to the cluster, the last weekly swing repeated 150% into the low at $145.25.
Chart 3: Weekly Swing Range Milestones
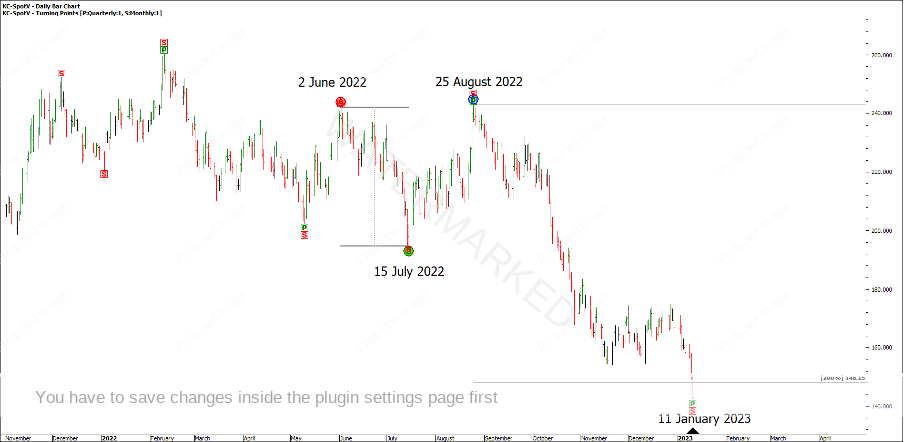
How else could you know the monthly swing chart was coming to an end? The 200% milestone of the monthly Double Tops was $148.15.
Chart 4: Monthly Double Tops
A price cluster alone doesn’t make it a Classic Gann Setup, although you don’t have to look too far to see Time by Degrees and Squaring Time and Price working in action.
Using a point size of 0.5 instead of the default of 0.05, trading day angles have been very useful in calling some major turning points.
Chart 5: A Classic Gann Setup
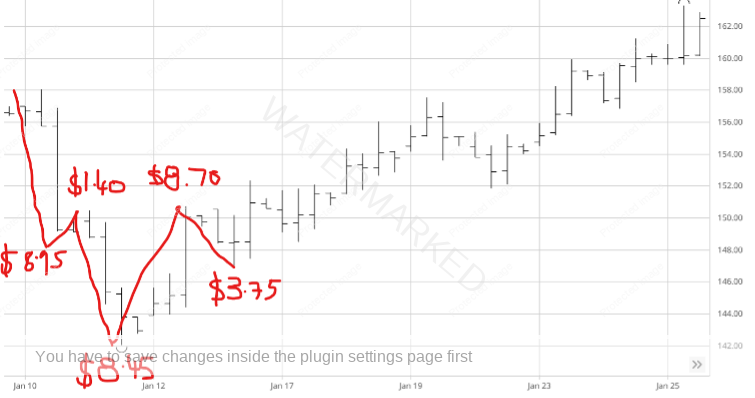
With a quality setup identified, how could anyone have gained entry into the market? There was no contracting daily swing range into the low and the size of the daily bar on the 11th was a range of $8.45!
We can drop down to the 4-hour swing chart for a smaller risk which gives the potential for a larger return. In Chart 6 below, you can see on the 4-hour bar chart, there was a nice contracting 4 hour swing range of $8.45 into the low. A large Overbalance in Price of $8.70, then a pull back of $3.75 that held above the 50% retracement.
Chart 6: 4-Hour Bar chart.
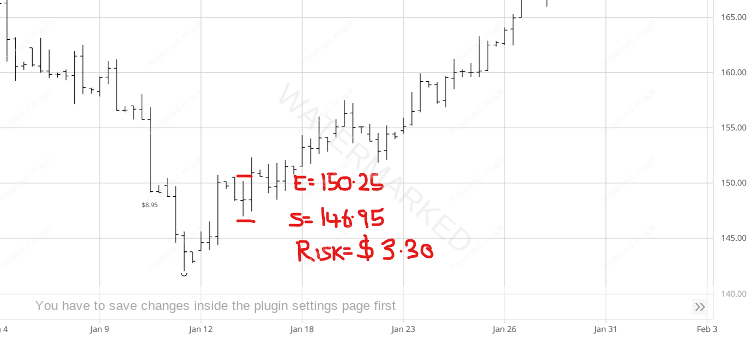
You could look to enter at the extreme low, or on a 4 hour first higher swing bottom.
Chart 7: 4-Hour First Higher Swing Bottom.
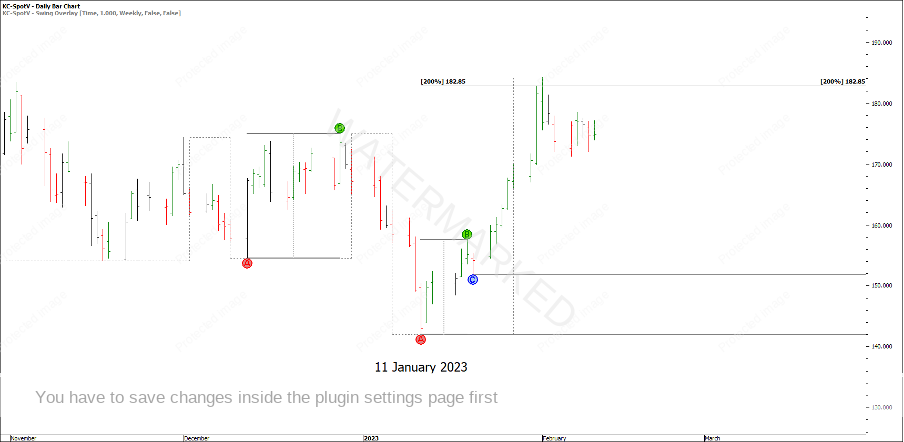
Combining the last weekly swing milestones and the daily First Range Out from the 11 January 2023 low gave a price cluster of 182.85. I’m not suggesting that you would have known Coffee was going to get to this level but if you had been using a trailing stop strategy or had identified the cluster after the daily First Higher Swing Bottom had formed, then it was possible to bank some profits at $182.85.
Chart 8: 200% Profit Target
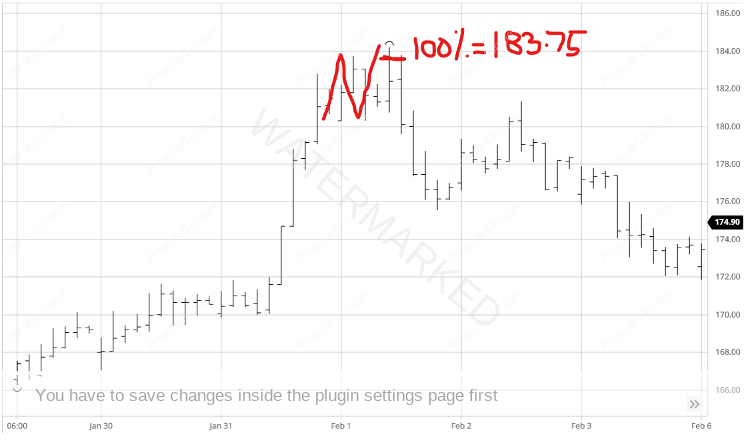
Looking at the intraday charts there was a contracting 4-hour range into 182.85, and the 100% milestone of the 1-hour swing chart gave $183.75 which unfolded as a false break double top on the 1-hour swing chart.
Chart 9: False Break Double Top
A wrap up of the numbers below:
Entry = $150.25
Stop Loss = $146.95
Risk = $3.30
Profit Target = $182.85
Profit = 182.85 – 150.25 = $32.6
Reward to Risk Ratio = 32.6/3.30 = 9.8:1 RRR
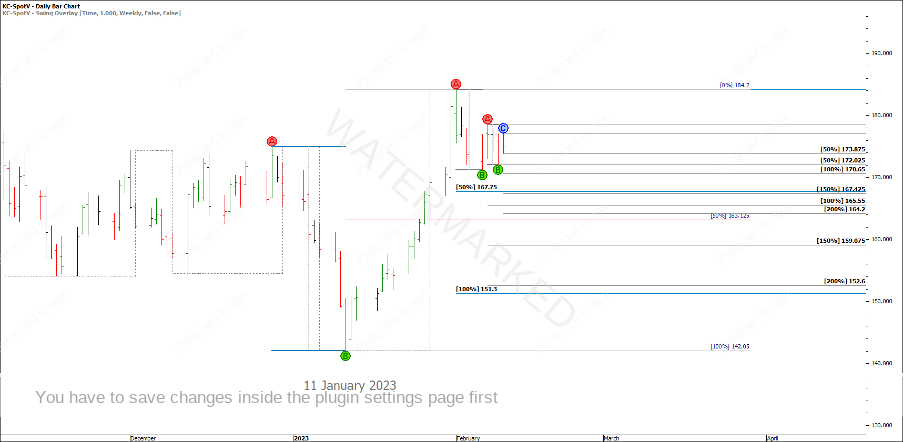
The weekly swing chart has yet to turn down, but we can watch the relevant milestones for potential cluster areas so if a nice clear cluster presents, we can be in a position to take advantage of it.
Chart 10: Major Milestones
I wish everyone the best for their trading goals in 2023 and may this be your most productive and profitable year yet.
Happy Trading,
Gus Hingeley
