Consistency
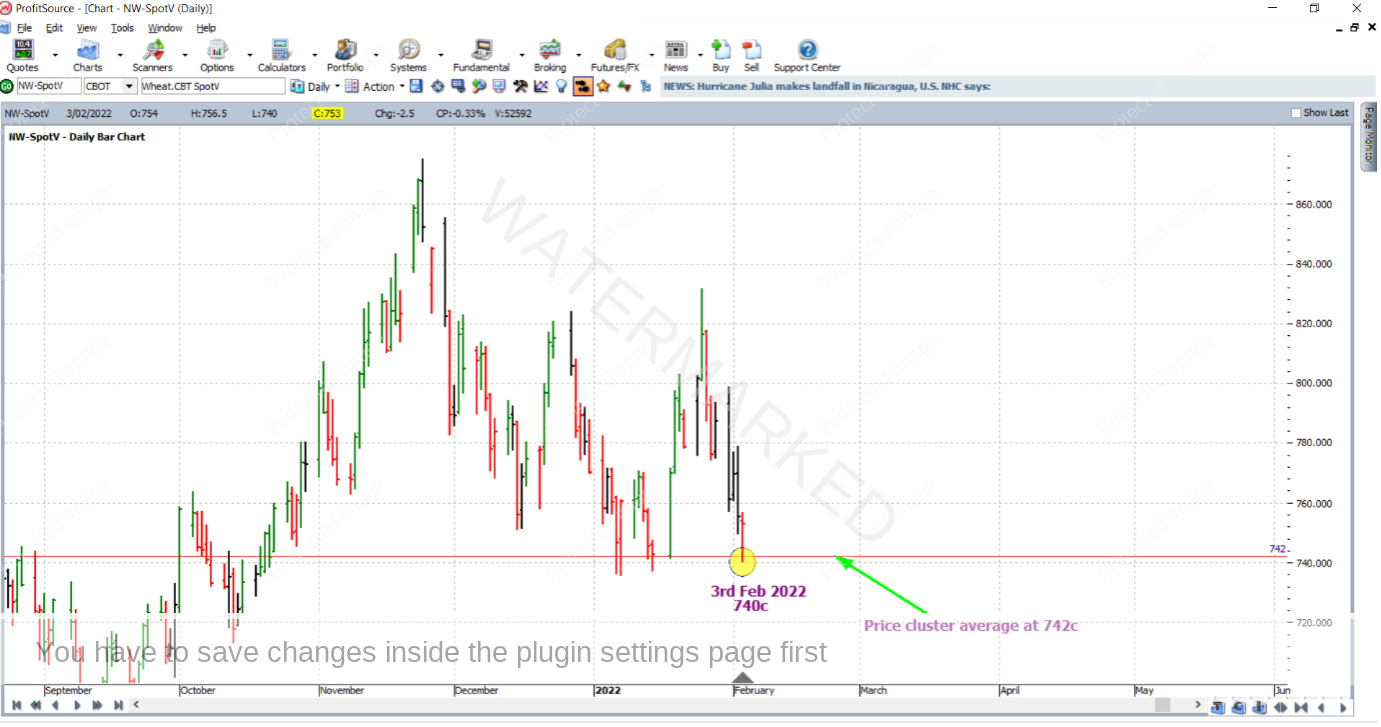
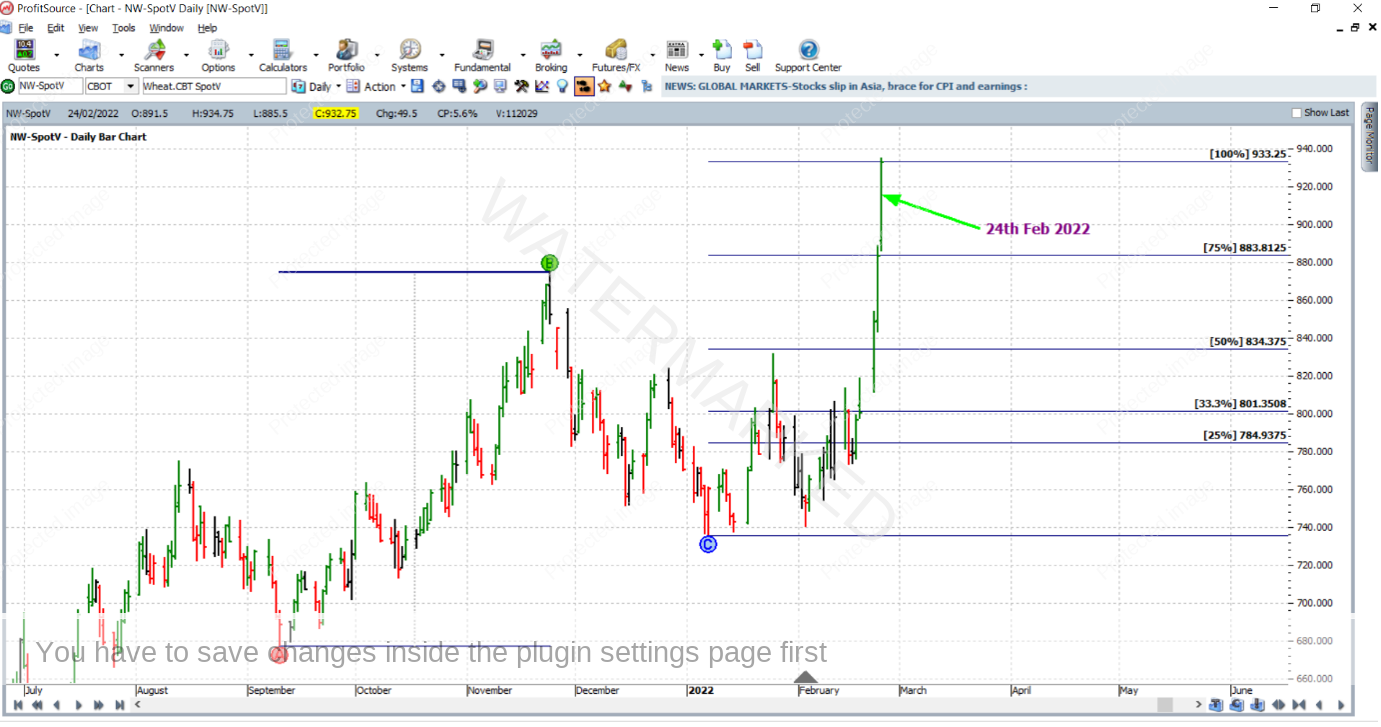
So now to the Wheat futures market where a trade setup had presented itself to Safety in the Market traders in early February of this year. In the said market, three solid price analysis reasons had clustered at an average of 742 cents per bushel and the market was moving down towards this level. Have a go at reproducing the price cluster. It’s a very close match to one of the main types of set ups taught in our Active Trader Program coaching. 3 February 2022 came, and the market reached this level and a reversal back to the upside was anticipated. The market lowed at 740 cents, only breaking the cluster’s average by 2 cents, a relatively small error in relation to the size of an average daily bar in this market. See the ProfitSource chart below in Walk Thru mode, symbol NW-SpotV.
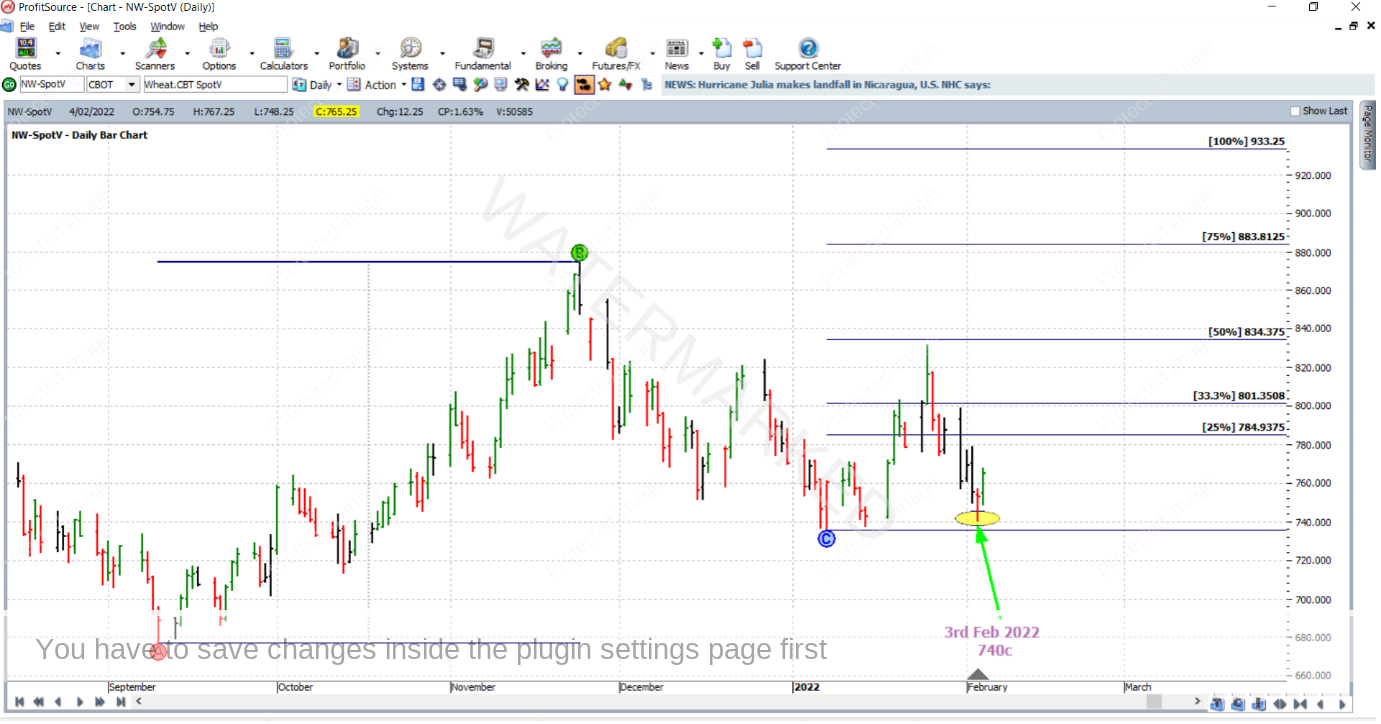
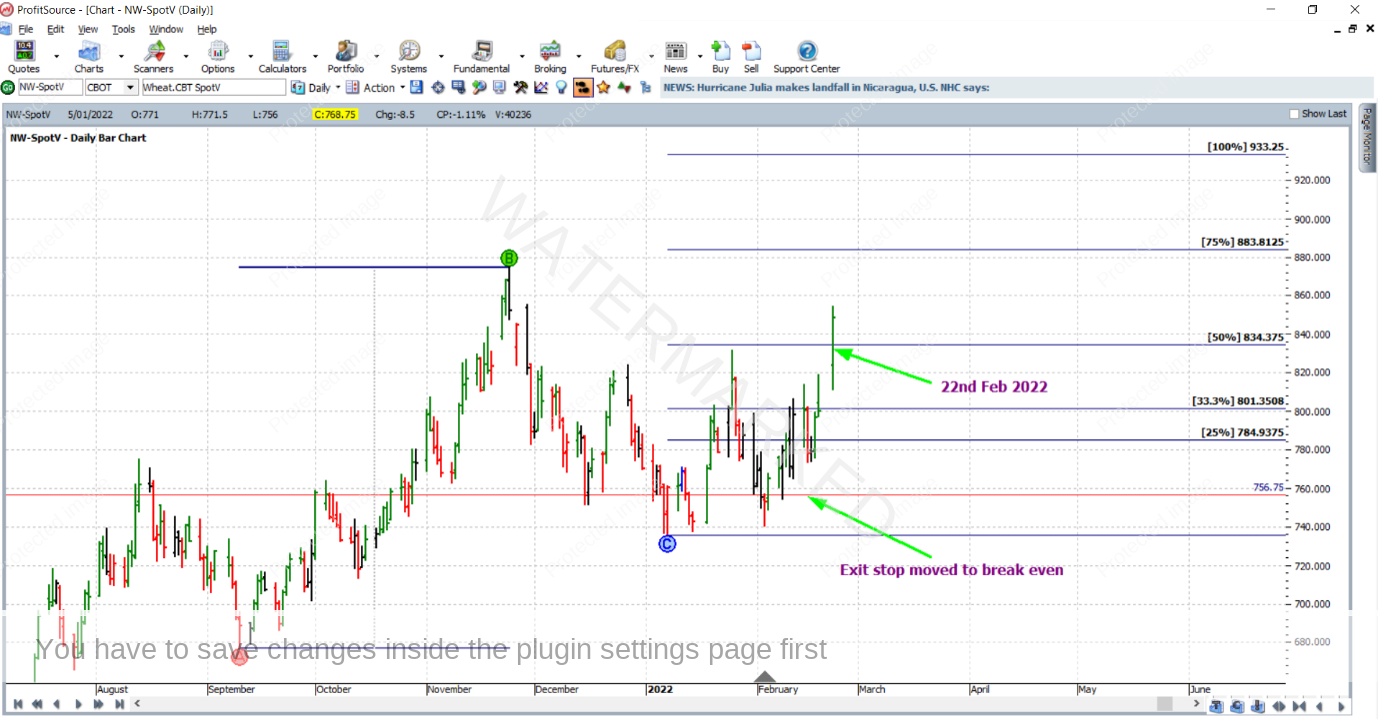
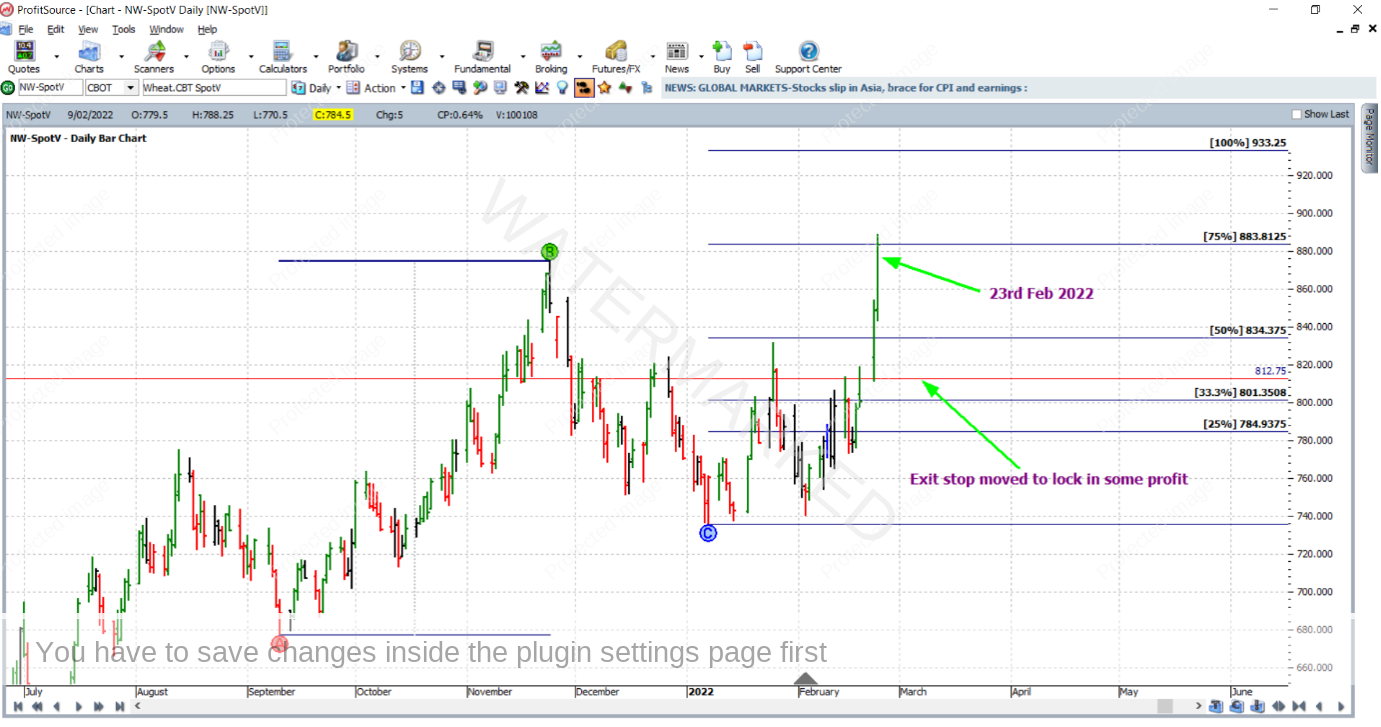
As for trade management, the A to B reference range chosen was the monthly upswing from the 10 September 2021 low to the 24 November 2021 high, with Point C being placed on the low of 7 January 2022. Stops will be managed currency style. See below.
Now for the analysis of the rewards.
In terms of the Reward to Risk Ratio:
Initial Risk: 756.75 – 739.75 = 17.00 = 68 points (point size is 0.25)
Reward: 933.25 – 756.75 = 176.50 = 706 points
Reward to Risk Ratio: 706/68 = approximately 10 to 1
According to the contract specifications for Wheat futures on the CME Group website, each point of price movement changes the value of one contract by $12.50USD. So in absolute USD terms the risk and reward for each contract of the trade was determined as:
Risk = $12.50 x 68 = $850
Reward = $12.50 x 706 = $8,825
In AUD terms at the time of taking profit that reward was approximately $12,257
Risking 5% of the account size for this trade, the resulting percentage change to the account size after taking profits would be:
10 x 5% = 50%
Many brokers will offer access to this strongly trending market via a CFD, where much smaller position sizes are available.
Work Hard, work smart.
Andrew Baraniak
