Cotton – Major Low
Welcome everyone to the New Year. After a break for many, it’s now a good time to start up fresh and hit the ground running in 2021. Due to the popularity of the last few articles, this month’s article continues with the same theme – high probability trade setups. This time we look back on a trade in the Cotton futures market. The trade entry came just after the major low in April of 2020.
The instrument initially used was the May 2020 Cotton futures contract. As you will find out, this is a longer-term trade. The actual trade, at the time of writing, is still open by means of the March 2021 contract. So since the trade entry, contract “rollover” has been required a few times. This will be detailed more at the end of the article. And the current exit stop for this trade, if filled, would have this trade closed for a very good reward.
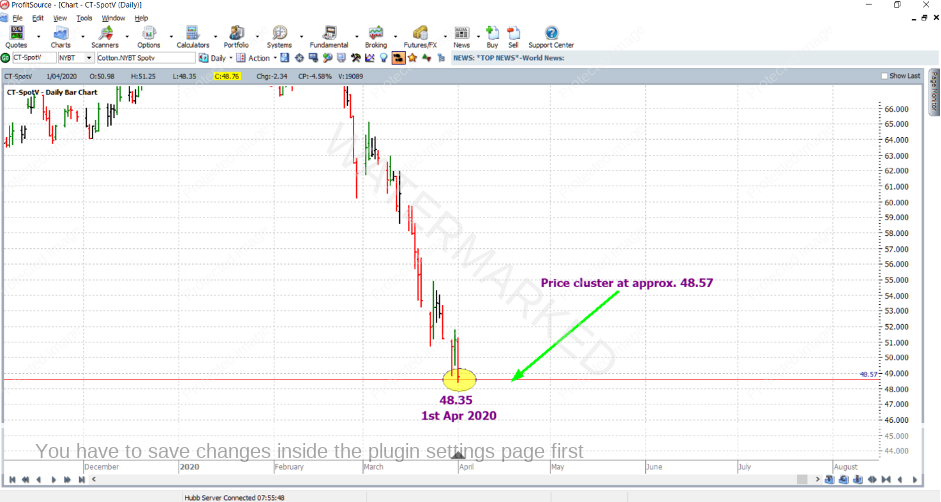
On the 1st of April 2020, the Cotton futures market put in a major low at a price of 48.35 cents per pound. Have a look at the chart below (code CT-SpotV in ProfitSource) – it was a nice low! In hindsight obviously, this was a great place to buy and hold a longer-term position, but of course, the question is, what were the reasons for buying at the time?
As usual, for technical Starter Pack traders like ourselves, the answer comes from technical analysis. And that part is your homework. Can you clearly state three solid price reasons which could have helped call this low in advance? To help you get started, here are a few clues:
- Apply a Highs Resistance Card to a recent major high
- Apply the ABC Pressure Points tool on the monthly chart
- Use the concept of First Range Out (FRO) – Point A of this FRO being the 2018 top (your job is to figure out where to place Points B and C).
The analysis is based only on the CT-SpotV chart, and the average of the price cluster, using the three hints above was approximately 48.57 cents per pound.
The ProfitSource chart below uses Walk Thru mode. Having zoomed in a little you can see that the market was trending down strongly into the price cluster’s average price (red line) and it arrived there, as mentioned on the 1st of April 2020. The actual low, being 48.35, was only 22 points past the cluster’s average at 48.57 – a rather small and hence very tolerable error in relation to the average size of a daily bar.
So with your analysis done, in anticipation of a reversal in the market, you’d be considering how to enter a trade. Unlike the last two monthly articles, this time we’ll avoid the intraday chart, and consider a less aggressive approach – using the daily (end of day) chart. There are a few alternatives here, and the one we will consider is known as an Outside Continuation Pattern entry. Its background is detailed in the Number One Trading Plan, under the Advanced ABC Entries section. The next few paragraphs are quite detailed, if not a little complex – so make sure you revise that section of the Number One Trading Plan, should you feel the need.
Here goes….
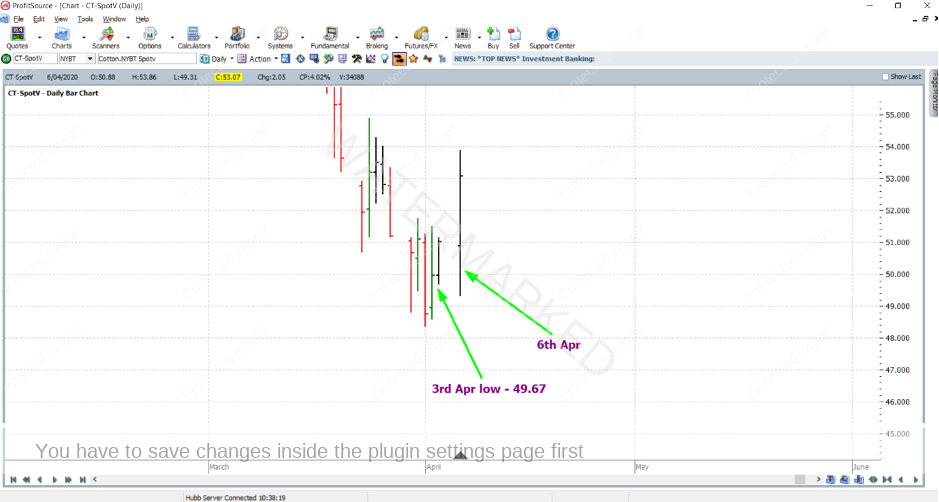
As you will notice below, on the 6th of April, the market gave a large outside daily bar which ended with quite a strong move to the upside, well and truly in favour of the bulls. But specifically, how could we have used this trading day to enter the market?
Earlier in the trading session of the 6th, the market broke the low of the 3rd. Ideally, you will have known this at the time by using a price alert at 49.66 – 1 point below the low of the 3rd, or you will have checked the market yourself early in the trading session of the 6th.
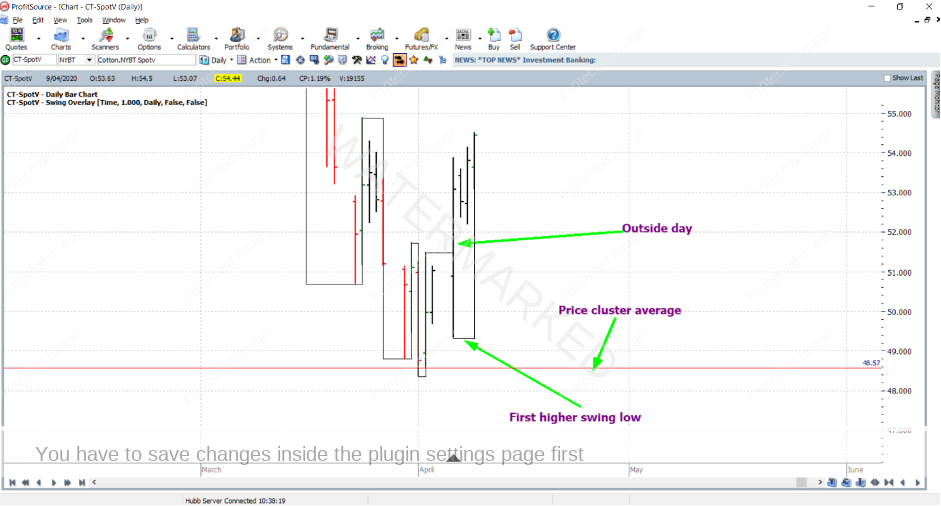
Now, of course, we know that the breaking of highs and lows on a bar chart will put highs and lows in the swing chart. Therefore, the breaking of the low of the 3rd straight away meant that later there was the potential for a higher swing low in the market (higher than the swing low of the 1st which had already been confirmed).
So what was next? Later in the trading session of the 6th – say half-way through it, you’d again check the market. And if the market by that point had begun to rally back up, you’d have an entry stop ready to go at 51.15 – 1 point above the high of the 3rd, and an exit stop at 1 point below the low of the 6th at 49.30; obviously the market did rally, triggering this entry at some point during the trading session of the 6th.
It was a rather complex and dynamic entry. And you’d have to be on your game, most importantly before the high of the 3rd was taken out. Again, setting an alert for a price that was a comfortable amount below the high of the 3rd could have helped out here, if not checking the market yourself a few more times during the session.
Yes, you’d be checking the market during the trading session, but remember this is still not considered to be an aggressive intraday chart entry. Order placements were based on updated versions of the daily bar of the 6th as that daily bar evolved. In other words, this type of trade entry still uses the more conservative daily swing chart.
The other thing to note is that this entry was a bit of a hybrid. Technically, Outside Continuation Pattern entries require a few strong up days in a row before we consider them as such, something that lacked from this case study at the point of entry. But with strong enough reasons for a trade, you could overlook this. Or, you could say instead that this entry better fits the category of a First Higher Swing Bottom, also defined in the Number One Trading Plan. Either way, it was worth paying close attention to. The small size of the bar of the 3rd meant that entry was achieved with low risk, and hence more likelihood of a better reward to risk ratio.
Either way, you call it, here is what the swing chart looked like a few days after entry:
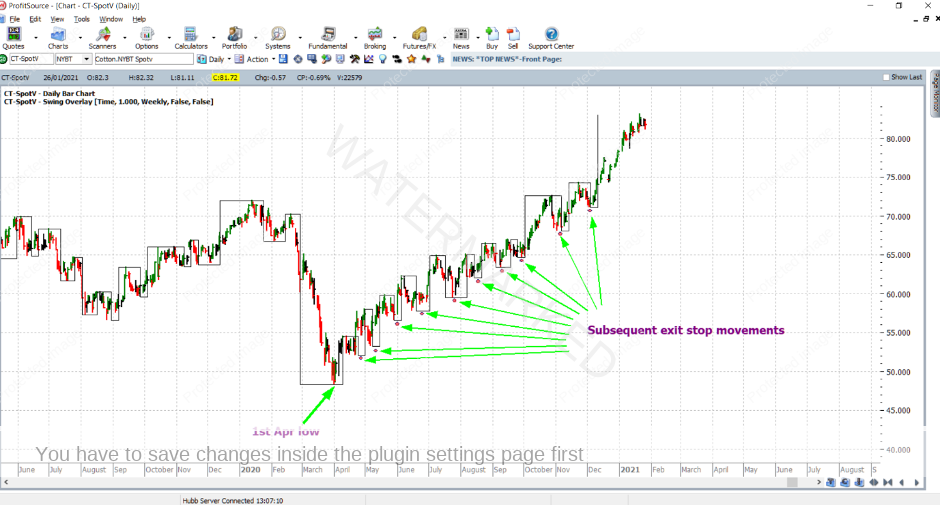
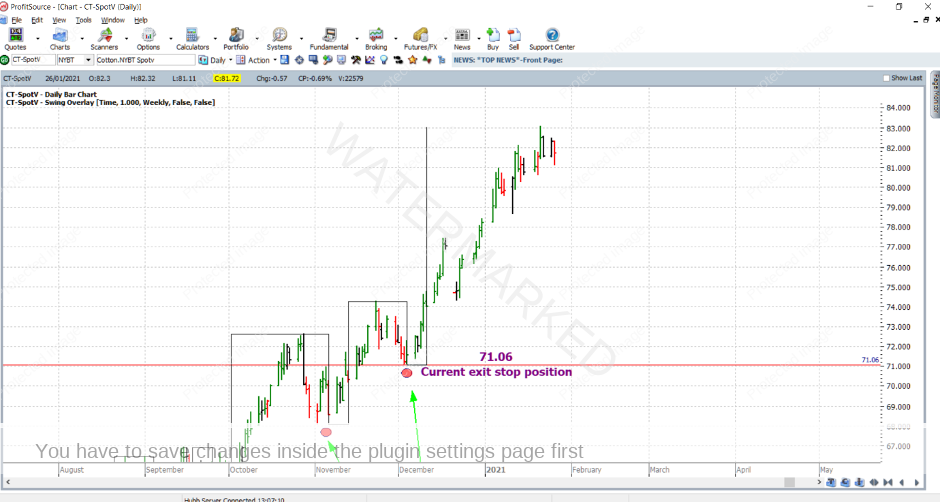
The next thing to consider is the trade management. This time we’ll use the weekly swing chart, and trail the exit stop below each higher weekly swing chart low. As you can see in the ProfitSource chart below, already there have been a number of exit stop movements to the upside, locking in profits as the market has advanced. The weekly swing chart overlay indicator has been applied to the daily bar chart.
And zooming out you can see that even more stop-loss movements have since been made.
In fact at the time of writing, this trade is still open with the current exit stop sitting at a price of 71.06;
With the most recent weekly upswing being so generous, there is a lot of profit on the table not yet locked in. But at this stage, some reward calculations will still be very interesting, even if we base those calculations on an exit as far back as the most recent exit stop price at 71.06;
In terms of the reward to risk ratio:
The initial risk: 51.15 – 49.30 = 1.85 = 185 points
Theoretical* reward: 71.06 – 51.15 = 19.91 = 1,991 points
And therefore the current (theoretical*) reward to risk ratio = 1991/185 = 10.76
(* Theoretical because the trade is still open at the time of writing and an exit price has not yet been secured/confirmed).
In absolute dollar terms:
Cotton futures are traded through the ICE Exchange. The contract specs on their website tell us that each point of price movement changes the value of one Cotton futures contract by US$5.00. So, the dollar risk (USD) and current theoretical dollar reward (USD) for each contract of the trade was/is:
Risk = $5 x 185 = $925
Reward = $5 x 1991 = $9,955
So, with an account worth US$20,000, trading one contract would have you within the standard money management rule of risking no more than 5% of your account on the trade. And given the AUD – USD exchange rate at the time of writing the current reward in theory in AUD is approximately $12,857.
Finally, let’s determine the current theoretical reward in terms of a percentage gain in account size. Trading one contract, the percentage gain if the trade were closed at the current stop-loss position would be calculated as follows:
$9,955/$10,000 = 99.55%
As mentioned, this trade is still open because the last weekly swing low has yet to be broken. As another exercise, keep an eye on this trade until it is stopped out, and re-do the above calculations.
One final note – while in this trade, your position will have rolled from the May 2020 contract to the July 2020 contract, to the December 2020 contract to where it currently sits in the March 2021 contract. So already there will have been a number of times that you asked your broker to sell out your position in one contract, immediately buying into the next contract trading with the most volume.
All the best for another volatile year!
Work hard, work smart.
Andrew Baraniak

