Oil Update
I hope this month’s newsletter for Platinum students finds you well, and in Australia at least, the attempt to get back to normal has begun. COVID-19 is still a massive part of the landscape we all now operate in, be that family, work, or markets. I do reflect that trading has been for many years now a COVID safe business as we can effectively trade from anywhere and all we require is knowledge, a trading plan, some charting paper (or a computer) and communications in the form of phone and internet. I like the fact there is no need for social distancing with your charts and home study material, but on a serious note, I have caught up virtually with some trading buddies, some of who are Safety students, and now is a time for running a test on your emotional intelligence and capacity.
We cannot always be “in the zone” as traders therefore the last 10 weeks may have represented a flat spot in your trading. If so, take stock and design the next stages of your trading landscape to reflect the best environment to operate in. Traditionally the middle months of the year represent a lower volume of trades for me when I look at the standard distribution of trades over a long period of time. This could be that the markets I like to follow do not throw up the best setups in the middle of the year, or maybe it’s my own personal cycle whereby I see a reduction of trades due to my own landscape. My challenge for you is to go over your trading history and outline the timeline of your trades and see which part of the year they land in. The next step is to look for patterns (dare I say review your own history and see if it repeats?). Take a look at the distribution of wins/losses and periods of over and under trading. Knowing yourself is half the battle sometimes in trading.
Onto the markets and we continue to see equity markets recover post the drops into March this year. My old mate Oil is also climbing on after the debacle of negatives prices per barrel. Now that that situation has occurred (inverted price scale) we must factor that into the future, but I am seeing that as a reoccurrence as a smaller probability, especially after we saw the June contract rollover period unfold without too much instability.
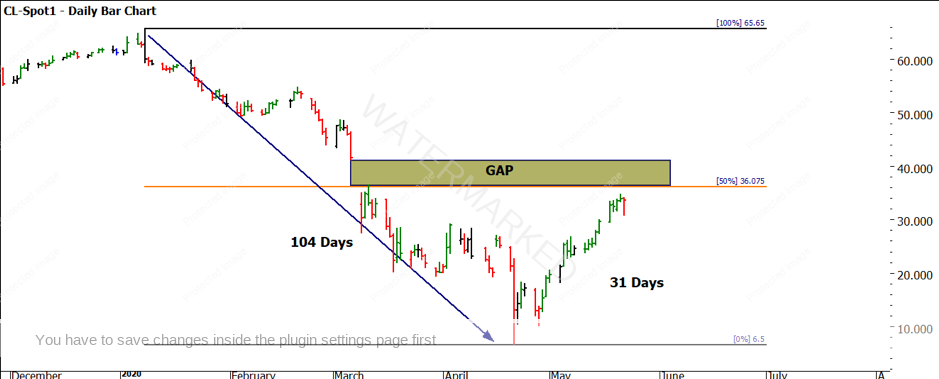
Chart 1 shows the trading period in 2020, the run down from 8 January to 21 April was 104 days (2 x 52) and the run back up has run 31 days (so far) with the 50% level at $36.08 looming large.
Chart 1 – Daily Bar Chart Crude Oil
It would pay to look at the horizontal line that $36.08 forms on the chart and the areas of tops and bottoms that clump in that general area. Like all 50% milestones small and big picture we can factor them into our view on support or in this case the potential for resistance. I also note the area just above the 50% level where a gap formed on the continuous chart. As we do not see gaps on Oil that often, it could be one we respect in terms of potential resistance.
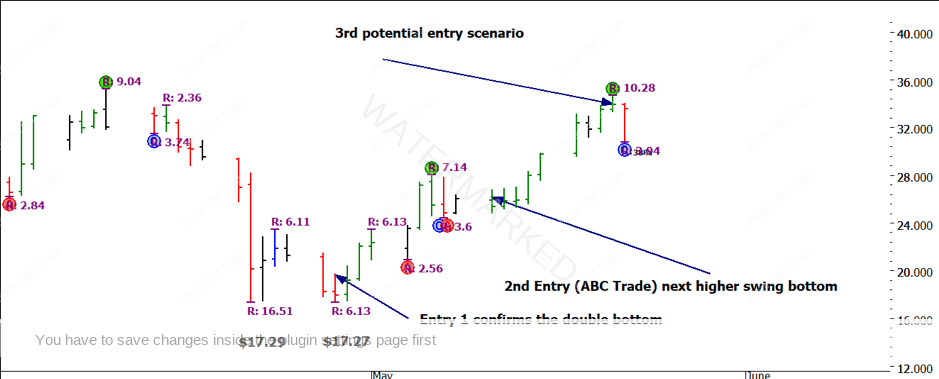
Form reading the continuous chart we can see a comfortable higher swing bottom entry in late April as one that sticks out as a nice place to enter long. The detail here though can be different as we focus on the actual contract month. You might have considered buying this using either the June or July contract.
After the concerns with the April contract trading sub-zero those traders wishing to be long may have been comfortable with the July contract and it was kind in producing a double bottom to assist us confirming a low was in place. There were a number of scenarios that could be applied to entry, Chart 2 shows an aggressive entry on the confirmation of the double bottom. The second entry was a higher bottom and a standard ABC trade (with an inside bar after Point C). As I write, there is a possibility for a 3rd entry with the Point C bar very strong. We should consider the upside resistance in Chart 1 and the potential for a reversal. In a case like this, a stop and reverse strategy may be a technique to investigate.
Chart 2 – Daily Bar Chart Crude Oil
Around the low in April there were some swing ranges that were of some assistance and repeating, some swing trading mastery focus around this period would be a worthwhile study, I’d suggest that you use the Walk-Thru mode in ProfitSource to conduct this study. For the Master Forecasting Course students, you can explore these swing ranges in relation to the Square of 9.
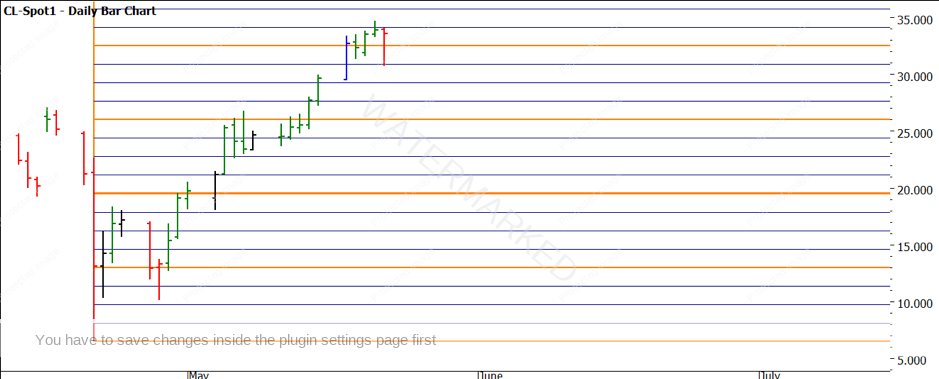
As we discussed in previous articles, the new low that formed in Oil at $6.50 has provided a new number to work with. Chart 3 looks at how multiples of $6.50 have reacted with the price action, it’s difficult to place too much stock in this currently and with more data we will be able to understand more around its application. I have included this just out of interest at this stage.
Chart 3 – Daily Bar Chart Crude Oil
Finally, we can review some 3rd dimension studies to understand the current low. The use of angles allows us to combine price and time on the chart and look for areas of support and resistance. Whilst angles can add much, they can also be overused, so the application of anchor points is critical. Focus on big things and you should get big results.
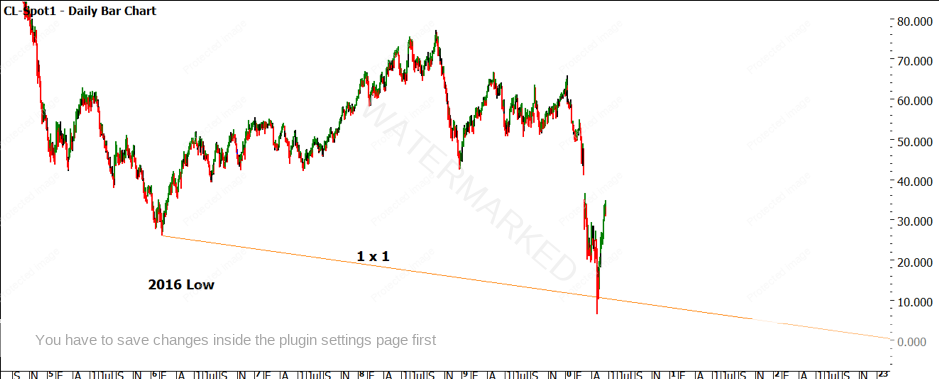
Chart 4 takes in the previous major low back in 2017 and we can see how the 1×1 angle provides some symmetry between the lows.
Chart 4 – Daily Bar Chart Crude Oil
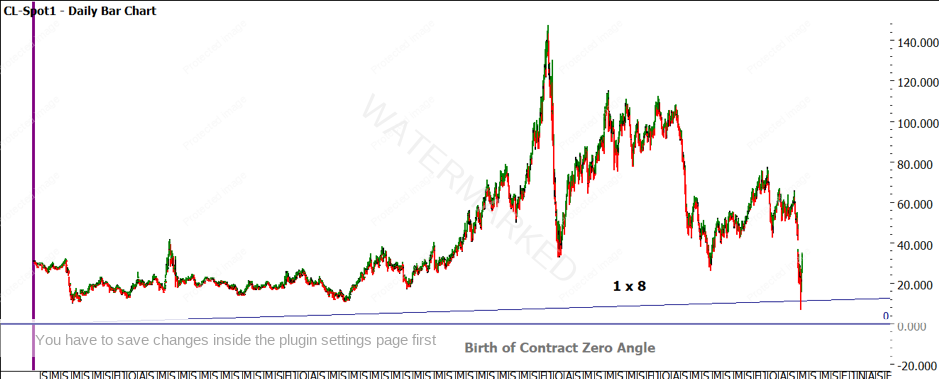
Chart 5 introduces the concept of a zero angle where the price is always zero and we run angles from important dates in history. The final chart uses the birth of the contract as the date for the zero angle and we can see the 1 x 8 angle also tags the current lows. Note this is a trading day angle.
Chart 5 – Daily Bar Chart Crude Oil
There are several other important angles working around the current market that I suggest you study. They are both normal /zero dates angles using both trading and calendar days. Feel free to send your work via Di and I will add some commentary back to anyone who sends through their work.
Good Trading
Aaron Lynch
