Crude Oil Update
Welcome to 2022 and it’s fair to say we have already started the year with significant market movements, so I trust you have been close to the markets or looking to get stuck in shortly. The landscape we find ourselves in has changed compared to 12 months ago but the links in the current cycle are still all connected. We see that COVID still remains the daily topic and continues to impact markets and economies as the masses and government attempt to navigate the challenges.
The effect of inflationary pressures has started to bite as we discussed last year, the supply chain challenges, and reduced workforce efficiency has meant the threat of interest rates being raised is now very much closer to the “now” than later. This of course means that “hard assets” will be attractive in markets so commodities may have their time in the sun in 2022. That being said there have been solid trading conditions in 2021. The final article from 2021 looked at the potential for some upside in the oil market with the first higher bottom of a potential double bottom in play.
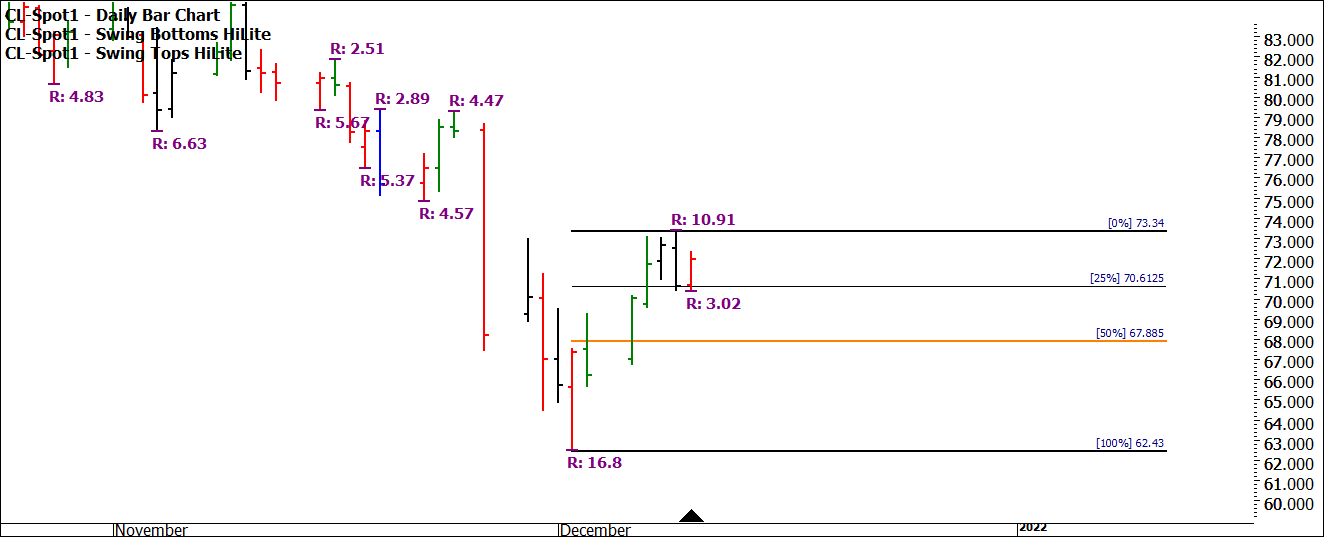
Chart 1 outlines where we left our discussion in 2021, the price action suggested that we had some upside potential, and a higher bottom strategy was one option. The upside ranges were clearly expanding and potentially a little overcooked at this stage.
December is an active month in oil, so it pays to have researched entry systems for historically strong outcomes.
Chart 1 – Daily Bar Chart CL-Spot1
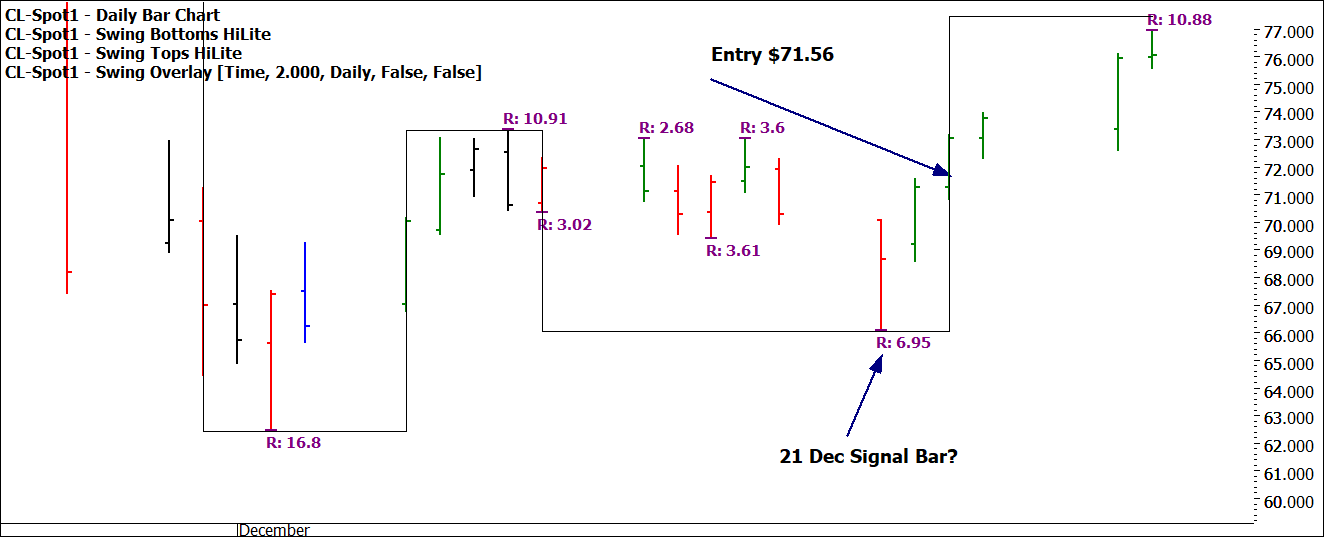
I have discussed the value of a 2-day swing chart entry on crude before and it can provide a filter for entries on this market. Chart 2 shows the setup that did eventuate which was a Point C on the 21st of December (seasonal time) followed by a standard 2-day entry.
Chart 2 – Daily Bar Chart CL-Spot1
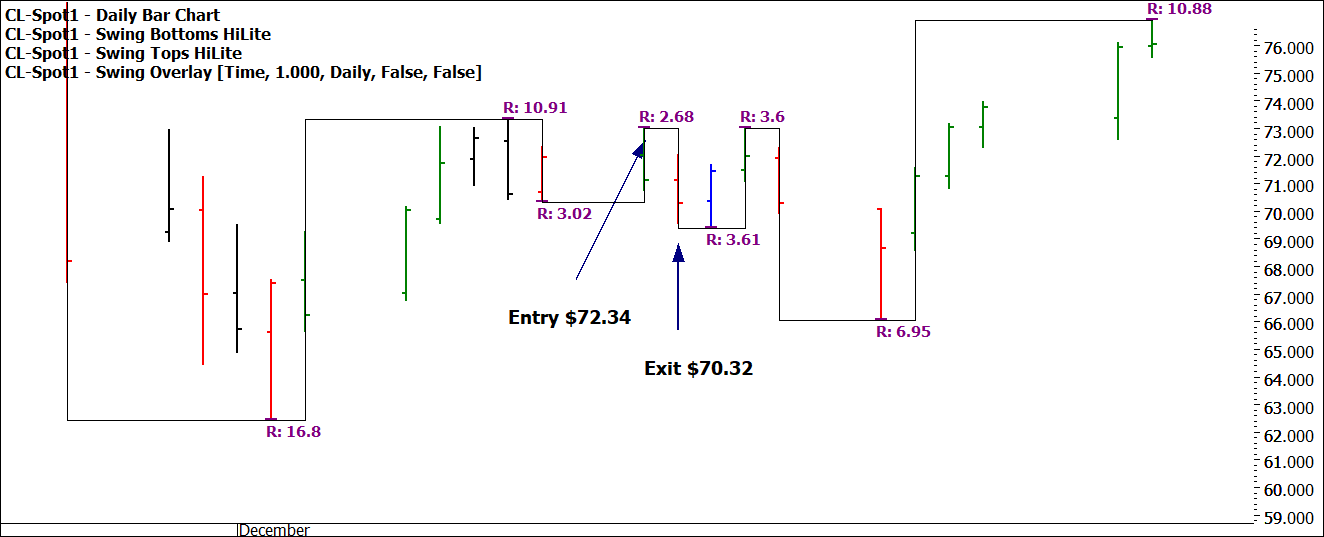
If you were wondering whether the 1-day swing chart entry was valid, I would agree it was. The challenge here as we see in Chart 3 is that the entry was executed and then the bears shook the tree and may have seen you exited the next session. Around strong turning points in markets we can find that the volatility increases which is what we want to occur. If you find yourself in these situations (i.e., an entry that does not allow you to hold a position in what was the correct analysis of the change in trend) you can look to re-enter the market or adjust your initial entry rules, all with an eye on managing the risk of the setup versus your account size.
Chart 3 shows the entry and subsequent exit on using a 1-day swing chart. It’s worthwhile noting that the patience in getting set on the 2- day chart allowed us to enter at a lower price when compared to the 1-day chart.
Chart 3 – Daily Bar Chart CL-Spot1
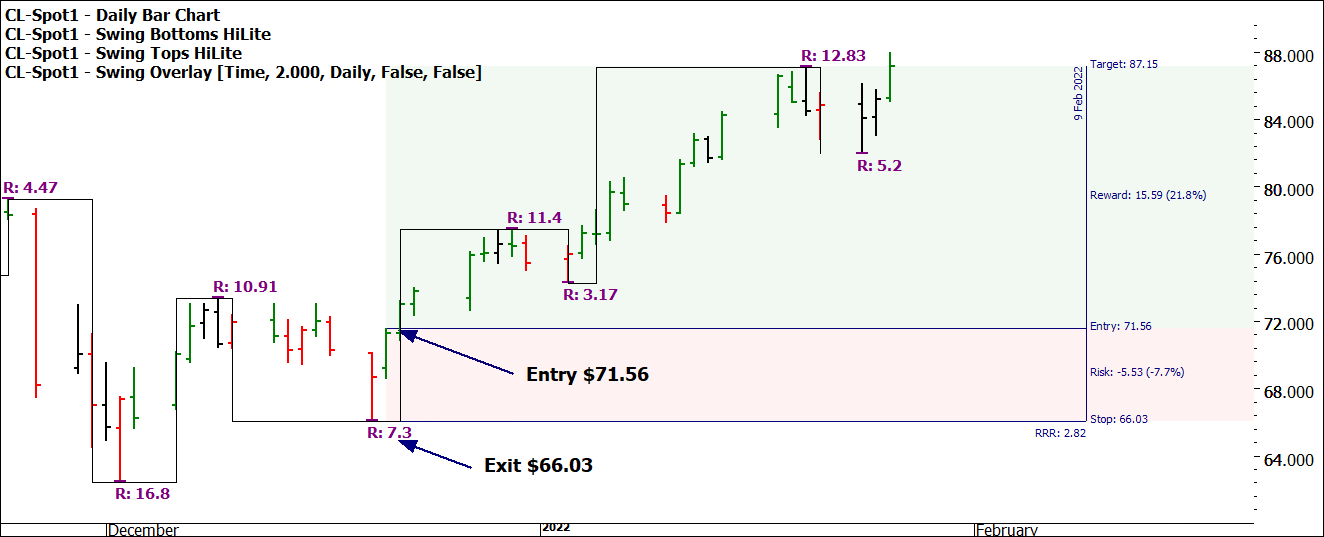
A quick check in Chart 4 shows the current position of Crude Oil and using the 2-day chart as a guide for trend and stops would see you sitting on around a 3 to 1 Reward to Risk Ratio. There are several aspects that could be discussed around improving that Reward to Risk Ratio by managing stops and also adding to positions. These are good exercises once you find yourself identifying and participating in these moves. The motivation of squeezing more profit from a setup is never easier than when the majority of your setups are profitable, and you are looking to optimise. The challenge is always around how much you can choke the trade and still allow it to unfold.
Chart 4 – Daily Bar Chart CL-Spot1
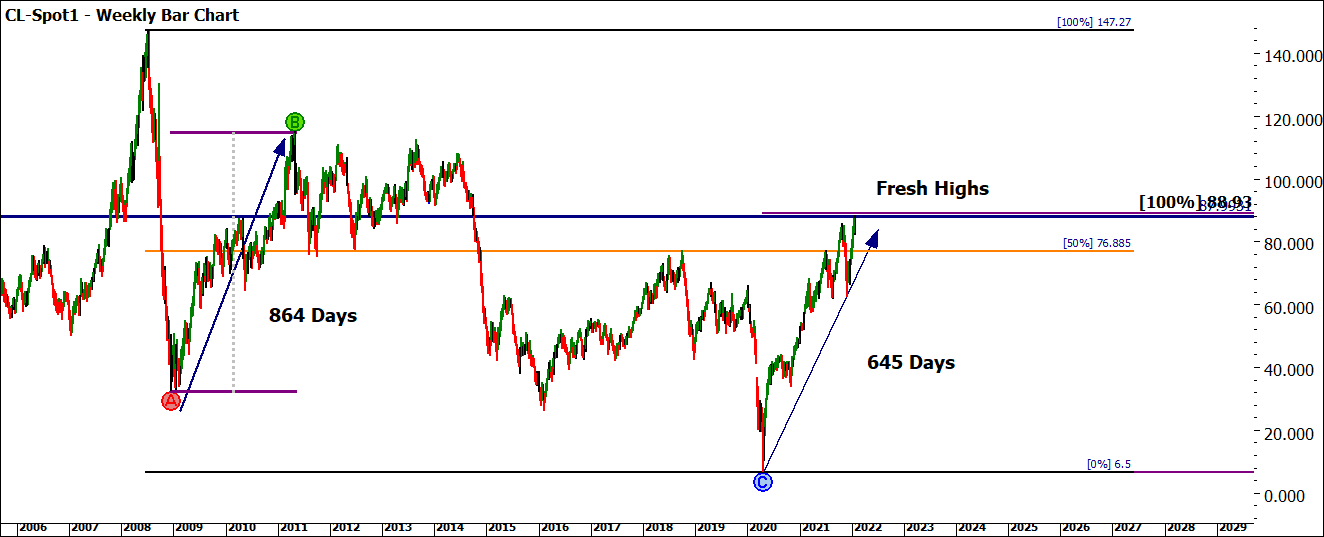
The final chart I will leave you with looks at the much larger picture of this current range against similar ranges. We have made fresh highs for Crude Oil in this recent move taking out the high of 2021 in October. A market making news highs is always a good sign.
The price action sits above the 50% of the All-Time High and All-Time Low of 2008 and 2020 (orange line). This in simple terms if we rate the strength of the trend shows that we are halfway or thereabouts of the major range.
The bullish range from 2008 took 864 days, we have run very close to that price range in 645 days. What can we make of that and how can that assist us to frame this market going forward in 2022?
Chart 5 – Weekly Bar Chart CL-Spot1
As a side note the stock index space as delivered lots of volatility so far in 2022, this year is shaping up as a good one for traders (long or short). Have you set some goals and planned on how you will achieve them? All good trading years start with good planning.
All the best in 2022
Good Trading
Aaron Lynch
