Currency Wars
Welcome to this month’s newsletter, and for at least a small period of time markets have slowed their volatile movements and returned to moves to the upside especially when it comes to equities. This could well be the calm before the storm, as it’s likely the US administration will continue its trade stance with all comers’, allies or not.
As traders we have an abundance of opportunity and it’s worthwhile breaking up markets into different asset classes, as they can behave differently under these conditions. Asset classes are broad categories that our trading instruments can be grouped into. We see stocks being challenged in what is likely a more uncertain future, notably TSLA reported a drop in profits to the magnitude of 71%.
Commodities are an asset class in themselves, and if we focus on them from a purely industrial point of view, if economies slow then demand for materials like iron ore, precious minerals and energies are likely to slump as well.
An asset class that central banks and governments use to smooth out economic gyrations is in the form of currencies. The world predominantly sees currencies move up and down against each other in relative terms and this can cushion economic shocks like tariffs and trade wars. They can also become a proxy for trade wars as countries who are experiencing slow-downs can attempt to devalue their currency to make their goods and services more competitive for consumption. As you can imagine this is a fine ledge to walk as once a currency becomes a proxy for the economy behind it, there is no amount of manipulation or support from central banks that can arrest its movement be it up or down.
This month we will focus on the Aussie Dollar relative to the US dollar and its current position. The Australian Dollar is seen as a commodity-based currency and has similar traits to the Canadian Dollar as the economic basis (especially for exports) is derived from our natural resources. Ensuring we have reliable trading partners and that the global economy is growing are key to the buoyancy of the Aussie dollar.
Chart 1 allows us to review the big picture and establish where we sit. From the lows in 2001 to the peak in 2011 we can see this Ranges Resistance Card is guiding support and resistance areas.
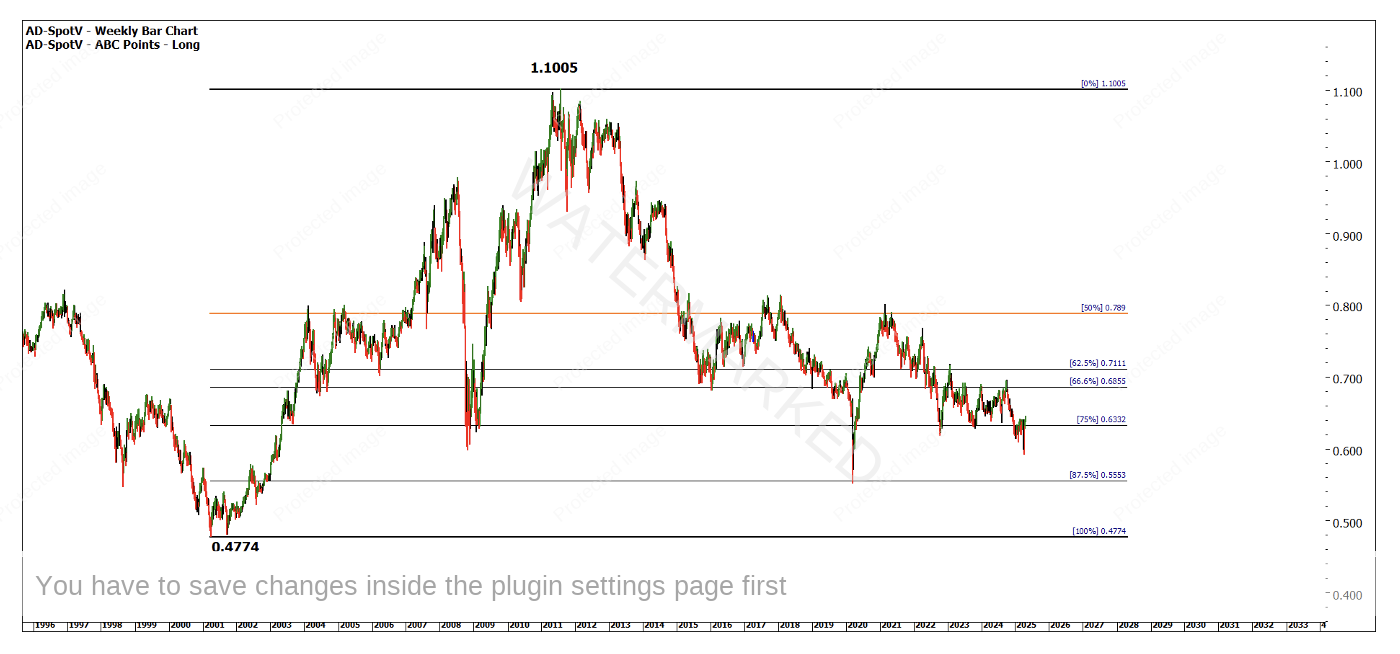
Chart 1 – AD-Spotv Weekly Bar Chart
This big picture perspective can be identified on other time frames, as we see in Chart 2 the smaller amount of data provides us a similar pattern of retracements below the 50%. It’s a good example of Wheels within Wheels.
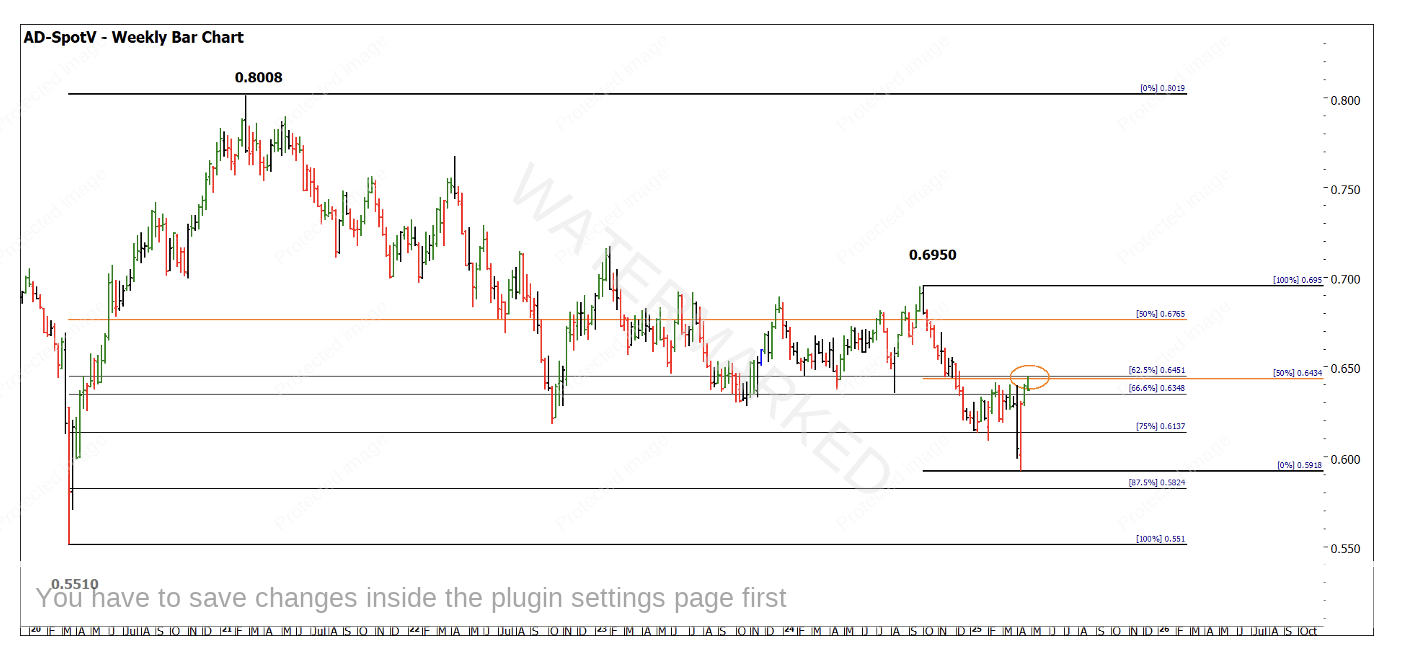
Chart 2 – AD-Spotv Weekly Bar Chart
Chart 3 shows us the recent rebound from the April 9th lows. This would be a good area for those students incorporating time-based analysis to see what harmonies are present to align with price. We know to look for the 50% level in terms of extensions and retracements.
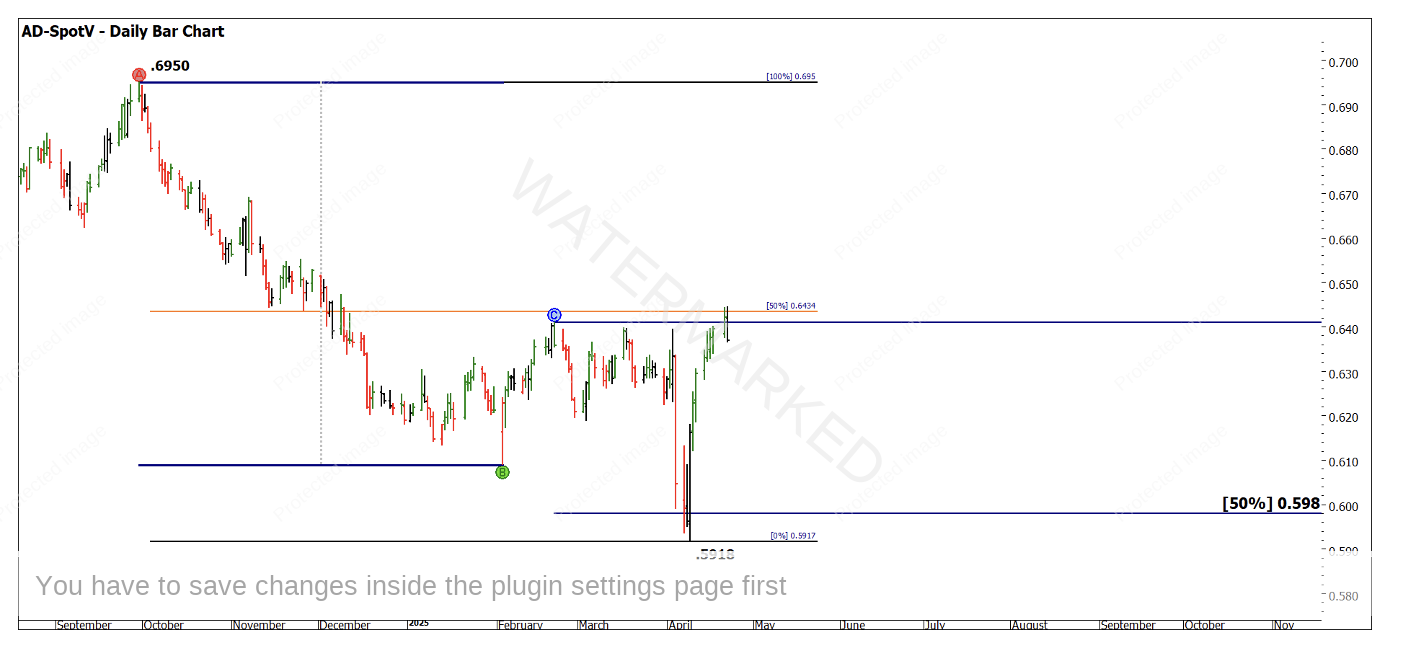
Chart 3 – AD-Spotv Daily Bar Chart
The run up from April was a challenging one to trade, as the entry was likely an advanced one using Number One Trading Plan rules. As I write there has been no higher bottom on a daily swing chart. Its worth noting that David’s 200% rule for double tops/ bottoms has allowed for us to cluster the prices around .5950.
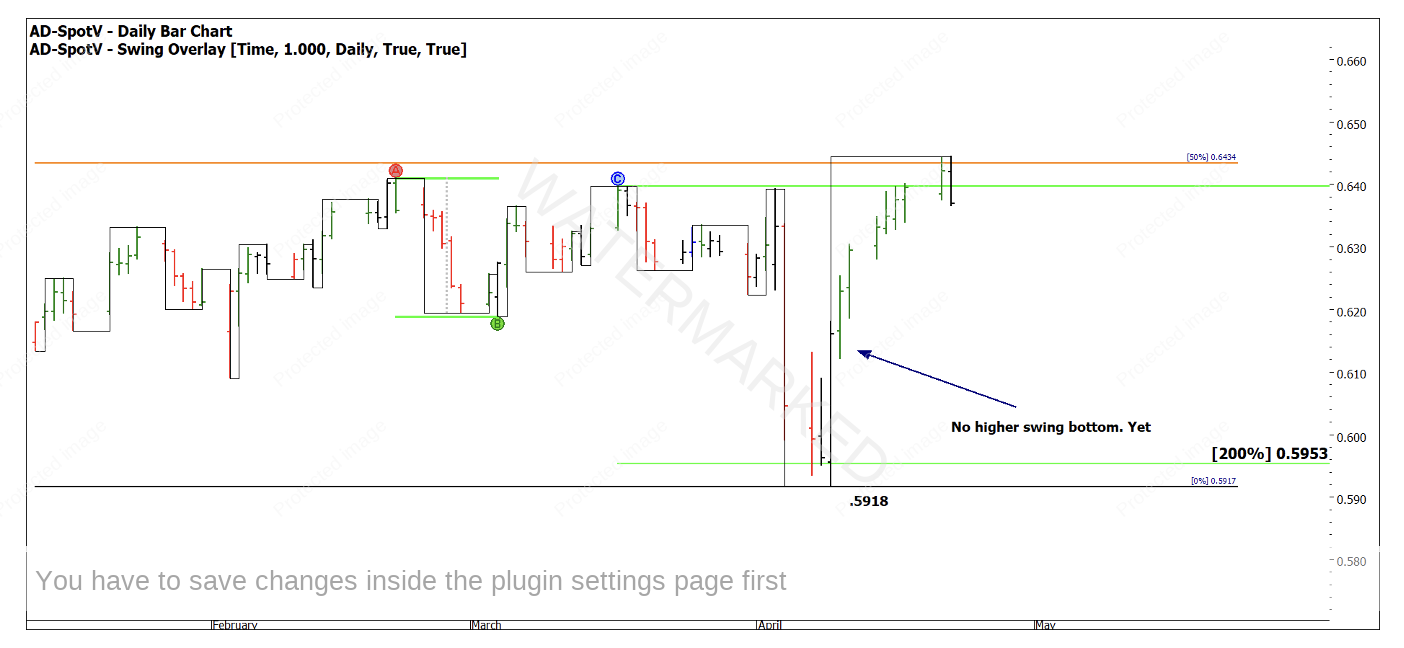
Chart 4 – AD-Spotv Daily Bar Chart
Your homework for this market is to run several other Highs Resistance Cards as you move back across the peaks to the All-Time High of 1.1055. You should see several other turning points that should confirm the benefits of this technique. In Chart 5 below, the 2021 high as a resistance card shows that the April low is approximately 75% of its value.
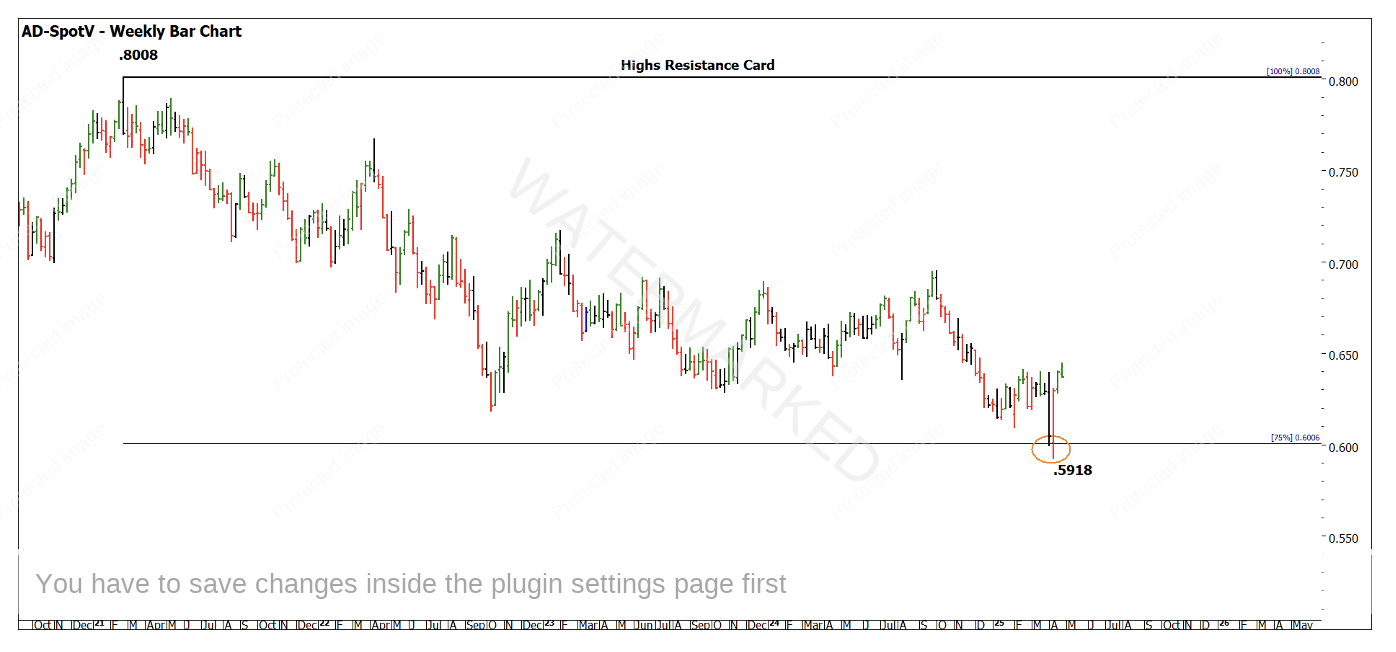
Chart 5 – AD-Spotv Daily Bar Chart
The final chart is a Lows Resistance Card, and this is not likely a tool you will see impacting this market on a high frequency, but when it does its worth paying attention to. There is some harmony with the current low and the 2008 low. It would be worthwhile exploring any notable relationship between the two.
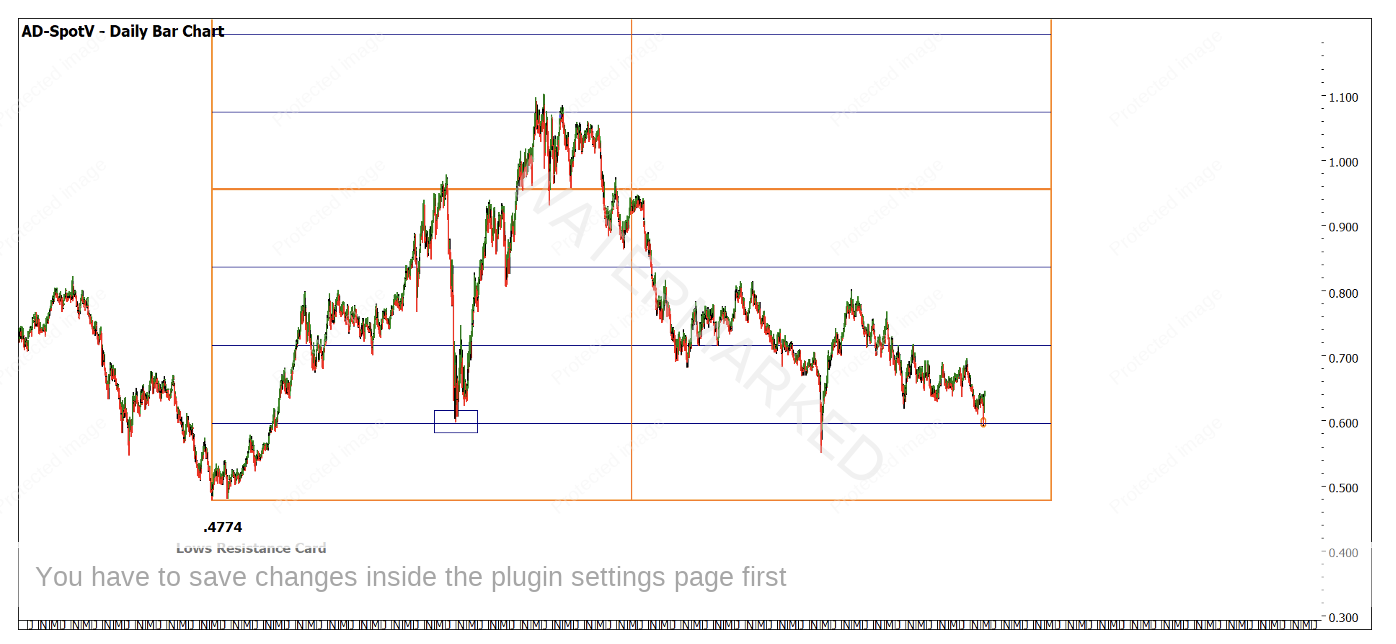
Chart 6 – AD-Spotv Daily Bar Chart
The takeaway here is that currencies are impacted like shares when economic tensions unfold. All these techniques could have been applied in advance to identify price clusters to watch the market react to. Hindsight is needed when learning and putting the puzzle together, now we can watch as the price action unfolds, there is definitely resistance at current levels, but a breakout above could allow for some good trading ranges.
Good Trading
Aaron Lynch