Degrees of Time
Time by Degrees has the ability to be the backbone of a great trading plan. Seasonal Dates which comes from W.D. Gann’s ‘Seasonal Changes on Stocks’ gives us 10 dates to watch for during the year.
The 6 August low was the first real seasonal date hit for 2024 on the SPI200 and then just before Christmas when your attention is probably winding down, a monthly swing low on the December Seasonal date hit flush on a 50% retracement.
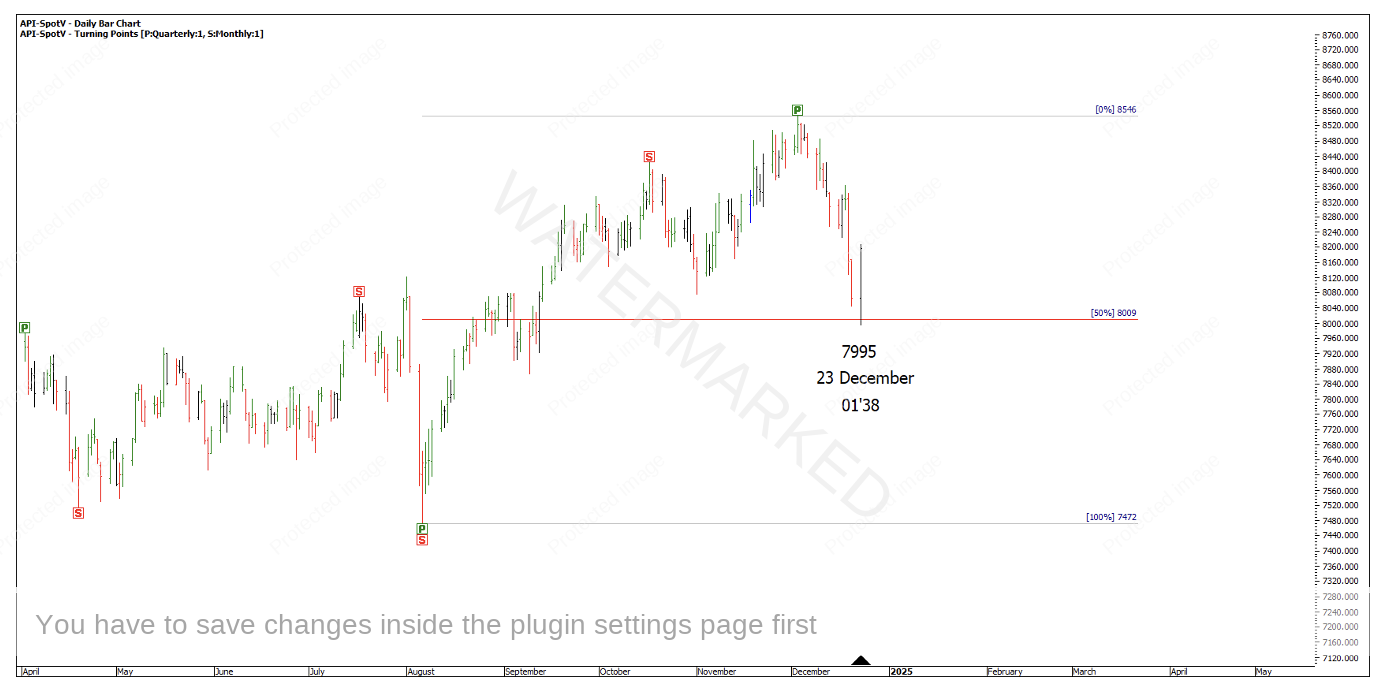
Chart 1 – Setup
This is the basis of a great setup. If I use my other price forecasting tools, 150% of the last weekly swing range gave a price target of 8025 and 250% of the daily First Range Out gave a price target of 8002.5
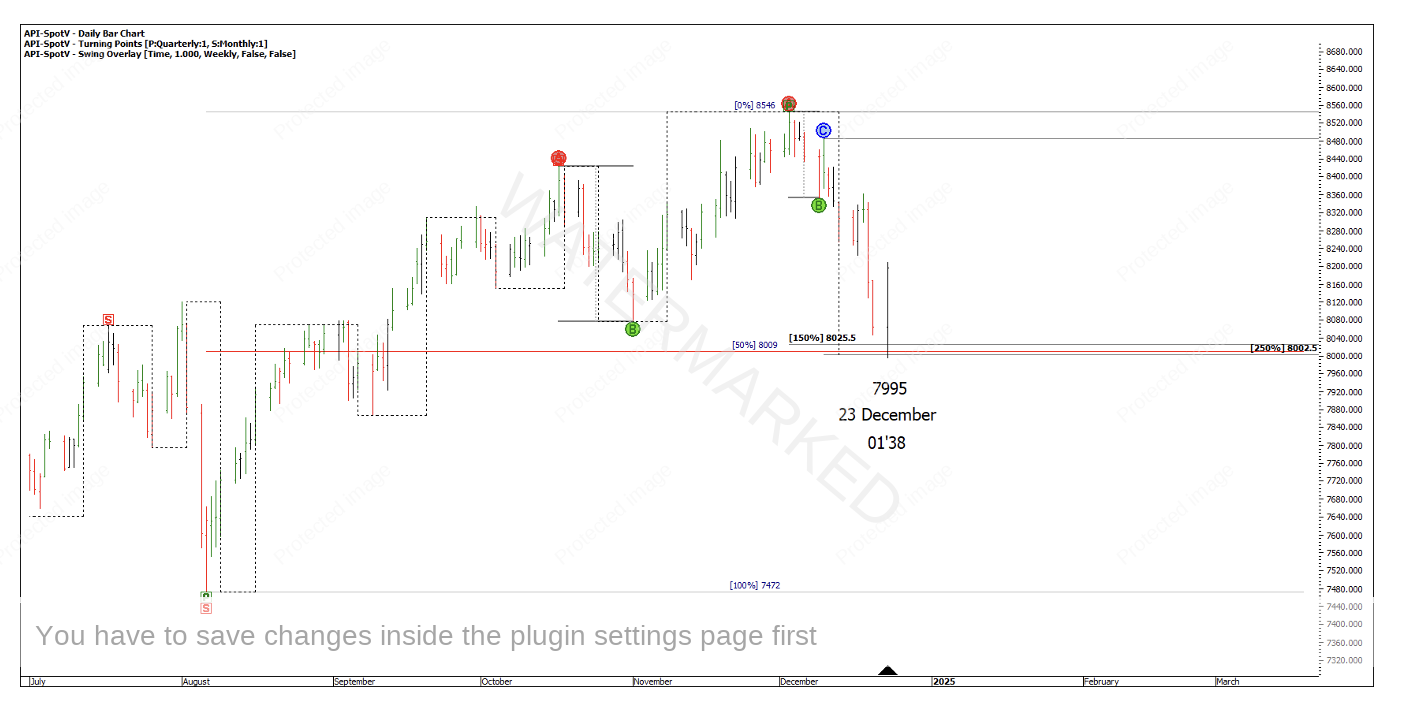
Chart 2 – Cluster
250% of the First Range Out isn’t a milestone I always watch, but I have seen it produce quality turning points often enough to include it in my price forecasting.
David Bowden suggests with the Milestone Chart, 150% of any range is a possible new Point A. With an expanding daily swing into the 23 December low at 175%, I’m also happy to use this milestone to suggest a new Point A.
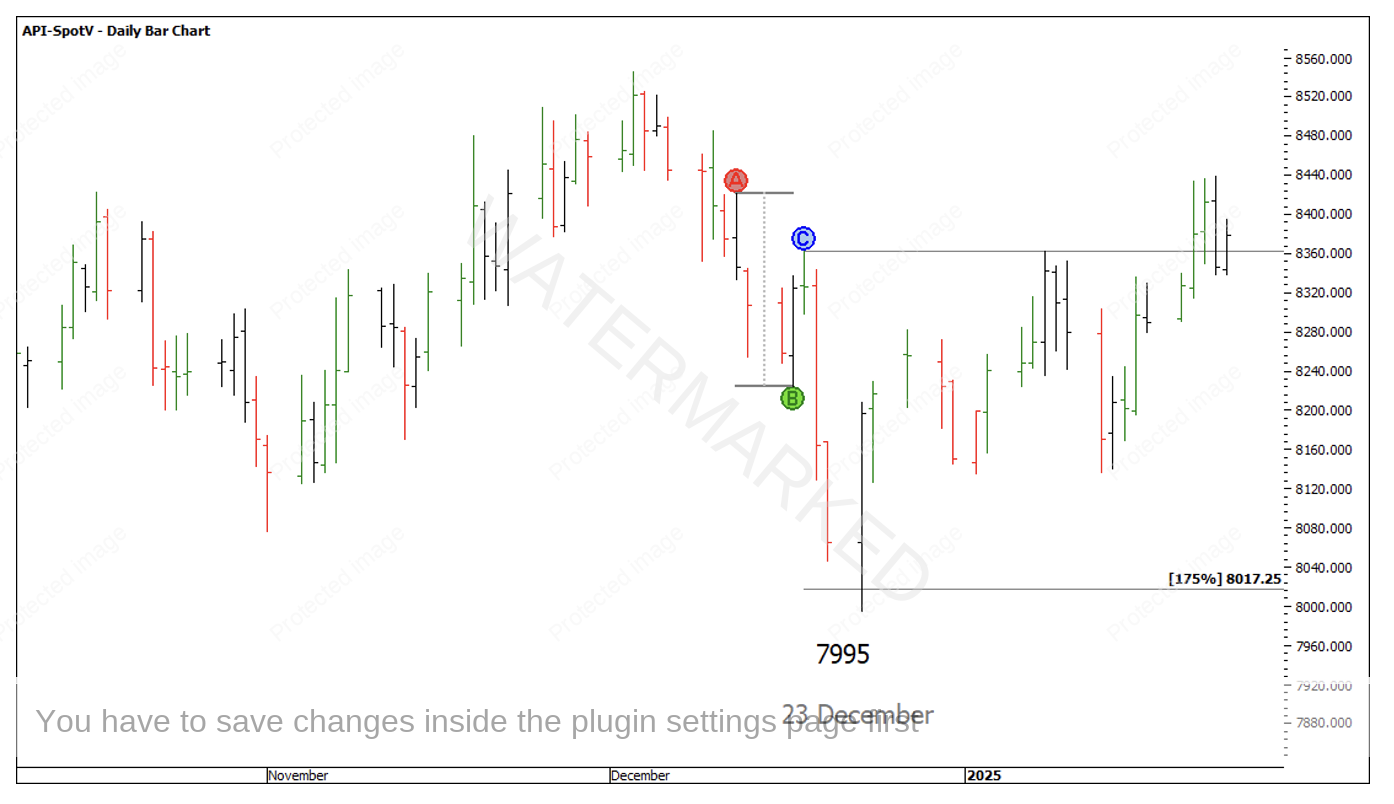
Chart 3 – 175% Daily Swing Range
Believing I’m in the last daily swing down, I can drop down a time frame to the 4-hour swing chart and look for extra evidence to support a price cluster and look for a smaller risk on entry, therefore boosting the Reward to Risk Ratio. Just as importantly, this gives you the ability to move stops to breakeven much sooner and covering the risk.
In this instance, there was a contracting 4-hour swing range that failed at the 50% milestone at 8019.
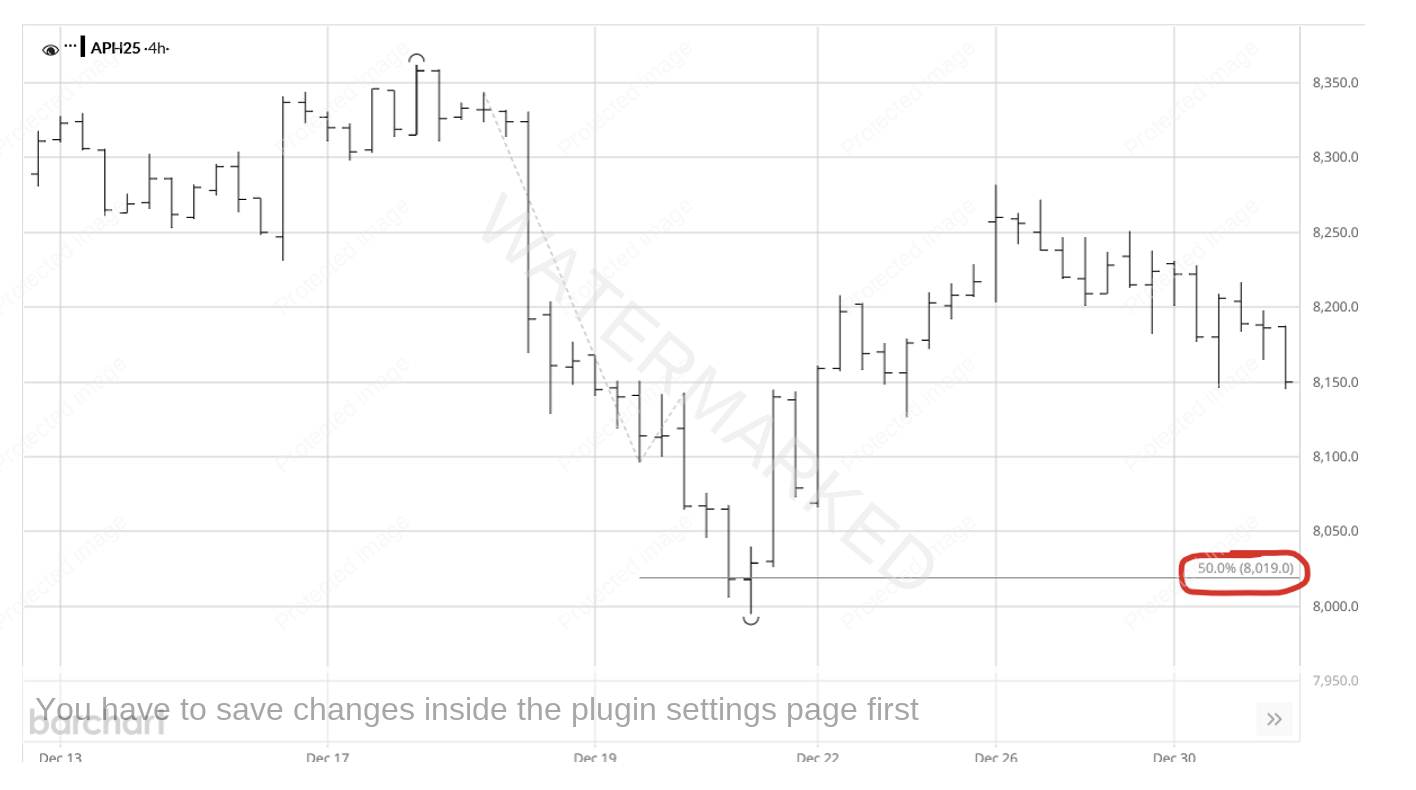
Chart 4 – 4 Hour Bar Chart
With a contracting 4-hour swing range into the 7995 low, that gives me the all clear to drop down another time frame to the 1-hour bar chart. Within that final 4-hour range I see either three or four 1-hour sections down, with two contracting 1-hour swings into the low. 4 Multiples of the 1 hour First Range Out also gave a price target of 8018.
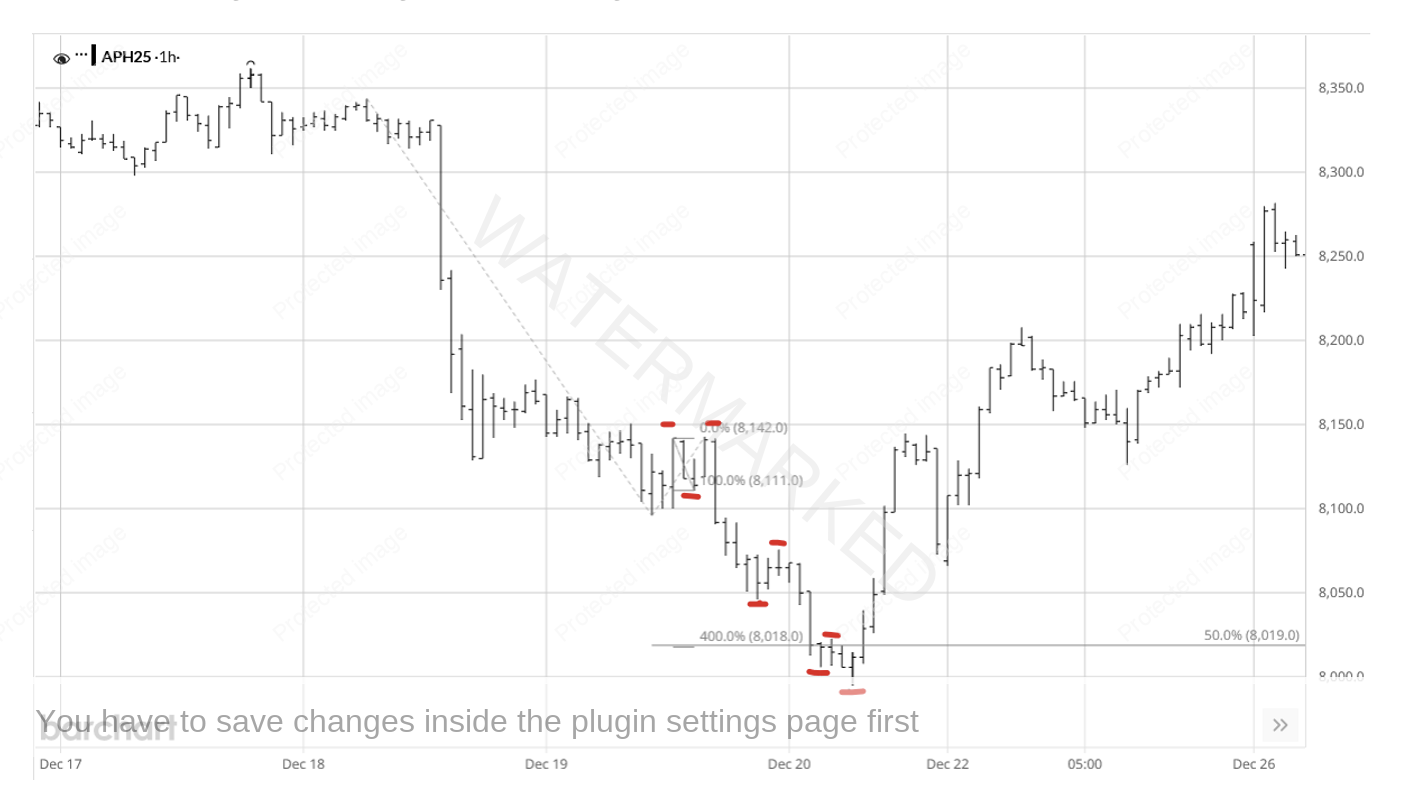
Chart 5 – 1 Hour Sections of the Market
If you had looked to enter as the 1-hour swing chart turned back up above the intraday milestones at 8020, with a stop loss at 7994, it would give you 26 points of risk. As the market started to make higher bottoms you could have moved your stop to breakeven.
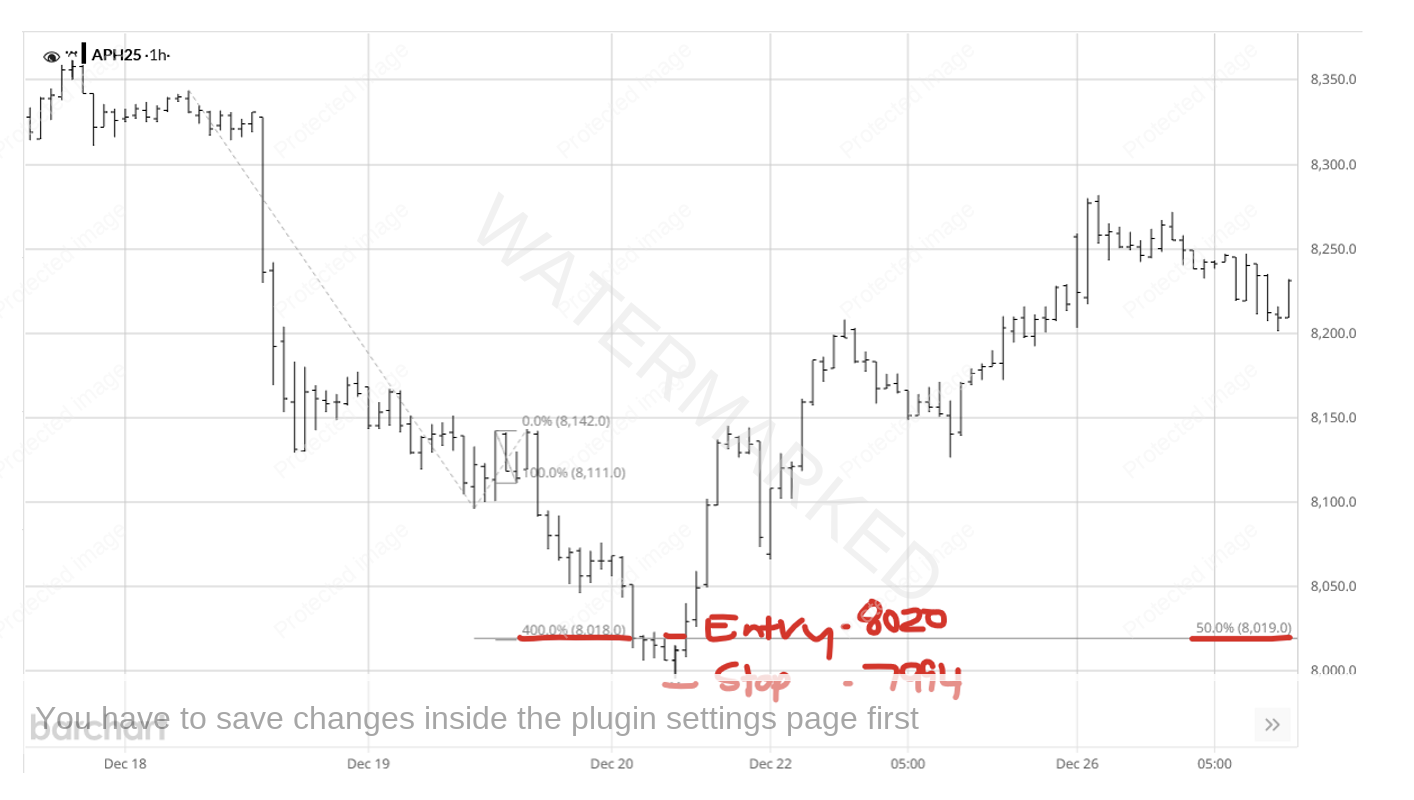
Chart 6 – 1 Hour Bar Chart Entry
Interestingly enough, you could have just banked a 10 to 1 Reward to Risk Ratio trade if you exited at 8280, and that was just the daily First Range Out!
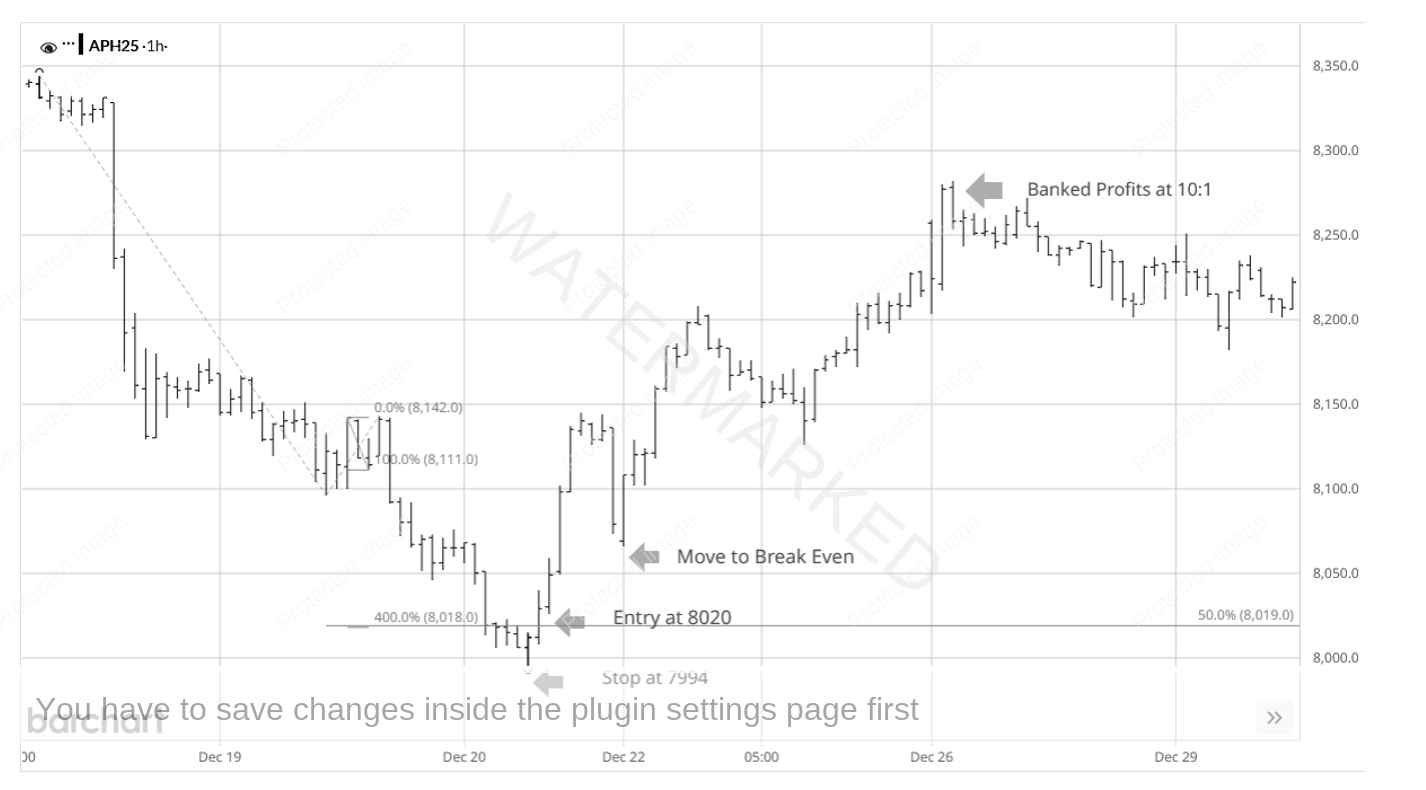
Chart 7 – Daily First Range Out
The hardest part about these setups is just waiting for them! Although the easiest way I’ve found is to do exactly what David Bowden said to do, draw up your own Degree Vibration Wall Chart and look at when the market is turning, then wait for your next Time by Degrees day.
Chart 8 below is a photo of my working 30-degree wall chart. Even though the classic Seasonal Dates didn’t provide many hits in 2024, there was a very strong vibration of turns in between 9-12 degrees.
Yellow – Weekly Turns
Green – Monthly Turns
Orange – Quarterly Turns
This date alone gave four weekly turning points and four monthly turning points for the year. So why not wait for your next Time by Degrees day then a couple of days before hand look for a price cluster? If they align, you have a potential trading opportunity.
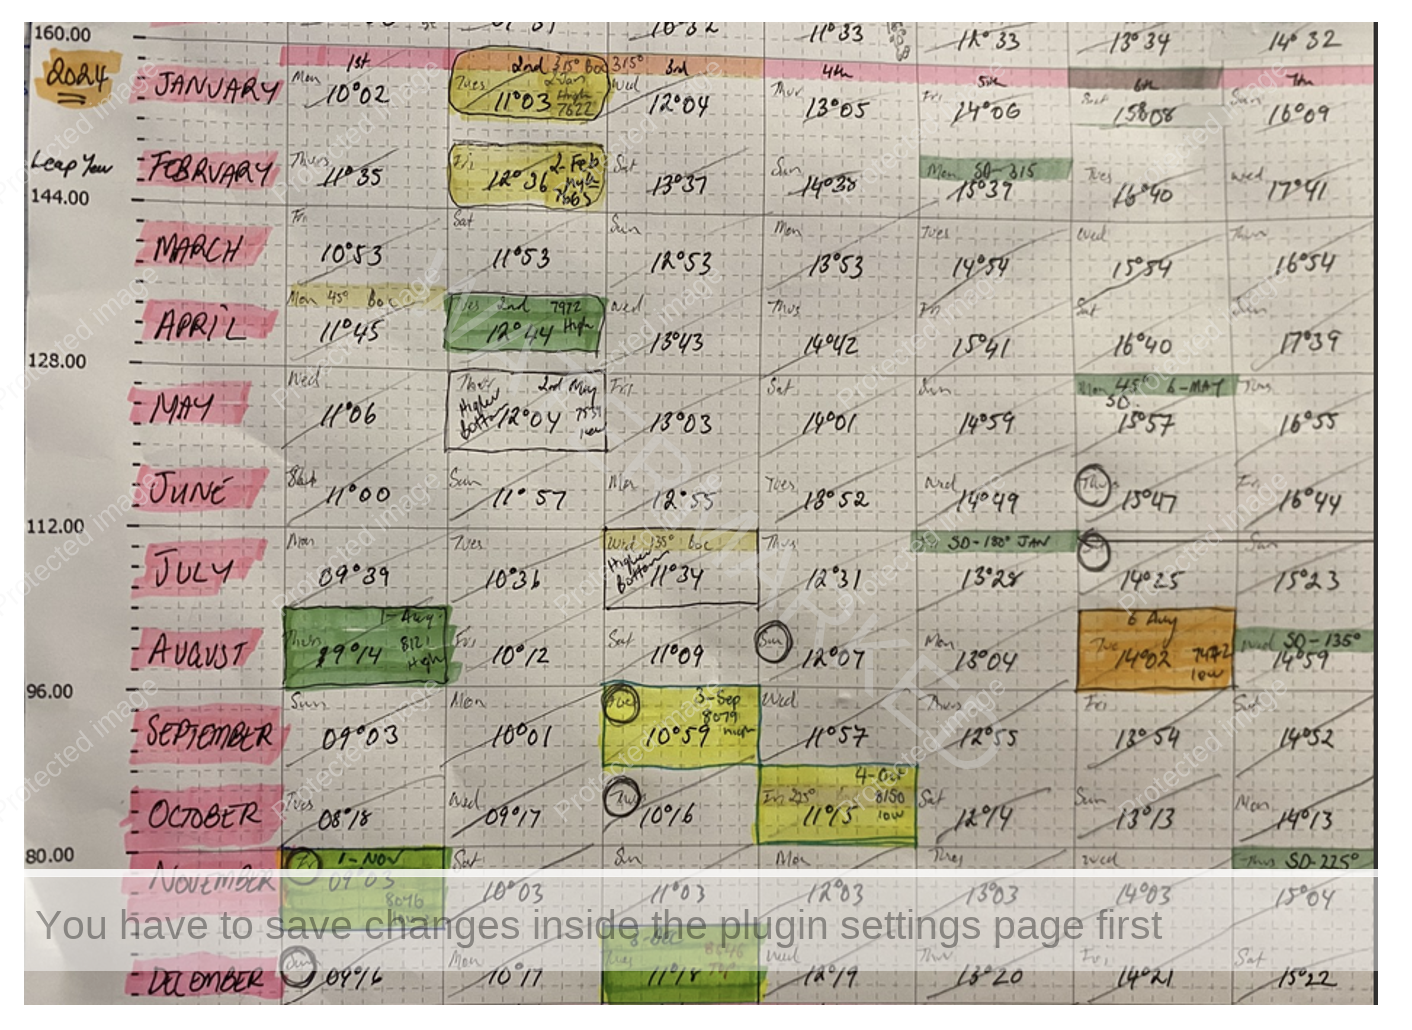
Chart 8 – Degree Vibration Wall Chart
The next Time by Degrees date we could watch for a price cluster is the birthdate of the SPI200, 16 February or 26 degrees 44 minutes. There was a clear line of vibration in 2024 with four weekly turns and one monthly turn around this time.
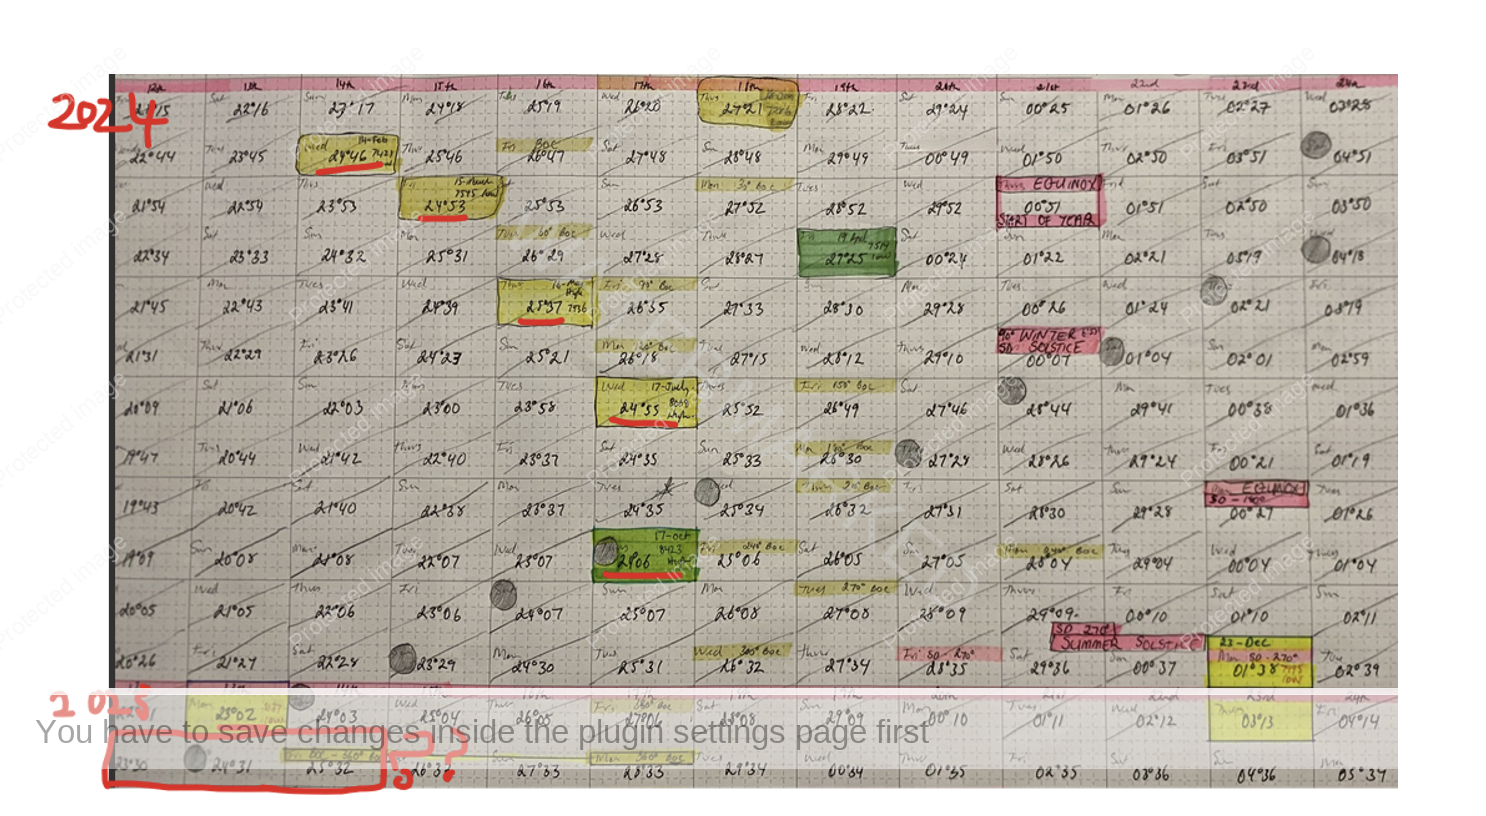
Chart 9 – Next Time by Degree Vibration
If there’s no strong price cluster around this date, then simply wait for the next date.
On the bigger picture and what you might call a monthly section, the current 31 January top of 8538 has reacted off the 50% milestone. This could prove to be an important hurdle for the SPI200, while it trades below 8532 it’s a lower top failing at 50%. Breaking above 8538 then 8546 puts the SPI back into new All Time Highs. Of course, you should always be wary of a false break double top!
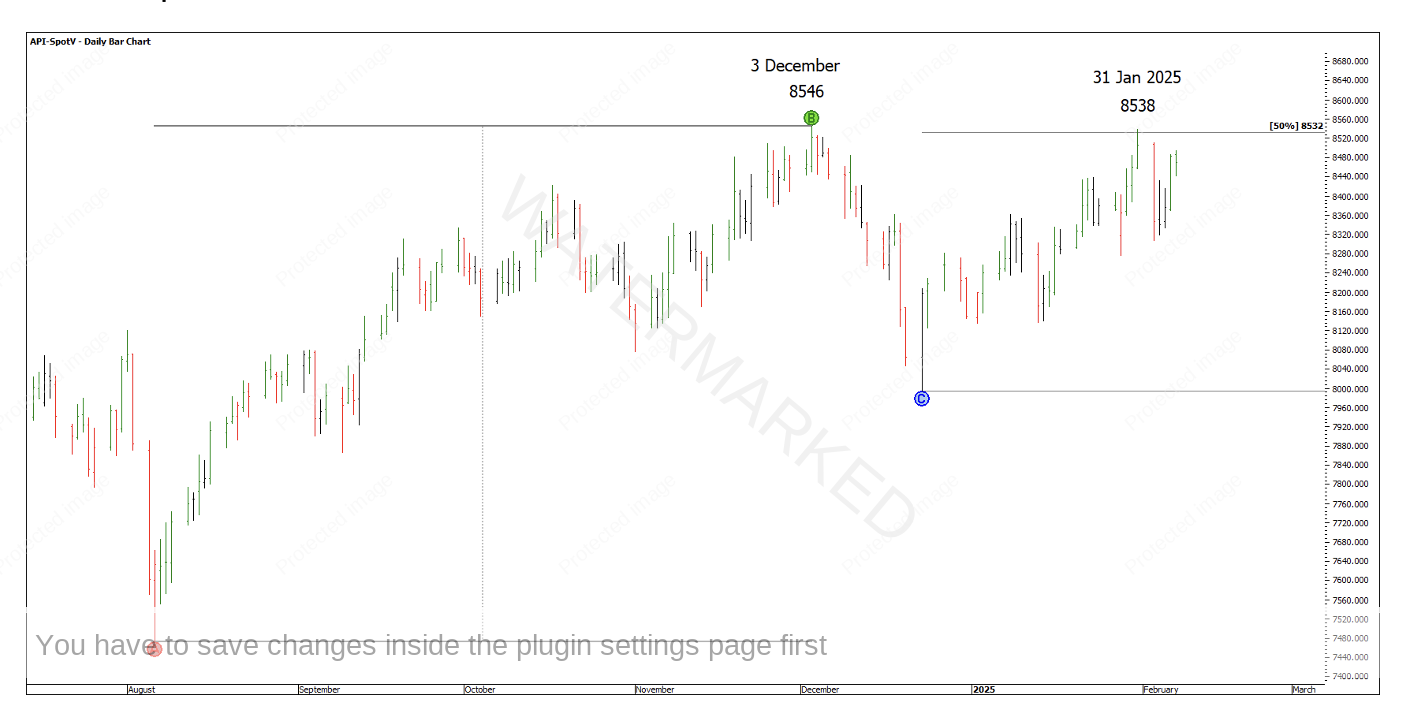
Chart 10 – Big Picture
Happy trading,
Gus Hingeley