Do The Simple Things Well
Welcome to August and one of my favourite parts of the year. The market typically starts to throw us some more opportunities, business leans into the calendar year as we concern ourselves with the year running out without us completing our to do list. This month has again provided me some amazement off the back of last month’s discussion on patterns and the Olympics being run and done in France. We do have the Paralympics coming up which is of interest in our house, but the markets have again proved the rules.
I have close to zero practical knowledge of the French markets and their main economic drivers. We know a lot from the tourist side of things and what we understand of its history and of course beautiful images of places to see. This is far from enough to make long term decisions on stocks to buy and hold, however, as traders we can simply look at the chart, ignore the label and place orders according to what we see.
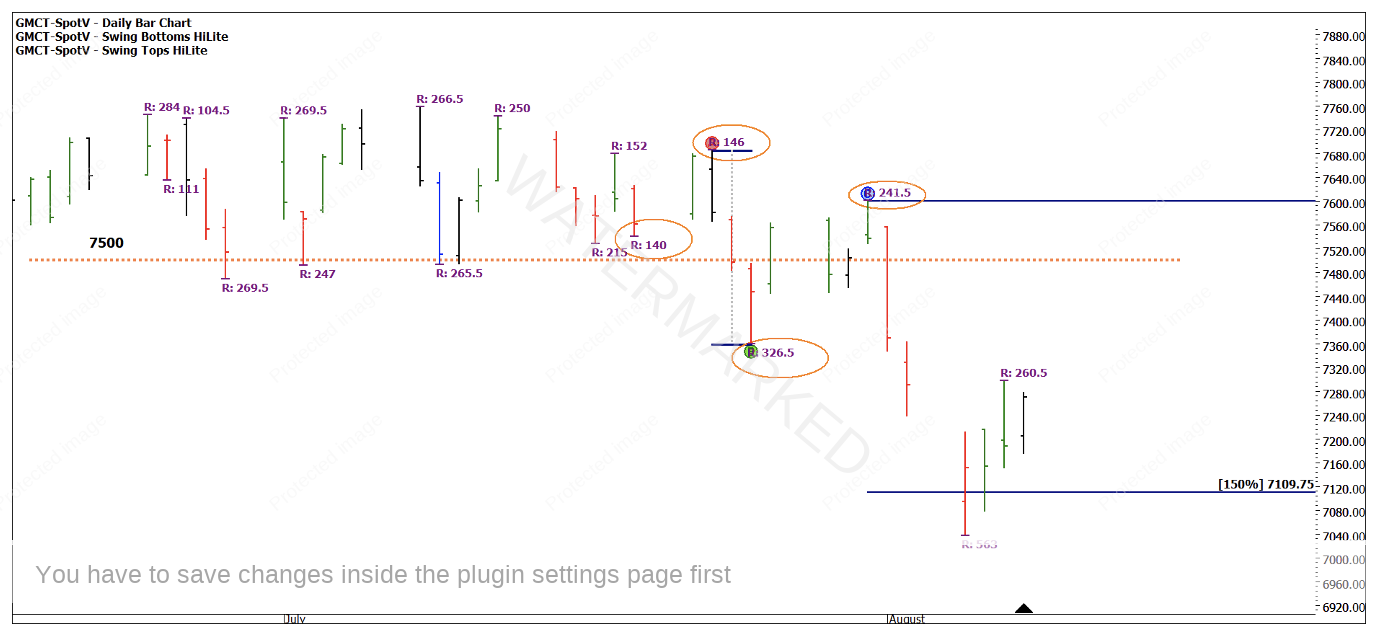
Last month we identified a sideways pattern that could be ripe for a breakout with the direction uncertain. Using Price Forecasting as a guide, we could see 7,500 as a key level. The next few charts break down how this has unfolded in the last few weeks and relies on some basic skills in an uncommon market.
Chart 1 shows the 7,500 level in orange and how an initial break to the downside was met with a lower top that could have been treated as an ABC trade in the simplest terms. Noted are the swing ranges as the downside range expanded, as did the upside B to C range. This was approximately a 75% retracement from the B to C range and may have been a negative for the trade. The open close reversal on what became Point C, 31 July 24, was a potential positive in the column for the short trade.
Chart 1- CAC-40 Daily Bar Chart
The entry could have been close to Point C in terms of risk and offered up a 5.5 to 1 Reward to Risk Ratio in 3 trading sessions.
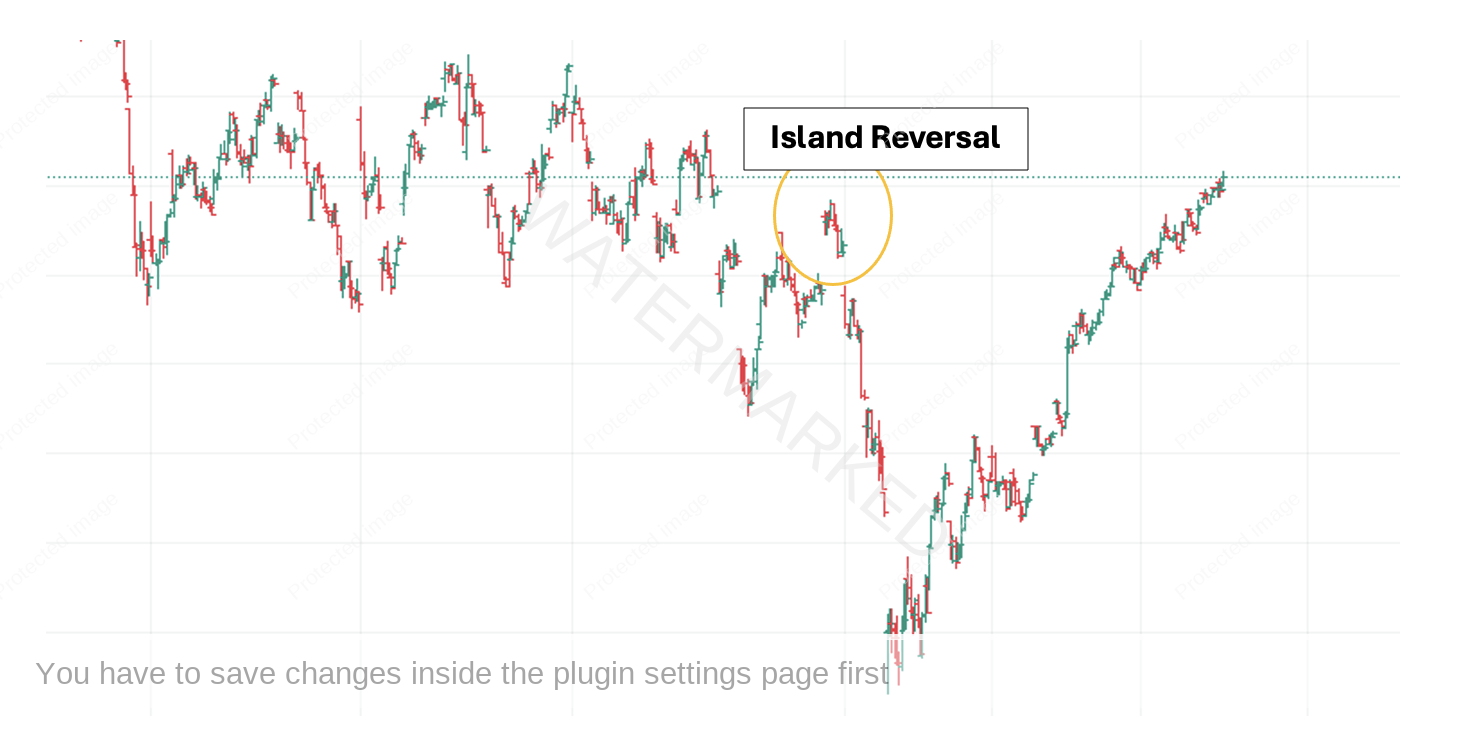
Another topic we discussed in July was Island Reversal Patterns on RIO, Chart 2 zooms to the intraday 1-hour chart.
Chart 2- CAC-40 1 hour Bar Chart
The main advantage in using the intraday island pattern is where we can have our initial stop (typically just behind the gap). This reduced the risk to 42 points or (420 Euro’s) as each point is 10 Euros and moves in 0.5 increments (5 Euros).
By running the short trade to 150% of the Reference Range we can see the Reward to Risk Ratio increase to 8.7 to 1.
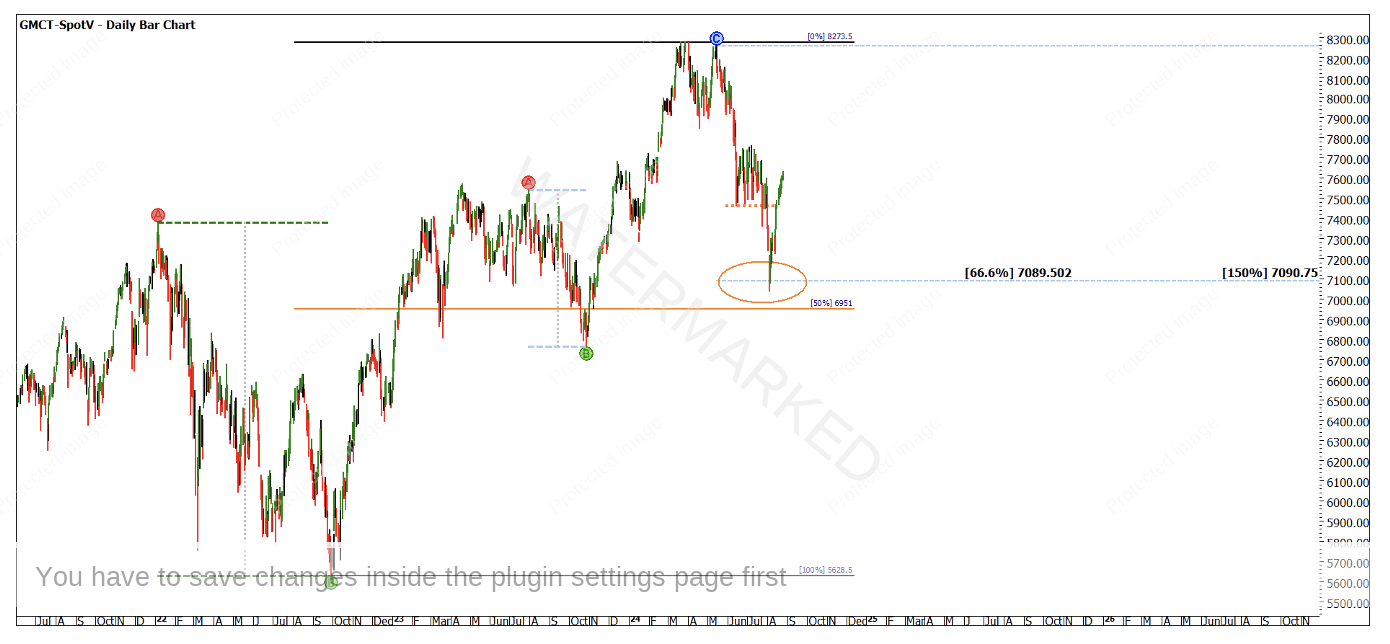
Keeping on the theme of doing simple things well, which David always encouraged, Chart 3 shows why you could have had confidence in the 150% level of the small picture ABC pattern in Chart 1.
Using two larger price pressure points for projecting ranges to the downside, we see two main ones that cluster at 7,089 and 7,091.
Chart 3- CAC-40 Daily Bar Chart
For those looking for some cycle patterns, there is some evidence from more advanced studies that January 2022 top and the August 2024 low have some harmony between them if you do some digging. One other major price aspect to consider for the 5th of August 2024 low is using a Lows Resistance Card from the 2022 low of 5,628.5.
If we multiply this low (as we do when using a Lows Card) by 125% we get 7,035 (the actual low came in at 7,036.5).
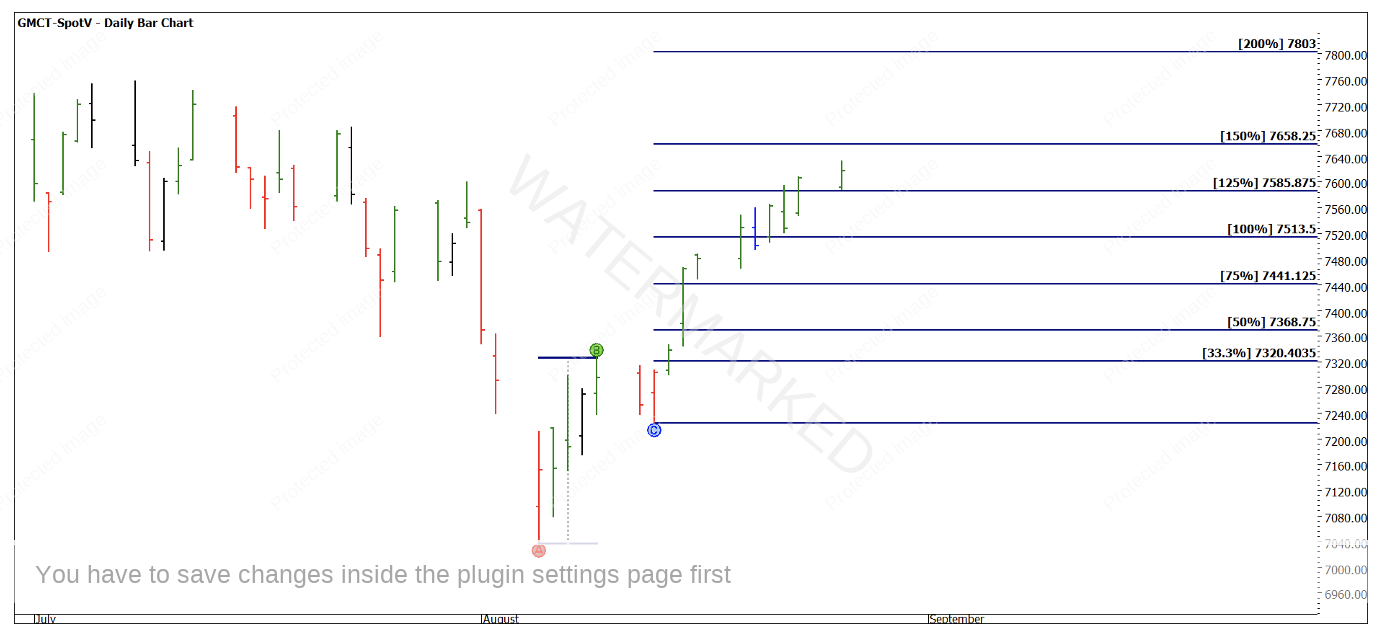
There is a case for the strategy to stop and reverse at this inflection point of the market. A first higher bottom on a 1-hour chart would have allowed entry at 7,077. I will reflect with a less aggressive stop and reverse on the daily chart with an entry using a first higher swing bottom.
Chart 4 looks at a daily bar chart and a first higher swing bottom entry. At approximately 7,310 a long entry was possible and if using basic milestones as a guide the long position is still open depending on trailing stops. The market closed at 7,617 at the time of writing so another 307-point range or 3,070 Euros per contract.
Chart 4- CAC-40 Daily Bar Chart
There are several layers to understand here but mostly combining perspectives with patterns and Price Forecasting has allowed for a profitable period of analysis. There is a good chance, like the Olympics, I could put this market on the shelf to be viewed again in 4 years. It’s a wonderful confirmation of how skills and basics once understood can throw out great trades with a limited amount of work. A reminder that there a number of ways to trade this index be it in futures or CFD’s. I have focused on the futures; the margin is approximately $3,500 AUD per contract.
Good Trading,
Aaron Lynch


