Do We Have Time?
When the market that you trade isn’t trending strongly enough for you and making the ranges, it may be time to mix things up and go looking for a market that is trending or has the potential to trend and look for a familiar setup.
One that comes to mind is Bitcoin. Love it or hate it, there are trading opportunities on this market as it can so often be a strongly trending market. The setup I see at the moment is a false break double top followed by an Overbalance in Price on the weekly swing chart.
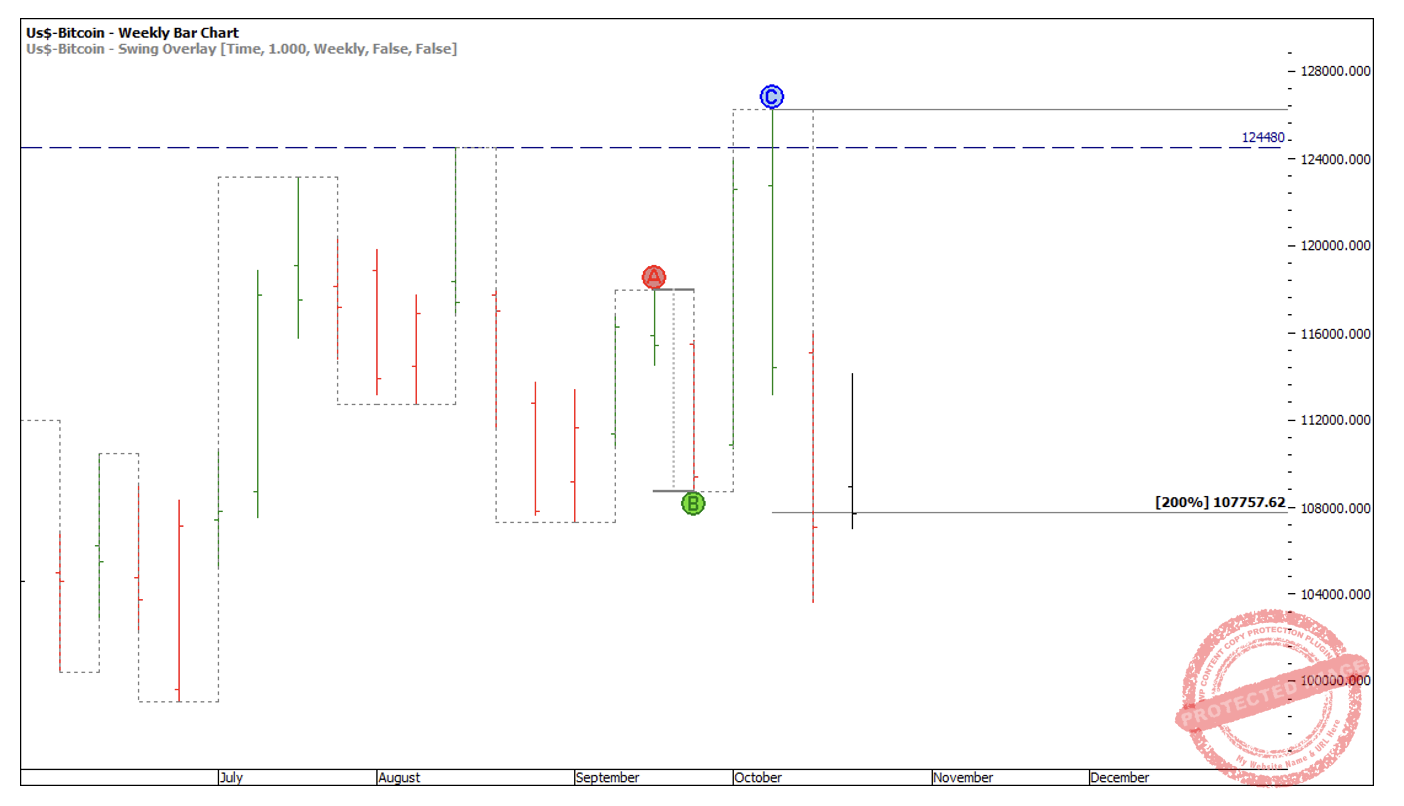
Chart 1
Two tops at the same level doesn’t automatically mean a short trade so to confirm this setup I want to take a look at the big picture. In Chart 2 below, you can see the yearly swing chart looks like it only has three swings in it. It actually has 5 swings however the early swings are so small in comparison there is no point including it in this bigger picture analysis. Nonetheless, the major range shows this market has hit 150% of the previous major range.

Chart 2
If we drop down to the quarterly range that makes up this last yearly swing and examine position of the market, my interpretation shows three sections up, with the third a contracting swing range.
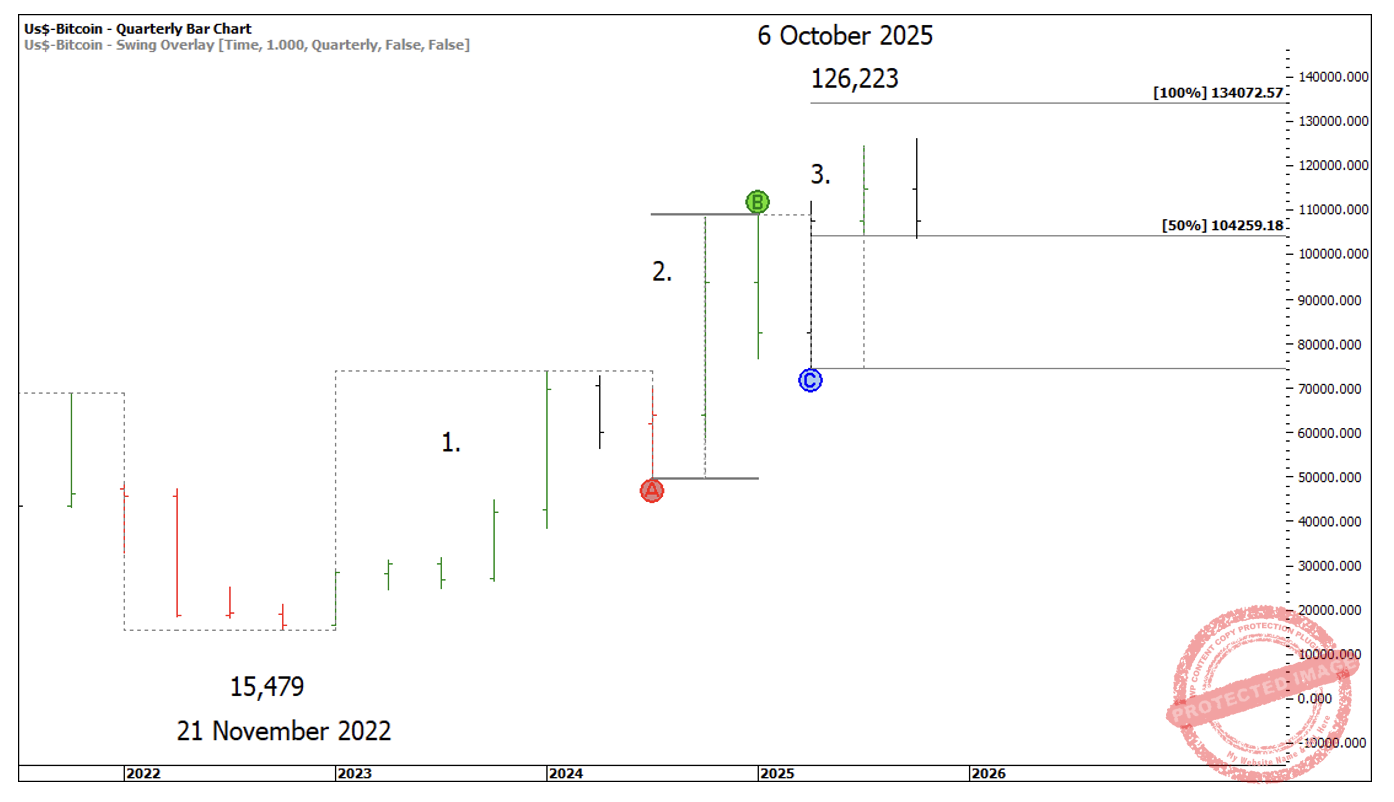
Chart 3
Sections of the market can be one of the most useful tools for understanding the overall structure of the market and how much a market may have in its current move. It’s been nearly 3 years of solid bull market, with the low made on 21 November 2022. Three quarterly swings up into 150% of the yearly swing range.
W.D. Gann suggests we watch for 3 to 4 sections for a bull or bear market to unfold. So, what other tools at our disposal could we look at to try and work out if we are looking at a short-term top or a longer-term top?
Applying a Lows Resistance Card from the 15,479 low, we can see the market making its double tops on 8 multiples of the 15,479 low.
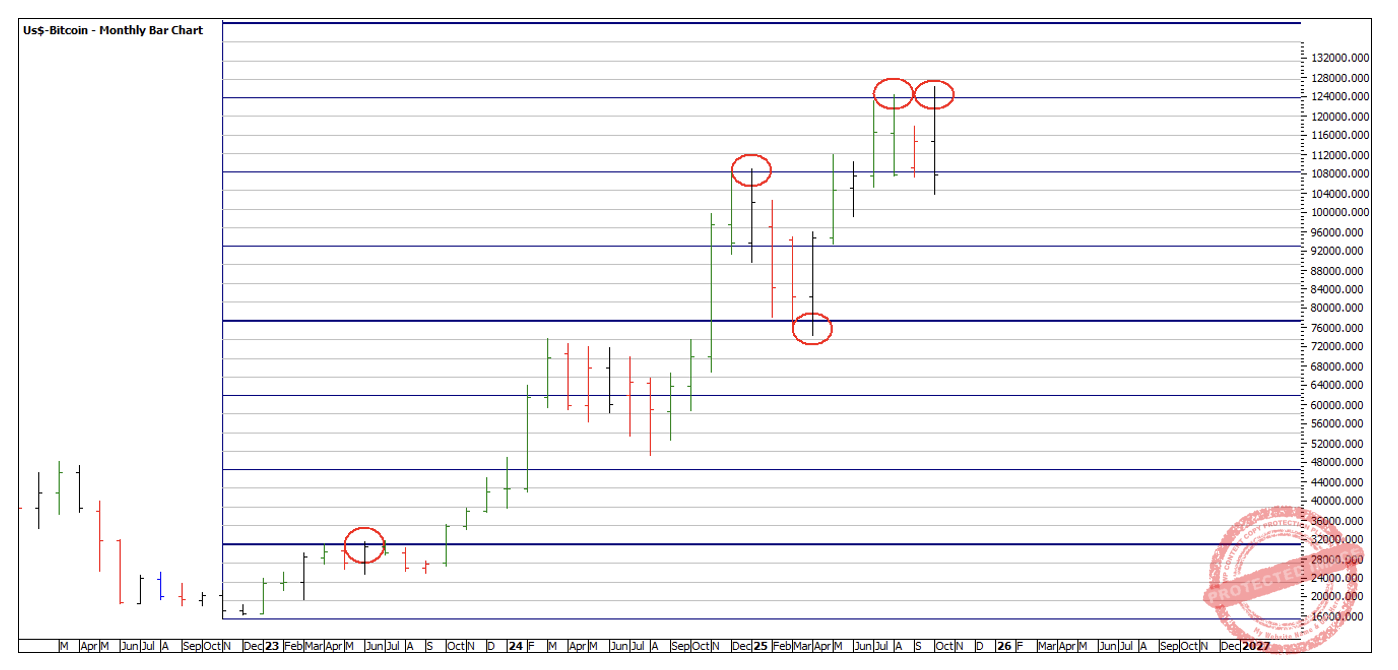
Chart 4
Do we have time harmony? This current bull market started on 21 November 2022 and so far has lasted 1050 days.
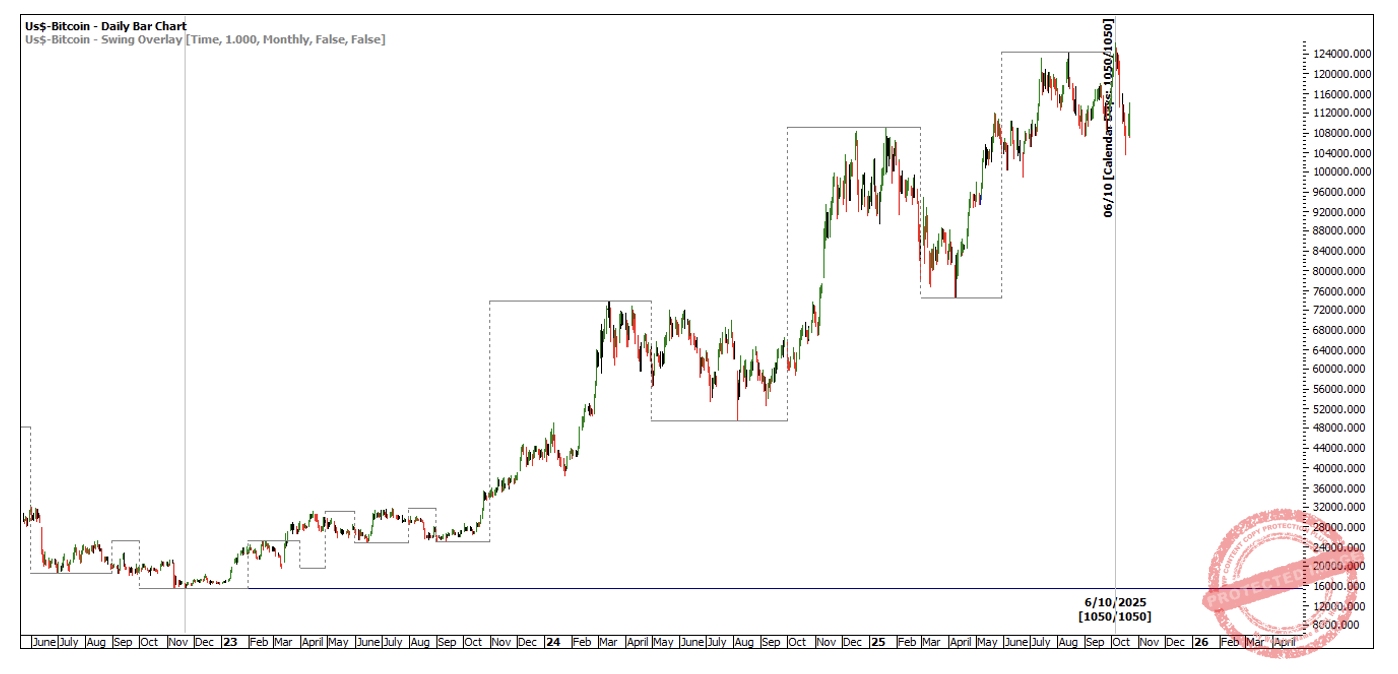
Chart 5
Interestingly enough, the major bull market range from 14 December 2018 to 10 November 2021 was 1062 days, just 12 days more.
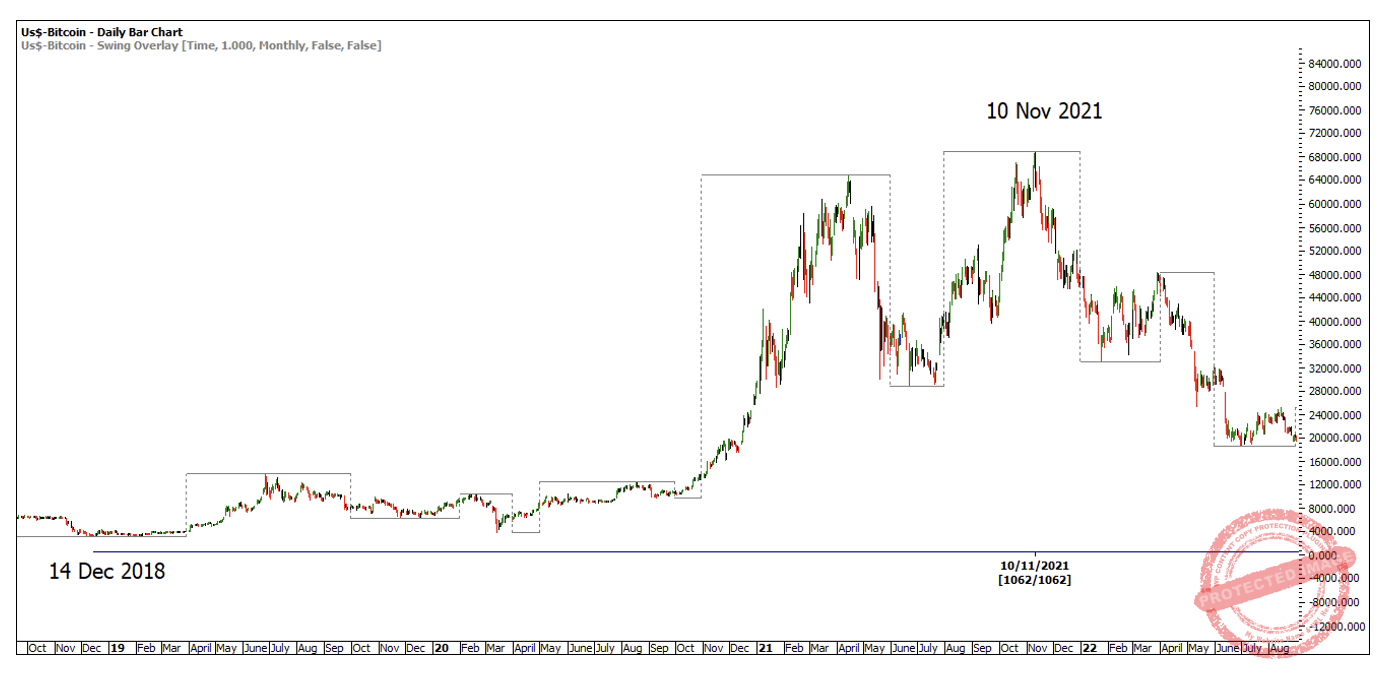
Chart 6
Also, the bull market that started from 14 January 2015 until 18 December 2017, lasted for 1069 days.
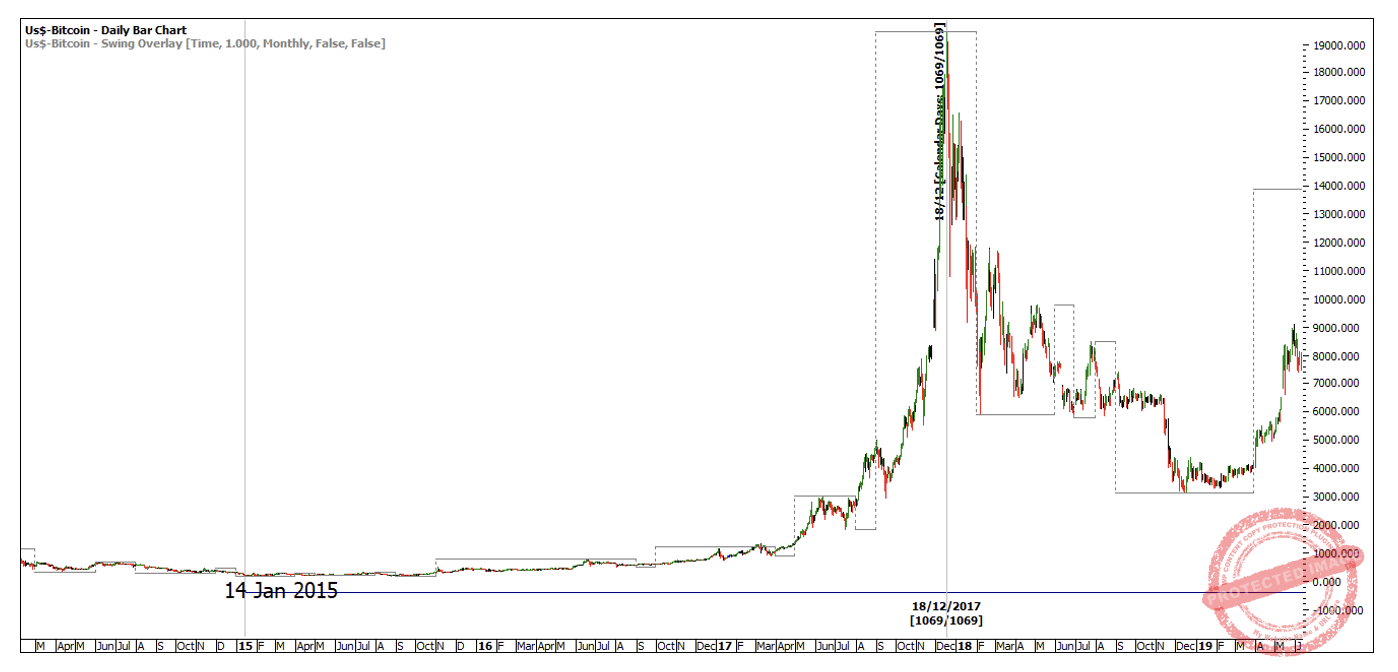
Chart 7
What followed from the 2017 bull market high and the 2021 bull market high was about a year of bear market. Are we now looking down the barrel of a Bitcoin bear market?
My analysis has got me to a starting point. Form Reading, Price Forecasting, Sections of the Market and Time Balance indicate to me the potential for this bull run to be over. Although it’s only potential, and I still need to wait for a high-quality setup that meets my trading plan before I even think about taking a trade and risk my capital.
Happy Trading,
Gus