Dollar Dramas
The road ahead for markets and their broader underlying “real” economies continue to be distracted by the challenges of our time. The decade of low interest rates and low inflation is likely to be followed by a period of the reverse: high rates and higher inflation. The question of short-term inflation being a shock due to Covid, supply chain and the Ukraine is starting to evaporate, as many start to concede the massive amount of money printing and debt creation over the last decade is starting to deliver the structural issues into the future for governments, markets and of course the punters on main street.
Over the years I have found my groove with hard commodities and suggest to you all its about finding what works for you and get your groove. I have always been interested in currencies as their size, scale and movements lead to exceptional opportunities when managed well. The king of all currencies remains the US dollar but depending on what fringe or mainstream website you obtain your fix from, there is a concern that currency wars are on in earnest, and we can’t simply ignore currencies as they do impact nearly all instruments in one way or another.
You can avail yourself of the history lessons of how and why the US dollar sits at the peak of the reserve currency list. The US has a vested interest in staying top of the tree and it will fight tooth and nail to maintain that position. We can theorise that several conflicts historically have at least, in part, occurred to preserve the US dollar as the benchmark. The recent increase of interest rates in the US to tame inflation has in turn fired the US dollar higher in the form of the US Dollar Index (DX-Spotv in ProfitSource). To measure strength or weakness in any asset we must have a measurement to compare against, as we cannot compare the relative strength of the dollar versus itself, the Dollar Index provides a measuring stick against a basket of “other major currencies” to obtain its relative strength.
Of course, there are ways to measure one currency against another (as in a direct pair). The Dollar Index allows for a broader comparison and as an economic indicator. Most hard assets are valued in USD and many US companies generate earnings outside the US i.e. Microsoft, so an increased US dollar will mean less earnings in external markets that likely deliver earnings in yen, euro, yuan, rubble or even AUD.
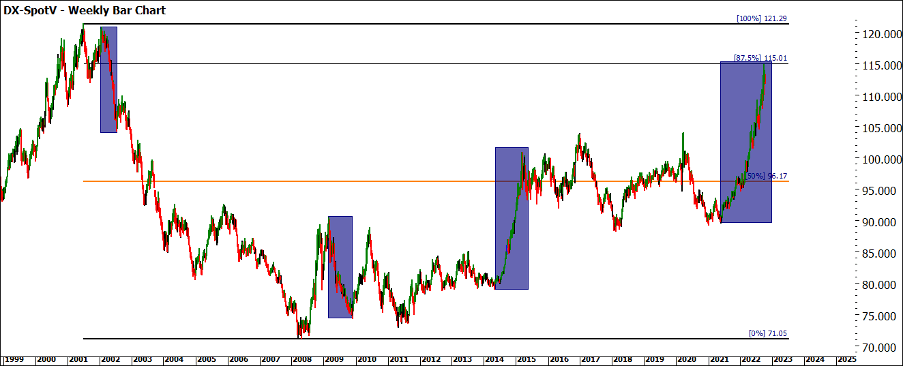
Chart 1 shows us the last 20 years of the major high and low to reference the current price action. The high of 2001 and low of 2008 still hold the current range within, the current price action is approximately 87.5% of the range. I have highlighted some areas in rectangles that show how quickly in either direction this market can accelerate.
Chart 1 – Weekly Bar Chart Dx-Spotv
Over the years as our experience in analysis develops, we start to see some markets cycle with natural numbers. Other markets can move to their own beat, and they throw out numbers that we don’t automatically identify as Gann based. David introduces us to speed angles to be able to measure a market price and time movement and we can see if they are running at the same rate, faster or slower.
The use of a Gann Box delivers a similar result with the market providing the tune of price and time and we can then “retrofit” back into a 3rd Dimension tool. I mention this not as a holy grail but a reminder of the tools we have at our disposal with which to measure history repeating.
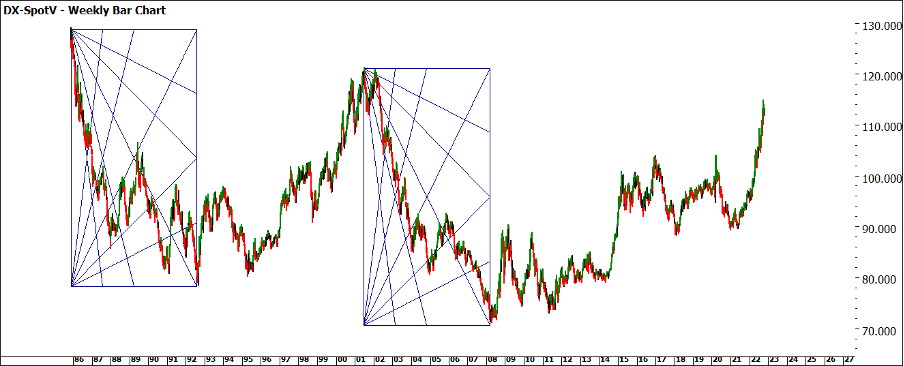
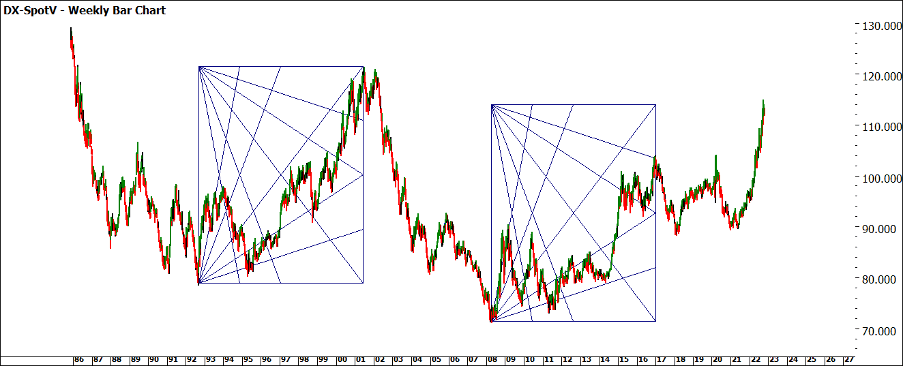
The Dollar Index is a market that historically delivers results by boxing the market and I include some historical examples.
Chart 2 – Weekly Bar Chart Dx-Spotv
Chart 3 – Weekly Bar Chart Dx-Spotv
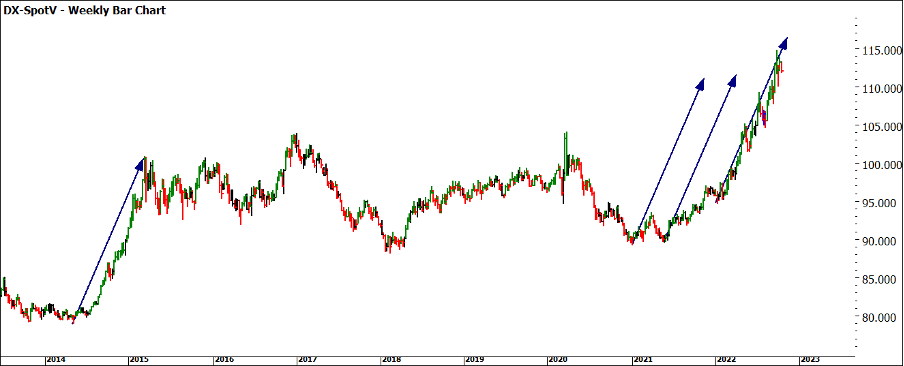
A simplified way of measuring a market move is to measure it as a speed angle and walk it forward to test its use in the current price action. The speed that the current upside has produced has startled many, if we travel back to 2014 and use that movement, we can see a similar pitch in price when applied to the 2022 low. The double bottoms in 2021 did not produce the same pitch and therefore we could suggest that a different “tune” was calling the market as this time.
Chart 4 – Weekly Bar Chart Dx-Spotv
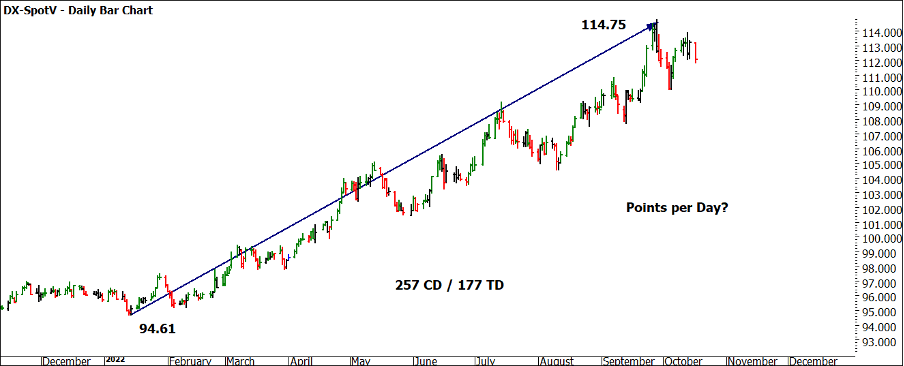
David used Boxing the Market in his big picture work and forecasting, at this stage I am suggesting it could be more of a way to get in sync with the heartbeat of the market. Chart 5 shows the most recent run in 2022 from its low to the current high. The movement has a price and time component (that can be measured two ways) and in doing so tells us about the points per day movement over that time (effectively its own 1 x 1 angle).
Chart 5 – Daily Bar Chart Dx-Spotv
We can then use this data to better understand if this move is in line with its previous history or creating a new heartbeat to follow. The current late September high is an interesting place to watch, the price action is moving sideways away from that high, with the first weekly lower swing top since January this year.
A movement in the US dollar pricing in either direction will add fuel to many markets, so understanding how it is moving can assist you in viewing the other markets you are involved in, especially commodities.
Good Trading
Aaron Lynch
