Don’t Fight the Fifty!
Welcome to the June edition of the Platinum Newsletter! I started writing this article on 15 June after coming back from a few weeks of rest and as such, I’ve just finished catching up on what I’ve missed. I’ve gone through the process of updating my hand charts, scrolling through my saved chart pages in ProfitSource and updating them where necessary.
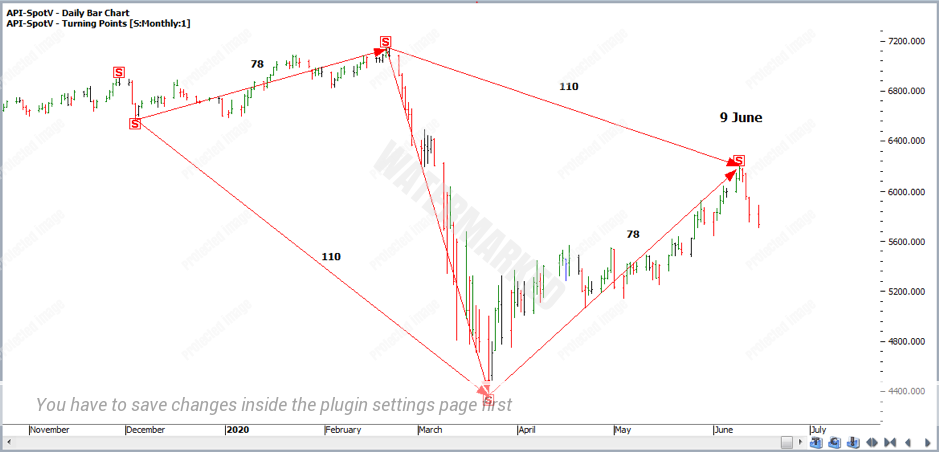
As I update my time counts, one thing I’ve noticed on the SPI is the current 9 June top is 78 days up from the 23 March low which is a 100% repeat in time of the previous monthly swing range up. That gives a balancing of time of 78 days up and 110 days bottom to bottom, top to top cycle.
Chart 1
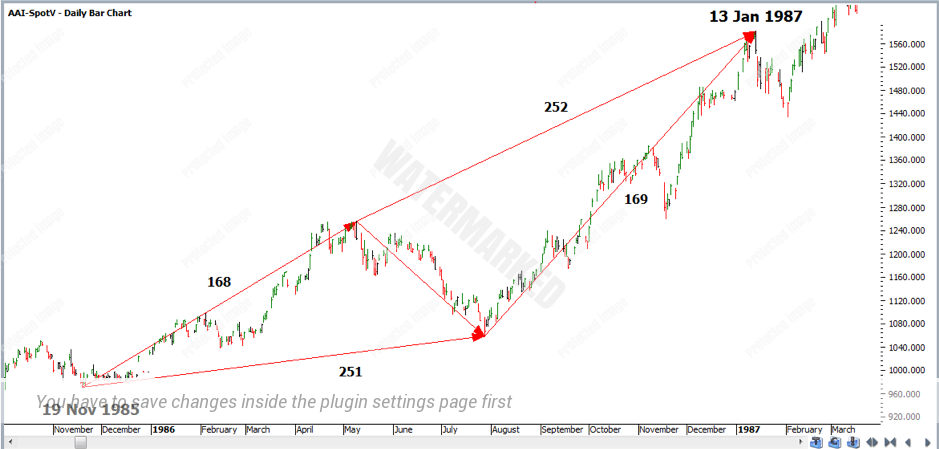
I first learnt about a balancing of time from the Ultimate Gann Course when David explained his forecast for the 13 January 1987 top and the 169-day run-up to balance out the 252-day cycle.
Chart 2
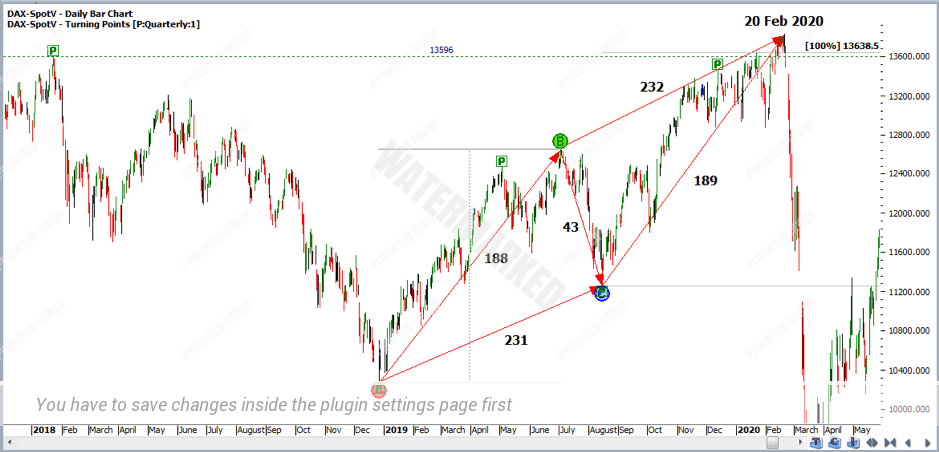
A more recent example still very fresh in my memory was the 20 February DAX Double Tops, only one day out from being an exact repeating time frame of 189 days with a repeating quarterly swing range.
Chart 3
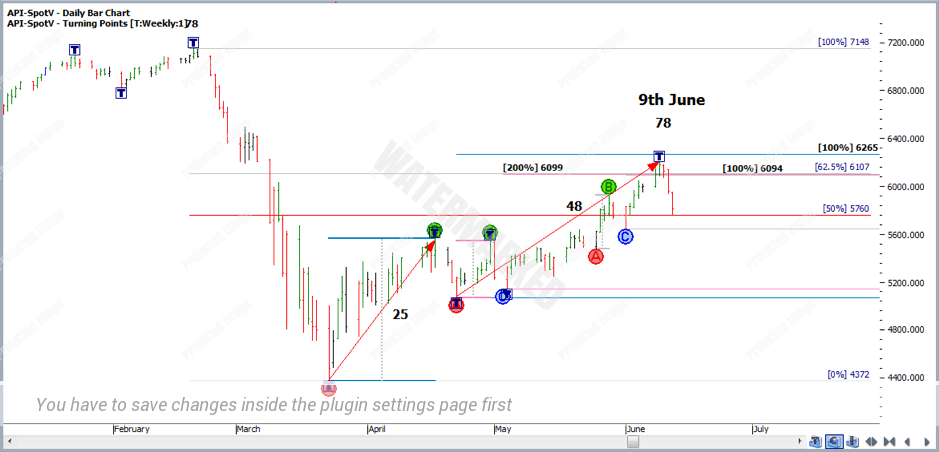
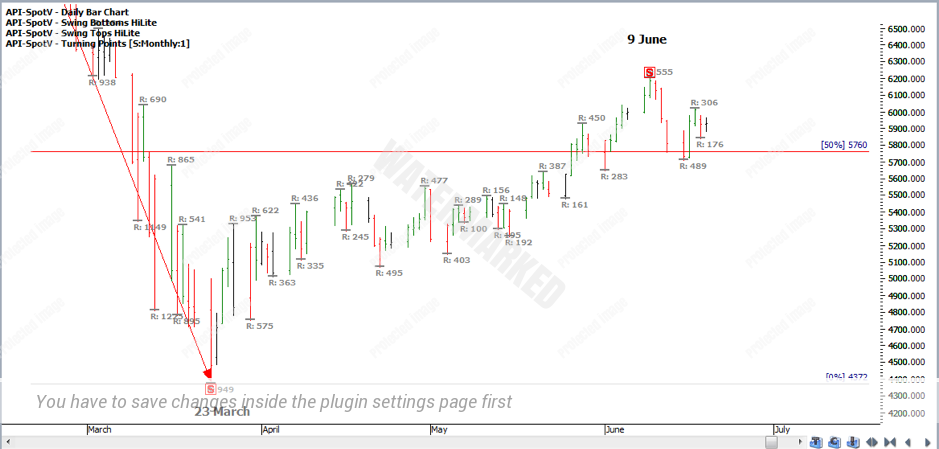
If the run down from 20 Feb top to the 23 March low on the SPI is going to be a First Range Out, then we know using our Position of the Market rules to look for a re-test or lower top. Could this lower top come in at a 62.5% retracement? I can break down the current monthly range up using Position of the Market into two weekly sections. Section 2 has just failed to reach the 100% price milestone of Section 1 in nearly 200% of the time, 25 days compared with 48 days. The 200% price milestone of Section 2 FRO gives 6099 and 100% of the last daily swing range gives 6094 which clusters with a 62.5% retracement of 6107. The SPI has false broken this little cluster and is now trading below it; however, it does show an expanding daily swing range up and has failed to reach the weekly 100% price target of 6265. A few mixed signals there I feel.
Chart 4
However as always, the market can be full of surprises and as I mentioned in my last article regarding Wesfarmers, having a few different scenarios can really help to keep your mind open for any subtle signals that the market throws up. So if the setup doesn’t smell right, you don’t burn up your emotional and financial capital.
Gann mentions that you can make a fortune out of the 50% milestone alone. Well, I believe it can also save you a fortune!
In this case, the SPI is still trading above the 50% retracement and what wouldn’t smell right to me would be if the market now makes a higher bottom on or above the 50%. Now if my form reading is correct and we do see a higher bottom on the 50%, I won’t be looking for an entry short until a better signal presents itself later. However, if the market breaks below the 50% retracement giving a clear Overbalance in Price to the downside, then I would be happy to look for an entry as it moves away south of this point.
Last Tuesday 16 June confirmed a higher bottom on 50%, and as of Friday 19 June the SPI is still showing a contracting daily swing down above this level.
Chart 5
I’m not willing to fight the tide by trading short into a 50% that is currently acting as a Point B support! Our Time analysis has helped to call the 9 June top, however, form reading the 50% has also played a big part of my analysis and kept me out of jumping in short. So, for now, I’m utilising my biggest advantage as a trader, being out of the market and waiting for the next potential high-quality trade setup.
One comment I feel worth remembering at the moment is, ‘If the market is still going up on bad news it’s strong’. Well it seems to me there has been a lot of bad news lately and the market is still finding a way to go up. Until it proves otherwise I can watch, wait and learn.
Happy Trading,
Gus
